BTC & USDT.D => Bullish Correction Incoming?Hello TradingView Family / Fellow Traders. This is Richard, also known as theSignalyst.
Both BTC and USDT.D are sitting around key rejection zones.
💰 BTC is hovering near the $100,000 level — a major previous low and a psychological round number.
📊 Meanwhile, USDT.D is testing the 5% resistance — a supply zone and another critical round number.
As long as $100,000 holds as support on BTC and 5.1% holds as resistance on USDT.D, we could expect a bullish correction across the crypto market.
What do you think? Will these levels hold or break? 🤔
📚 Always follow your trading plan regarding entry, risk management, and trade management.
Good luck!
All Strategies Are Good; If Managed Properly!
~Rich
Btc-usdt

Bitcoin Strategic Interval – Latency & Asymmetric Bias.⊢
⟁ BTC/USD – Binance – (CHART: 1D) – (June 20, 2025).
⟐ Analysis Price: $106,025.88.
⊢
⨀ I. Temporal Axis – Strategic Interval – (1D):
▦ EMA21 – ($105,772.44):
∴ The price remains fractionally above EMA21, retaking the short-term reactive axis;
∴ Despite prior rejection, current candle shows renewed traction with a solid close above;
∴ The slope is flat–rising, signaling the potential reactivation of local trend continuation.
✴️ Conclusion: EMA21 is tentatively reclaimed – a short-term bullish signal under close scrutiny.
⊢
▦ SMA200 – ($95,921.92):
∴ Long-term structure preserved: price maintains a wide buffer over SMA200;
∴ The moving average exhibits a healthy upward slope, uninterrupted since Q4 2023;
∴ No technical threat detected to the macro-trend structure.
✴️ Conclusion: SMA200 acts as the primary institutional defense line. No stress present.
⊢
▦ Ichimoku Cloud – (105,899 | 105,738 | 102,433 | 105,576 | 106,025):
∴ Price is nestled precisely within the flat upper cloud band – a known zone of consolidation;
∴ Span A and B are beginning to flatten, suggesting temporary exhaustion of momentum;
∴ Chikou remains above price – confirming trend integrity.
✴️ Conclusion: Ichimoku signals a pause, not a break – directional clarity pending.
⊢
▦ MACD (12,26,9) – (Histogram: -364.87 | MACD: 257.20 | Signal: 622.06):
∴ Bearish histogram remains negative, but shrinking for three sessions;
∴ MACD line curling upward with initial convergence to Signal line;
∴ Reversal signal forming but not yet triggered.
✴️ Conclusion: Early signs of MACD cross; confirmation requires follow-through.
⊢
▦ RSI – (53.17 | Avg: 51.74):
∴ RSI reclaims neutral-positive zone, stabilizing above 50;
∴ Structure shows divergence fading, with momentum recovering slowly;
∴ Still far from exhaustion thresholds.
✴️ Conclusion: RSI favors the bulls with cautious optimism.
⊢
▦ Volume (Last 5 Days):
∴ Volume remains muted, averaging 110–120k Bitcoin/day;
∴ No aggressive buy or sell pressure confirmed;
∴ Current move lacks conviction – suggests passive spot activity.
✴️ Conclusion: Price is advancing without volume confirmation – fragility persists.
⊢
🜎 Strategic Insight – Technical Oracle:
∴ Structural trend remains intact and undisturbed on the macro scale;
∴ Short-term bullish reclaim of EMA21 within the cloud, but momentum and volume still lag;
∴ Absence of conviction demands validation from price action or macro catalyst.
⊢
∫ II. On-Chain Intelligence – (Source: CryptoQuant):
▦ 🝰 Exchange Inflow Mean - (MA7):
∴ Metric sits near historic lows (≈0.4 BTC), denoting multi-week suppression of inflows;
∴ Correlates directly with reduced sell-side pressure from whales and institutions;
∴ Price structure remains unchallenged by inflow spikes – consistent with strategic holding.
✴️ Conclusion: Absence of fear or distribution among large holders – bullish backdrop intact.
⊢
▦ 🜍 Estimated Leverage Ratio – (Current: 0.259):
∴ Leverage steadily increasing, now entering historical danger zone;
∴ Elevated risk of cascade liquidations on any sharp downside move;
∴ Suggests the current rally is not organically fueled by spot demand.
✴️ Conclusion: Price structure is leveraged, not grounded – risk of synthetic instability.
⊢
▦ 🝗 Exchange Reserves - (Binance) – (≈544.5K BTC):
∴ Continuous net outflows – multi-month drain confirmed;
∴ Reflects silent accumulation or self-custody migration;
∴ No exchange-driven supply pressure visible.
✴️ Conclusion: Structural supply depleting – passive bullish signal.
⊢
▦ ⚒ Miners’ Position Index - (MPI) – (-1.1):
∴ Readings below 0 indicate minimal miner distribution;
∴ Suggests miners are confident, or at least not forced to sell at current levels;
∴ Historically coincides with market support zones.
✴️ Conclusion: Miner behavior aligned with trend preservation – not resistance.
⊢
▦ 🜚 Funding Rate - (All Exchanges) – (+0.003):
∴ Rates mildly positive, indicating slight dominance of long positioning;
∴ No excessive funding imbalance – healthy sentiment baseline;
∴ Reflects controlled bullish bias with no speculative overheating.
✴️ Conclusion: Longs exist, but not in a way that endangers trend integrity.
⊢
🜎 Strategic Insight – On-Chain Oracle:
∴ On-chain metrics echo the technical chart: structurally sound, short-term vulnerable;
∴ Long-term holders remain disengaged from distribution behavior;
∴ The system is healthy, but carries hidden leverage that may trigger volatility.
⊢
⧉ III. Contextvs Macro–Geopoliticvs – Interflux Economicus:
▦ 🇺🇸 United States – Federal Axis & Risk Channels:
∴ Treasury Yield Curve remains slightly positive (+0.44%), removing short-term recession signal;
∴ 10Y yield elevated at 4.42% – reflects sustained inflation resistance and risk demand;
∴ Fed has signaled no rate cuts before September – QT policy remains;
∴ Speculative expectations for only 1–2 cuts in 2025;
∴ Trump administration signals potential military action in Iran, igniting geopolitical risk premium.
✴️ Conclusion: U.S. monetary regime is steady–tight; geopolitical volatility injects asymmetric risk into crypto valuations.
⊢
▦ 🇨🇳 China – Internal Stimulus & Soft Deflation:
∴ Industrial Production slows to +5.8% YoY – weakest in 6 months;
∴ Retail sales climb to +6.4% YoY due to stimulus programs ("618 event", consumption vouchers);
∴ PPI remains deflationary (-3.3% YoY), compressing industrial margins;
∴ Fiscal revenue down -0.3% YTD – signals internal fragility despite easing efforts.
✴️ Conclusion: China is applying targeted stimulus, but lacks decisive global impact – neutral crypto flow effect.
⊢
▦ 🇪🇺 European Union – Disinflation & Rate Reversal:
∴ HICP inflation falls to 1.9% – below ECB’s 2.0% target;
∴ ECB cuts deposit rate by 25bps – now 2.00%;
∴ PMI Composite remains below 50 – economic contraction underway;
∴ ECB forward guidance signals data-dependence and hesitation for further cuts.
✴️ Conclusion: Europe is easing rates amidst stagnation – weak driver for global risk flows.
⊢
🜎 Strategic Insight – Interflux Macro Oracle:
∴ U.S. tight policy + Iran tension = dual pressure point on risk assets;
∴ China’s mild stimulus is not yet globally inflationary – no volatility trigger;
∴ EU drifts silently – supportive, but irrelevant to Bitcoin in current configuration;
∴ Global system is stable in appearance, but tactically charged beneath – setup aligns with Bitcoin volatility potential.
⊢
IV. ♝ Market Sentiment - Media & Institutional Lens:
▦ The Block – Corporate Stockpiling Thesis:
∴ Ongoing accumulation of Bitcoin by public and private entities continues across Q2;
∴ Institutional wallets showing strategic DCA behavior – interpreted as positioning for either macro easing or geopolitical hedge;
∴ Unlike past cycles, no major corporate selloffs have been detected.
✴️ Conclusion: Institutional base remains in passive accumulation – potential catalyst insulation.
⊢
▦ CoinDesk – Sentiment Report – BTC at $92K Risk Threshold:
∴ Despite price climbing above $106K, analysts caution of technical rejection scenarios;
∴ Zones near $92K identified as high-liquidity, high-reaction clusters;
∴ Chart analysis frames current movement as vulnerable if macro catalysts turn hawkish.
✴️ Conclusion: Sentiment remains cautiously bullish but alert to correction windows.
⊢
▦ InfoMoney – U.S. Military Risk – Iran Strike Potential:
∴ Reported internal briefing of U.S. military planning toward Iranian targets;
∴ Trump’s media team leveraging geopolitical strength posture to influence sentiment;
∴ Markets (Dow Futures) showing pre-market decline on the headline.
✴️ Conclusion: Bitcoin holds narrative premium under geopolitical fear – but risk surge remains volatile.
⊢
🜎 Strategic Insight – Media Oracle:
∴ The crypto narrative is suspended between structural trust (institutional accumulation) and external fear (macro-political instability);
∴ Bitcoin presently benefits from asymmetric narrative positioning — but lacks transactional confirmation;
∴ Media flows suggest that sentiment will pivot swiftly if Powell’s tone confirms further hawkish stance or if Iran tension escalates.
⊢
⊢
⚜️ Magister Arcanvm (𝟙⟠) – Vox Primordialis!
⚖️ Wisdom begins in silence. Precision unfolds in strategy.
⊢
⌘ Codicillus Silentii – Strategic Note:
∴ The 1D reclaim of EMA21 inside the Ichimoku flat cloud reflects a market in suspended potential, where trend continuation and failure share equal weight;
∴ On-chain dynamics remain structurally undisturbed, yet veiled in a fragile layer of leveraged positioning;
∴ Exchange reserves continue their descent, detaching the market from traditional sell-side threat, but increasing reliance on thin liquidity zones;
∴ Macro vectors (Fed policy + Middle East tension) hover as dual shadows, capable of igniting volatility without prelude;
∴ Institutional accumulation remains active, but no longer decisive - the market awaits external ignition, not internal strength;
∴ Sentiment is asymmetrically bullish, yet explicitly unconfirmed in transactional volume and price aggression;
∴ The system is quiet - not because it is resolved, but because it is observing itself. This is a moment of ritual latency.
⊢
⌘ Market Status – Tactical Mode:
✴️ Strategic Position: “Structurally Bullish – Tactically Suspended”;
✴️ Primary Mode: “Observation Priority”;
✴️ Tactical Stance:
∴ No active positioning expansion without confirmation beyond Ichimoku flat zone;
∴ Watch for MACD confirmation and volume acceleration;
∴ Monitor geopolitical escalation and Powell’s tone – both capable of shifting structural balance.
✴️ Directional Bias: Neutral–Bullish, contingent upon validation;
✴️ Key Zone of Collapse Risk: $92,000;
✴️ Ascent Gate: $110,800 + (confirmation threshold).
⊢

BTC will get doomed to 96k?NO not now, but you can see it ditto follows the movement as said earlier and shown. with little liquidity left on the top of it!

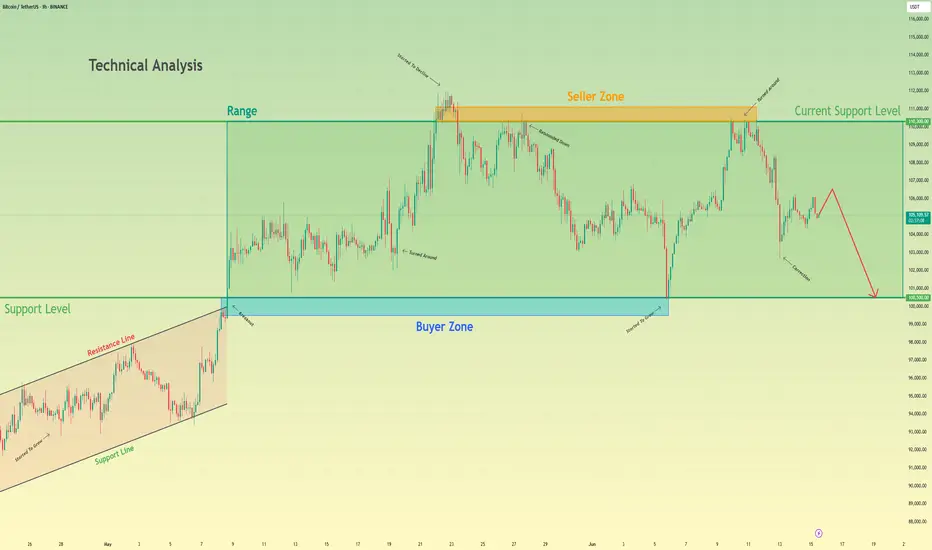
Bitcoin will make a small upward move and then continue to fallHello traders, I want share with you my opinion about Bitcoin. Earlier, the price was confidently growing inside an Upward Wedge, showing a series of higher highs and higher lows. This rising structure was supported by consistent momentum until BTC reached the seller zone between 110300 and 111100, where the growth slowed down and started to fade. From there, the price rejected this resistance and shifted into a Range, bounded by 100500 and 110300. BTC has been fluctuating inside this horizontal structure for some time, unable to break above the seller zone or below the buyer support. Now BTC is showing signs of weakness, forming a minor correction and struggling to reclaim previous highs. Given this structure and rejection from the seller zone, I expect BTC to make a small upward move and then start a decline toward the support level at 100500, which also coincides with the bottom of the range and acts as a strong psychological level. For this reason, I set my TP at 100500 points. Please share this idea with your friends and click Boost 🚀
Bitcoin will continue to fall to support level in channelHello traders, I want share with you my opinion about Bitcoin. This chart shows how the price rebounded from the support line and started to grow. In a short time, it rose to the support level, which coincided with the buyer zone, and it even soon broke this level. Next, the price rose a little and then continued to move up, but later corrected the support line. After this, BTC rebounded and rose to the seller zone, breaking the 108800 resistance level. Then it rose a little more and turned around, and started to decline inside the downward channel. In the channel, price soon broke the 108800 level and continued to fall next. Later, Bitcoin broke the support line and fell almost to the support line of the channel, after which it turned around and made an upward movement. After this movement, Bitcoin dropped to the 100300 support level, after which it turned around and, in a short time, rose to almost the resistance line of the channel. Price didn't reach this line, turned around, and continued to fall in the channel. In my mind, Bitcoin can continue to move down top support level inside the downward channel. That's why my TP is 100300 level. Please share this idea with your friends and click Boost 🚀

Bitcoin may break resistance level and continue to move upHello traders, I want share with you my opinion about Bitcoin. If we look at the chart, we can see how the price entered an upward channel and declined to the support line. Then it started to grow and soon reached the 93500 support level, after which it broke this level and then some time traded near. After this, the price rebounded and continued to move up inside an upward channel, where it later reached a resistance level, which coincided with the seller zone. When BTC reached this level, it broke it too and even rose to the resistance line of the channel, but soon it turned around and dropped to the seller zone. In this area, the price long time traded and later tried to grow, but failed and continued to decline. Soon, BTC broke the 106500 level and fell below the resistance level. But recently, price turned around and grew to this level again, and now trades very close. In my opinion, Bitcoin can decline a little and then break the resistance level one more time. After this movement, I expect that the price will continue to move up inside the upward channel, so I set my TP at 112000 points. Please share this idea with your friends and click Boost 🚀

Bitcoin may break support level and continue to fall in channelHello traders, I want share with you my opinion about Bitcoin. Previously, price was moving inside a horizontal range, consolidating between resistance and the buyer zone near 103500 - 102900. The market lacked clear direction, and price repeatedly rebounded within this structure, failing to build strong momentum either way. Eventually, BTC exited the range and began forming a downward channel. This shift introduced a clear bearish bias, with each high being lower than the previous one. Price action started respecting the descending resistance and support lines, confirming the structure. Sellers consistently stepped in from the seller zone near 109000 - 109500, pushing the price downward with each retest. Currently, BTC is hovering around the support level at 103500 points, showing short-term weakness. The latest reaction from this area didn’t generate significant bullish follow-through. In my view, BTC is likely to break through this support and continue falling inside the channel. That’s why I’ve placed my TP at 100600 points, which matches the support line of the channel and offers a logical downside target. Please share this idea with your friends and click Boost 🚀

XAUUSD BULLISH OR BEARISH ------ DETAILED ANALYSISXAUUSD is currently forming a classic bullish flag pattern on the 12-hour timeframe after a strong impulsive rally from the 3145 demand zone. The consolidation is tight and orderly, holding above the key structure zone and forming lower highs and lower lows within the flag. This setup indicates a continuation pattern, and with price stabilizing around 3315, a breakout to the upside is increasingly likely. A clean breakout from the flag will likely ignite the next bullish wave toward the 3500 level.
From a fundamental perspective, gold remains supported amid renewed market concerns around inflation persistence and global macro uncertainty. The latest US economic data, including slower job growth and declining consumer sentiment, is increasing speculation that the Federal Reserve might be nearing the end of its tightening cycle. This is weakening the US dollar and boosting safe-haven demand for gold. Additionally, central banks, particularly from China and emerging markets, continue to increase gold reserves—adding to long-term bullish sentiment.
Technically, XAUUSD has already respected a strong demand zone around 3145 multiple times, which reinforces that institutional buyers are defending this area. The market structure remains bullish, and higher lows continue to form, aligning with a potential trend continuation. If price breaks above the flag resistance around 3325–3330 with volume confirmation, the bullish target of 3500 could be reached swiftly.
As long as gold holds above the 3270–3280 support zone, the risk-reward setup remains favorable for long positions. With a confluence of strong fundamentals and a high-probability technical pattern, XAUUSD is setting up for a potential breakout rally. Traders should watch closely for breakout confirmation to ride the momentum toward new highs in this evolving bullish trend.

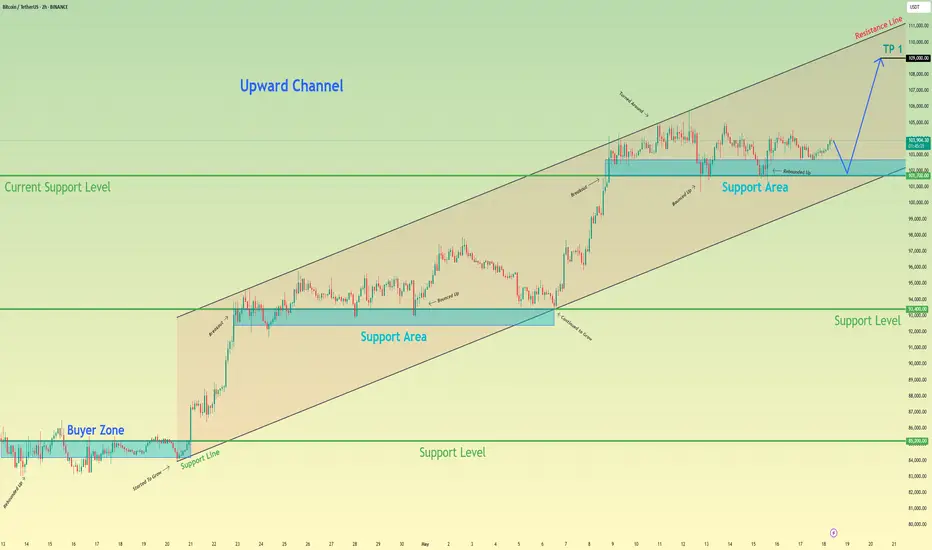
Bitcoin will fall to support line of channel and then rebound upHello traders, I want share with you my opinion about Bitcoin. Bitcoin spent a considerable period trading within a horizontal range, bounded by the buyer zone around 92000 - 93000 points and the upper boundary just below 103000 points. Throughout this phase, the price respected both limits, bouncing between support and resistance, forming a stable consolidation base. Eventually, BTC broke out of this range with a strong bullish impulse, entering a clearly defined upward channel. Since then, price action has been guided by the structure of this rising channel, consistently forming higher highs and lows. Multiple clean retests of the support line confirm the integrity of the trend, and recent movement shows BTC pulling back from mid-channel after a short-term correction. Now the price is approaching the support area between 102000 - 103000, which aligns with the channel’s lower boundary. Given the pattern’s consistency and strength in previous rebounds, I think BTC can correct to the support line and continue to grow. For this case, I set my TP at 113000 points, near the resistance of the upward channel. Please share this idea with your friends and click Boost 🚀

NZDCAD BULLISH OR BEARISH DETAILED ANALYSIS ??NZDCAD is currently coiling within a textbook bullish flag formation after an aggressive impulsive leg to the upside. Price action remains tight inside this consolidation structure, respecting both trendline resistance and support. As we approach the apex of this flag, I’m closely watching for a breakout confirmation to trigger the next bullish continuation leg toward the 0.8600 target.
From a macro perspective, the New Zealand dollar is gaining strength following the RBNZ’s firm stance on keeping rates elevated due to persistent inflation risks, particularly in housing and services. On the flip side, the Canadian dollar is showing relative weakness as oil prices stall and the Bank of Canada shifts toward a more dovish tone amid weaker economic data and slowing consumer spending. This divergence in central bank policy and economic outlook is building a strong fundamental case for NZDCAD upside.
Technically, the structure remains clean. The market formed a strong bullish engulfing rally earlier in April, and since then has entered a symmetrical correction with higher lows forming under compression. This is a classic continuation setup with strong momentum buildup underneath. A breakout above the 0.8280–0.8300 zone with volume would likely trigger institutional interest and drive price rapidly toward the 0.8600 level, which aligns with the measured move of the flag.
This is a high-probability trade idea supported by both technical and fundamental convergence. With risk well-defined below 0.8135 and momentum favoring the bulls, NZDCAD is one of my top setups going into June. Breakout traders and swing traders alike should keep this pair on the radar as the next bullish expansion looks imminent.

Bitcoin can continue to grow inside upward channelHello traders, I want share with you my opinion about Bitcoin. If we looks at this chart we can see how the price, after a healthy correction, the price started rising steadily within an upward channel. Along the way, price broke through the first key level and, after some consolidation, managed to overcome the second one as well. Currently, the price is trading just below the resistance line of the ascending channel. This structure shows that buyers remain in control, and bullish momentum is holding strong despite occasional pullbacks. The overall trend remains upward, and the asset respects the lower boundary of the channel as dynamic support. At the moment, I expect a minor downward move as a short-term correction. This would allow BTC to retest the local support area, strengthening the base before the next leg up. After that, I anticipate further growth, and a breakout toward the upper boundary of the channel is likely. That’s why my TP 1 is set at 115800 points - a potential new ATH aligned with the resistance line of the current structure. Please share this idea with your friends and click Boost 🚀

Bitcoin may break support level and fall to support lineHello traders, I want share with you my opinion about Bitcoin. In this chart, we can see how the price a few moments ago declined, but then turned around and started to grow inside an upward wedge. Price at once rebounded from the support line of the wedge and made an upward impulse to the support level, which coincided with the buyer zone, after which it broke it and made a retest. Then BTC rose to the resistance line, after which it corrected to the 100900 support level and then started to slowly grow in the wedge. Some time later, Bitcoin rose to the current support level, which coincided with the support area and even climbed a little higher to the resistance line of the wedge, but soon dropped to the support line. Next, price turned around and made an upward impulse from this line, breaking the 105800 level, and at once made a retest. After this movement, BTC continued to grow and reached the resistance line of the wedge, but recently it rolled down, so now I expect that the price can rise a little. After this movement, in my opinion, BTC can drop to the support line of the wedge, breaking the current support level. Therefore, I set my TP at this line - 104200 points. Please share this idea with your friends and click Boost 🚀

Bitcoin can continue grow in channel, after small correctionHello traders, I want share with you my opinion about Bitcoin. In this chart, we can see how the price remains inside a clear upward channel, respecting both support and resistance boundaries. After breaking above the 93400 - 92400 support area, the price continued to grow and formed a new support zone between 101700 - 102700 points. This area has been tested several times, showing strong buyer interest and keeping the bullish structure intact. Right now, BTC is hovering just above this support area. A minor correction down to this zone would be healthy and could provide fuel for the next upward leg. The market structure shows higher highs and higher lows, typical of a stable channel-driven trend. As long as the price stays above 101700 points, I expect it to move toward the upper channel boundary. That’s why my current target is set at 109000 points, which is the next key resistance and the top of the channel. This move would align with the current trend and follow the previous impulse-retracement pattern we’ve seen throughout this structure. Please share this idea with your friends and click Boost 🚀

BTC/USDT Short Side TradeEntry 102650
SL 102800
Target 101700
There is a strong selling pressure and also its a fibo zone

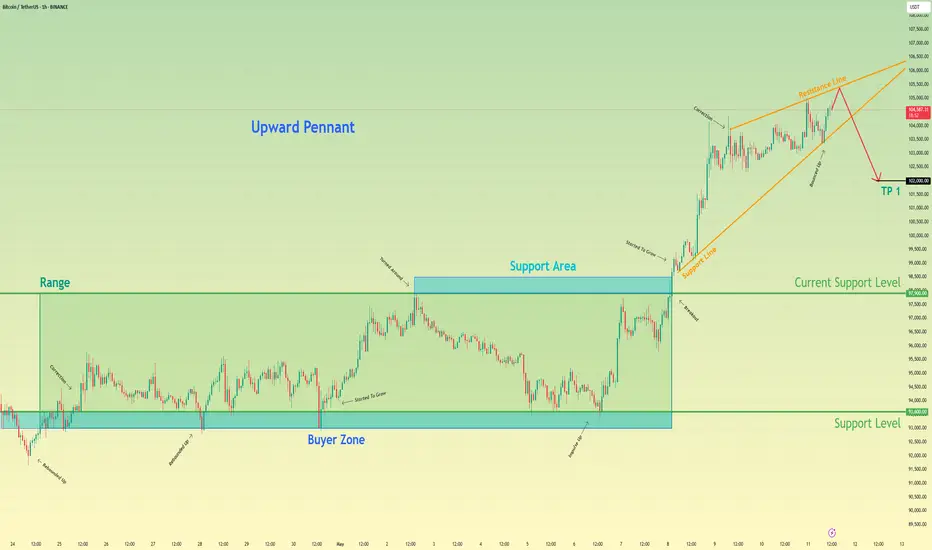
Bitcoin may drop to 102K points, exiting from pennantHello traders, I want share with you my opinion about Bitcoin. After breaking out of a multi-day range and launching a strong impulse from the buyer zone, the price has formed a clear upward pennant pattern. This technical formation often signals a potential slowdown in the bullish momentum, especially when it follows an aggressive move to the upside. The current price action shows that BTC has approached the resistance line of the pennant, but failed to generate further breakout strength. Each new impulse within the structure has weakened, and the market is starting to compress inside narrowing boundaries. The support area has been holding the structure temporarily, but the inability to push through the top of the pennant suggests growing exhaustion among buyers. This setup indicates that BTC may soon break downward from the pennant. So, I expect that it will make a correction that could drive the price down to the 102000 points, thereby exiting from pennant pattern. Please share this idea with your friends and click Boost 🚀
$BTC at the start of the next parabolic run!Bitcoin's parabolic run in 2017 continued on MA11 and with the breaking of the middle band of the mass index indicator, the second parabolic run continued and now we are at the same stage.

Bitcoin may rebound from seller zone and start to declineHello traders, I want share with you my opinion about Bitcoin. In the past, the price had been consolidating within a broad range, repeatedly rejecting support and resistance zones. The buyer zone between 79100 - 80300 provided a strong base, and from there, BTC began to grow, forming a bullish structure that led into an upward wedge. This growth accelerated once the price broke through the support area and continued upward until it approached the resistance level at 95500, which also overlaps with the seller zone. As the price moved inside the wedge, the bullish impulses weakened. Buyers lost strength near the resistance line of the wedge, and recent price action suggests that sellers are stepping in at the top. We’ve now seen multiple failed attempts to break higher, and the price is consolidating under resistance, forming pressure to the downside. This entire consolidation near the wedge resistance, especially inside a confirmed seller zone, indicates a likely reversal. The current structure shows signs of exhaustion, and if the support line of the wedge breaks, that would trigger a significant correction. Given this context, I expect BTC can make a bearish move toward TP1 at 91500 points. Please share this idea with your friends and click Boost 🚀

Bitcoin may little correct and then continue to grow in wedgeHello traders, I want share with you my opinion about Bitcoin. Analysing the current chart, the market behaviour becomes much more understandable. Initially, Bitcoin was moving inside a clean upward channel, showing steady growth with rebounds from the support line and multiple corrective phases. After a strong breakout above the buyer zone, the price maintained bullish momentum and reached the current support level at 88500. Later, BTC consolidated within the support area, confirming its role as a springboard for the next impulse move. The price eventually broke higher, leaving the channel behind and forming a new structure, an upward wedge. This wedge is a natural development after a strong uptrend, often suggesting that the price may continue climbing toward the upper boundary before any potential reversals occur. At the moment, BTC is trading between the wedge's support and resistance lines, precisely respecting both structures. Small corrective pull-backs have already been observed, but buyers quickly defended the support area, keeping the bullish structure intact. Given the clear market structure, the strong breakout momentum from the support area, and the continuation pattern in the form of the upward wedge, I expect Bitcoin to continue moving higher toward the 97000 points, which aligns with the resistance line of the wedge. This level also serves as my TP1 for the current bullish move. Please share this idea with your friends and click Boost 🚀

Bitcoin can make small correction and then continue to growHello traders, I want share with you my opinion about Bitcoin. Earlier, the price of price was consolidating for quite some time inside a broad upward wedge. The market found consistent support near the buyer zone, forming a solid foundation for future growth. After several rebounds, the bulls pushed BTC higher, and the pair exited the support area with a clean breakout. The movement above the current 86000 support level was accompanied by a strong bullish impulse, confirming the breakout from the wedge and validating the upward momentum. The price respected the structure of the wedge well, reacting to both the resistance and support lines along the way. After the breakout, Bitcoin reached a new high near 94000, where it turned around slightly, indicating the beginning of a local correction. Now BTC is hovering just above the broken wedge, and I believe a short-term decline, likely before continuing further upward. Given the wedge's structure, the bounce from the buyer zone, and the breakout with confirmation, I remain bullish on Bitcoin. My TP1 remains at 97000 points, which corresponds to the next key resistance above the current price range. Please share this idea with your friends and click Boost 🚀

Bitcoin may exit from pennant and fall to support levelHello traders, I want share with you my opinion about Bitcoin. Over the past weeks, the price traded inside a broad horizontal range, repeatedly testing the boundaries of the seller zone and the buyer zone. After several failed breakouts, the price sharply dropped from the upper range and entered a phase of lower highs, forming a downward pennant structure. Inside this pennant, the market continued consolidating under pressure from the resistance area. Each attempt to break above the resistance line was met with rejection, confirming strong selling interest near the current resistance level at 88500. At the moment, BTC is testing the upper boundary of the pennant again. This area aligns closely with the resistance level and the long-term descending trendline. Given this confluence and historical rejection zones, I expect BTC to face resistance and reverse, initiating a decline back toward the 79000 support level, thereby exiting from the pennant, which is my current TP1. The compressed price structure, repeated rejections, and clean pattern formation support this bearish outlook in the short term. Please share this idea with your friends and click Boost 🚀

People Used To Get Scared - BTC / USDMorning folks,
Read the chart, it contains all information.
I figured since I didn't update my inverted Adam & Even pattern chart much I'd just create a new one, but check it out, its playing marvelously.
Trade thirsty!

Bitcoin can exit from wedge and then drop to support levelHello traders, I want share with you my opinion about Bitcoin. Earlier, the price was moving inside a broad horizontal range, with clear rejections from both support and resistance. The lower boundary of this range was located near the support level at 81200 points, and the market found solid footing there. After a series of bounces, BTC gradually started to grow, breaking out of the lower range and forming a new short-term trend. The growth accelerated after the price exited the buyer zone, leading to the development of an upward wedge. Within this pattern, BTC continued climbing and eventually broke through interim resistance levels, reaching new local highs. The current movement shows clean reactions to the support and resistance lines of the wedge, with the price respecting the structure closely. Now, BTC is approaching the resistance level at 88500, which aligns with the upper boundary of the previous range and borders the seller zone. The combination of this resistance and the narrowing wedge formation increases the probability of a bearish reversal. Given this setup, I expect BTC to reverse soon and continue moving down toward the 81200 support level, which remains my current TP1. Please share this idea with your friends and click Boost 🚀
