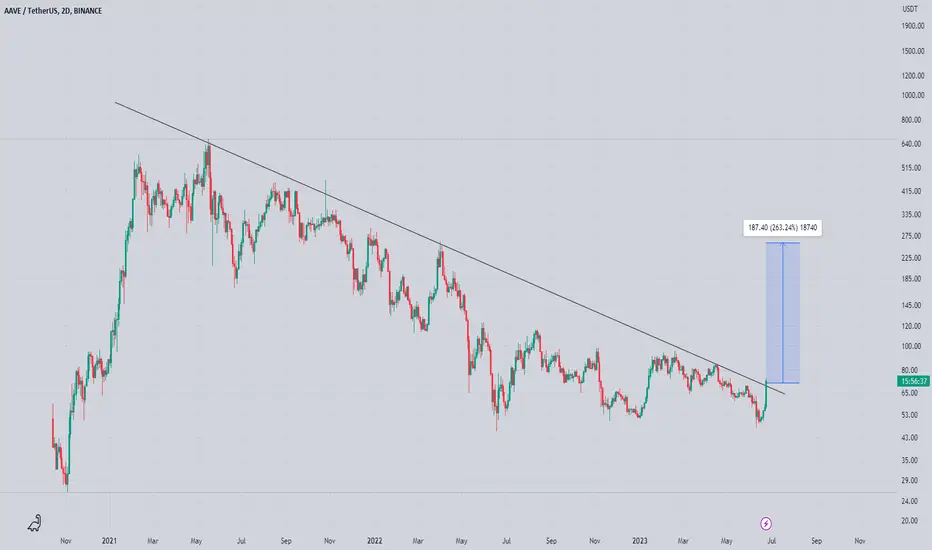
Aave Looks Promising for Midterm Seems Like Getting Ready For Massive Breakout Testing Trend line In 2 Days Timeframe Incase Of Breakout Expecting 240 - 260% Bullish Wave
Keep Eyes On Aave For breakout
Btc-usdt
Finally Ankr showing Signs Of Life Forming 2 Pattern At Same Time Forming descending Channel While Breaking Falling Wedge too Once both Got cleared Bounce will Be epic Incase Of successful breakout expecting 5 to 6x in midterm

🔥 Bitcoin Finally Breaking Out After Months Of Selling?BTC has been trading inside a bearish channel since we topped out at the start of April. Effectively, nothing interesting has happened for 2 months.
As of today, BTC is yet again testing the top resistance of the channel. This signal assumes that we're going to break out of said channel, making it a bull-flag break out. Please be patient for the break out to confirm!
With many alts trading around their 2023 lows, there's a lot of upside to be had in the alts, but for now we're looking at BTC.
Stop below the most recent swing low. Target placed at the 2023 highs.

Finally Doge Showing Some Strength Seems Like Ready For Massive Bullish impulse Descending Channel breakout has Already Confirmed Retesting In Process Incase Of Successful Retest expecting 40 to 45% bullish wave

Bico Looks Good For Solid Recovery Seems Like Getting Ready For Massive Recovery Formed Falling Wedge In Daily Tf Incase Of breakout Expecting 120 to 250% Bullish Wave

BTCUSDT.1DHello dear friends,
*Mars Signals Team wishes you high profits*
This is a one day time frame analysis for BTCUSDT.1D
We are in the daily time frame. As you can see, the price is completing the cup pattern. And we have two scenarios in mind.
First scenario: If the price can stabilize above its first resistance line and break its strong resistance zone, we can say that the price can start an upward rally.
Second scenario: If the price is weak after hitting the resistance line and cannot move above the resistance line, we can experience a price correction because the price has tried and failed to break this area several times. But there is a possibility of breaking this area and it is not far from imagination
Warning: This is just a suggestion and we do not guarantee profits. We advise you to analyze the chart before opening any positions.
Take care

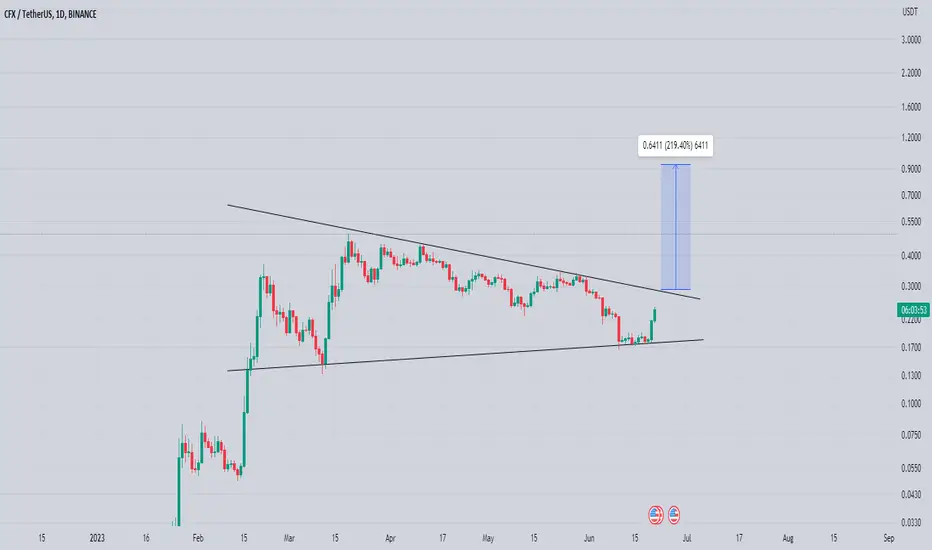
cfx getting ready for another massive bullish rally Seems Like Getting ready for Another Massive bullish Rally
Forming Bullish Pennant In Daily Timeframe Incase Of breakout Expecting Another 180 - 200% Bullish Wave
Op Looks Ready To Test 2.20$Seems Like correction Is Already Over Formed Descending Channel in h4 tf incase Of Breakout expecting move towards 2.20$

BTCUSDT.1DHello dear friends,
*Mars Signals Team wishes you high profits*
This is a one day time frame analysis for BTCUSDT.1D
We are in the daily time frame. As you can see, the price is fluctuating in a downward channel and we can compare it to the flag pattern and currently the price is approaching its first resistance line and we have 2 scenarios in mind.
The first theory: if the price can stabilize above the first resistance line and break the first resistance zone upwards, we expect the price to increase.
Second scenario: But if the price hits the resistance line and cannot stabilize above the resistance line and we observe the weakness in the trend, we can expect a fall to the support areas.
Warning: This is just a suggestion and we do not guarantee profits. We advise you to analyze the chart before opening any positions.
Take care

Btc dump🛑Btc/usdt
An update on the Bitcoin situation, we are still in a negative trend, and it is possible that we will go down to the level of 21 thousand, good luck to everyone

Qnt Looking Bullish Impulse Forming Descending Channel Incase Of breakout Expecting Massive bullish Impulse Incase Of breakout Expecting 45 to 50% bullish Wave

#Btc | #Usdt#Analysis | #BTC | 4H | #NUM_A49
Due to the closeness of support and resistance to each other, we can expect the market to turn...
If the fundamental news does not create market direction.
Price range: 25756~23909

BTC (log scale weekly reference h&s)Good morning fellas,
This is a continuation based on my last post made on the 6M chart.
This shows the weekly and how we're currently being rejected from the neckline.
Stay thirsty.

BTC/USDT#bitcoin struggling to flip the hourlys and facing resistance on the descending wedge.
if flipped and breakout would cause a pump to the white line.
daily 200ema still acting as support

BTCUSDT.1WHello dear friends,
*Mars Signals Team wishes you high profits*
This is a weekly timeframe analysis for BTCUSDT.1W
We are in the weekly time frame. As you can see, the price is recovering in the daily time frame. But currently, we are fluctuating in a downward trend and we can be in a bullish flag pattern. And if the price penetrates and stabilizes below the $25,400 support line, we are considering a drop to lower numbers. And if he can break our resistance line and stabilize above it, we expect to climb to the second resistance line.
Warning: This is just a suggestion and we do not guarantee profits. We advise you to analyze the chart before opening any positions.
Take care

#Btc | #UsdtBitcoin is in a triangle on the 15 minute time frame
The support of this triangle is the price zone of 26262~25826
And as we specified in the chart, it has many resistances
Key support: 25250~23950

BTCUSDT Historical analysis Excuse me!
It is not known what will happen with this current BTC situation. Nobody knows. BUT...
Here is a chart that shows what I mean.
The upper part is BTCUSDT October-November 2019. while the lower one is today, i.e. 2023.
Did you notice the similarity? Historically similar. It is not possible to conclude from these that this is how the exchange rate will develop, but it is possible to draw a conclusion that it will be similar.
Please write your opinion about this. If you like it, I will make similar analyses.
R3ncso

BTCUSDTHello dear friends,
*Mars Signals Team wishes you high profits*
This is a time frame analysis for BTC USDT.4H
We are in the time frame of 4 hours. At the moment, the set price starts to move a little above our resistance line and we expect to advance towards our first resistance line. We have made a safe buy point for you, dear friends. We can hope that the price will start moving after touching the support zone of our guide pattern.
Warning: This is just a suggestion and we do not guarantee profits. We advise you to analyze the chart before opening any positions.
Take care

30/05/23 Weekly outlookLast weeks high: $28225.6
Last weeks low: $27040.8
Midpoint: $25856.0
A little late due to bank holiday. BTC did go on a weekend rally to close strong near 28K. We've seen this happen before and usually the following week most of the gains get roundtripped back down, in this case targeting around 26K.
Tomorrow is the end of the month, currently we have our first red month in 2023. Could this be a correction from from a rally since the start of this year around the 16K mark, BTC's value has doubled since then so a correction makes sense even though we have been chopping for what seems like a long time.

LTCUSD → Breakthrough of two-year resistanceLTCUSDT forms a resistance breakout after a small false breakout. The coin does not fall much after FB, forms a retest and breaks the line.
Bulls are trying to take control of the situation and so far everything is working out successfully.
A strong support line of 91.23 is being formed. If the bulls can hold this area, then Litecoin will show us an excellent growth towards the resistance of the ascending channel.
The fundamental component for LTC is quite good, the network is constantly being updated and activity has been increasing in this network lately.
A global triangle is forming on the chart, the price tends to test the resistance of the set-up. A slight pullback is possible, but in the medium term I expect a breakthrough of the upper limit.
Moving averages act as support.
Strong support: 91.23, previously broken resistance line and 83.66
Strong resistance: 95.00, 102.53
I expect the growth to continue after the resistance is broken. LTC in the market feels a certain confidence that can allow the price to get stronger.
Sincerely, R. Linda!

#Btc | #UsdtHey everyone
In the previous analysis, we identified several resistances and supports
All of which went according to our analysis
Bitcoin has not yet been able to break down the key area that we have identified
And now the price is in a triangle, the triangle breaking in any direction can be the direction of the market
So you have to wait until the triangle breaks and the market takes direction

Tru Getting Ready for 70 to 75% bullish Wave Seems like getting Ready for 70 to 75% bullish Impulse Forming falling Wedge In h8 Timeframe Incase Of breakout expecting Another 70 to 75% bullish Wave

Ray On Way To Hit 1$Descending Channel breakout & Retest Has already done Now Forming Bullish Pennant Incase Of breakout Expecting Move towards 1$
