#Btc | #UsdtBitcoin has downward momentum in the time frame of 15 minutes
It is also in a downward trend
And also in higher time frames it is inside a rectangle
The yellow areas marked in the chart indicate resistance and support
Btc-usdt

Xrp Building Up For Massive Breakout seems :Like xrp getting ready for Massive breakout
Formed symmetrical Triangle In 3days Timeframe Also Testing Crucial Horizontal Resistance Once Got cleared Bounce wil Be Massive
Incase Of breakout expecting Move towards 2.20$

Iost Looking Extremely Bulish Seems Like iost has Already bottomed out and getting ready for massive Recovery
forming descending Channel In htfs While testing horizontal Resistance
Macs cross Over about to happen Another confirmation Of Iost Strength
Incase Of resistance And trendline breakout Expecting 300%+ Bullish Wave

Chz Getting ready For Massive bounce
Over All Moving in Symmetrical Triangle & Breaking Counter Trend line Incase Of Successful Expecting Move Towards 0.185 Major Tl And If Major Tl Got Cleared 2 Then Can Test 0.50 Area With In No Time

OGV is taking off again according to pervious pump it did 2x it will retrace that aarea again in short time

Icx Coin Analysis Seems Like Icx Has already bottomed Out
Formed descending channel & Building Up for Massive Breakout Incase Of successful breakout expecting 280 to 300% bullish Move

dgb Getting ready For Massive Recovery seems Like Has already bottomed out & preparing for massive recovery
forming descending channel in 3days timeframe incase of breakout expecting 300%+ Bullish Move

Iotx Looks Promising For breakout Seems Like Getting ready for Massive Breakout
formed descending channel Incase Of breakout expecting 150 to 160% bullish move Keep eyes On Iotx For breakout

Volume chart BTC 05/11/2020-01/11/2022This chart show the wake top BTC made late 2021 and early Summer (69k$-64.8k$).
I have the belief that BTC top on Friday the 08/01/2021 at a round price of 41950$.
This in is line with GBTC start the continued selling of there BTC supply.
The time in between 08/01/2021 and the most recent bottom of 17622$ on the 18/06/2022.
Has bin an inverted bear market. This because of the famous market patterns BTC/USDT formed in this period.
Being a Wyckoff Market Cycle.
Forming a quad top from 02/2021-06/2021 and a double top in 11/2021 above the 41950$ markt top.
Following a cycle of downside from 26/11/2021 to the end for the trend 18/06/2022.
Leave a comment down below with thoughts if you have questions about this Wyckoff market Cycle.
After the worldwide panic that was this downside cycle BTC top again at 25211$.
Just above what is now a volume RES zone range of 45% of all volume that happened since the 05/11/2021 14093$
The zone 45% range low is 18393$ and mid range is 19.2k$.
Any price action below the mid range or range low should be a instant BUY for the next 3-5 year.
Targeting 100k$+ / 332k$ (--->1m$+)
If this LVL is broken again for a longer time I see the 15k$-14k$ range come in to play
And because of recent high relative volume coming mainly from the US zone and EURO zone.
Can result in mass panic!!! And a likely V shape bounce.
Think 03/2020 or 11/2018-05/2019.
PLS NOTE:
At last this is post is the result of a 4 HOUR NIGHT of thinking AND IS NOT ADVICE.
ONLY TO BE USED as new way of thinking about BTC and current life.
With 1,75 year experience 05/2021 to my name as of writing this.

Xem Forming Descending Channel Seems Like Getting ready For Massive Breakout
Formed Descending channel Incase Of breakout Expecting 200 to 220% bullish move Keep Eyes On for Massive breakout

#Btc | #Usdt#Btc | #Analyse | 15M | #NUM_A18
Bitcoin is currently in a triangle on the 15-minute time frame
The momentum in this time frame is up and the trend is still up
If the triangle breaks, it goes up or down, the same direction as the triangle break entered the position

BTCUSDT → Strong consolidation. What is BTC preparing for?Bitcoin has been in a strong consolidation for two weeks, which is starting to form a pre-breakdown formation. The next retest of the 28650 level will be able to implement the buyers' plan. What is going on and what to expect from the price?
The flagship is in the stage of realization of the fifth wave. It is worth paying attention to the consolidation.
1. strong consolidation near the resistance level
2. no pullback after the false breakdown of the level 28654
3. many repeated tests of the resistance level
4. the local trend is ascending.
Proceeding from these nuances, we can conclude that the price is about to exit the upside range, break through the resistance level 28654 and go up to 30000, and then to the fibo level 1.618 at 31290 (preliminary target for the 5th wave).
There were no strong fundamentals this week, but there are a number of nuances worth paying attention to:
1. Vitalik Buterin: "there will be no more explosive growth of BTC".
2. Santiment: all major bitcoin transactions this year were made in March, and the nature of the transactions indicates "profit taking".
3. Bitcoin miners' earnings rose to a 10-month high
4. WhaleMap expects volatility to rise on the back of $5 billion worth of whale transactions at current levels. (Recall that the price is in consolidation - gaining energy to move further in one direction or the other)
5. Santiment notes bitcoin's strong dominance on social media among the crowd.
Regards, R. Linda!

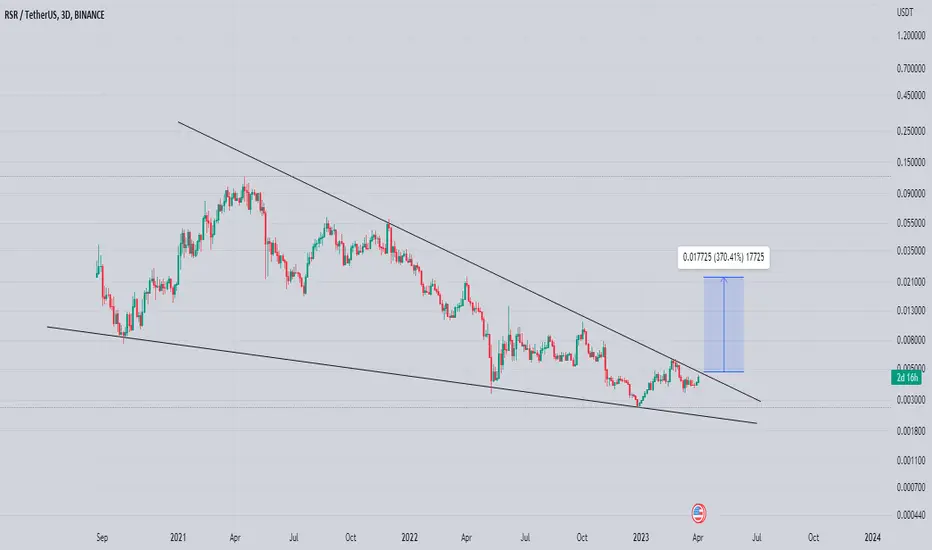
Rsr Getting Ready For Massive Breakout Formed Falling Wedge In 3 day timeframe Incase Of breakout expecting Massive recovery in Coming Weeks
Incase Of breakout expecting 280 to 300% bullish move
Iota Building Up For Breakout Seems Like Already Bottomed Out And Looks Ready For Massive recovery
Formed Falling Wedge In Higher Timeframes Incase Of breakout expecting 220 to 240% Bullish Move

Twt Breaking Falling Wedge Getting Ready For Massive Bounce
Breaking Falling Wedge In h12 Timeframe Once breakout Confirmed Bounced Will Be epic Expecting 50 to 60% bullish Move Incase Of successful Breakout

1inch Looks Promising For Midterm Looking Good For Breakout
Formed Falling Wedge In 2day Timeframe Expecting Massive Breakout Soon Incase Of Breakout Expecting 200 to 220% bullish Move In coming Weeks

Hive Getting ready for Massive Breakout Building Up For Massive Breakout
Formed Descending Channel In 2 days Timeframe & Building Up for Massive Breakout
Incase Of successful Breakout Expecting 140 to 160% Bullish Move


Eth triggerEth ust trigger entry
My dear friends this is my plan for entry in eth position ( but i will wait until btc will close up of 28500)
I will be happy u share ur comments
Thank u

Tfuel On verge Of Massive Breakout Seems Like Has already Bottomed Out
Formed Descending Channel 2Day Timeframe Incase Of Breakout Expecting 240 - 260% Bullish Move
Note Always wait for Confirmed breakout

Jasmycoin Breaking descending Channel Breaking descending channel in h4 timeframe incase Of successful Breakout expecting 40 to 45% Bullish Move

Ren Getting Ready For Massive Breakout Seems Like ren Has already Bottomed Out Formed Descending Channel In 2 days timeframe Incase Of breakout expecting 300 to 350% bullish move

Celo Testing Crucial resistance Testing trendline In daily timeframe Incase Of breakout expecting 150 to 170% bullish move
Keep Eyes On For Breakout
