lina getting ready for Massive Breakout testing Trendline In Htfs Incase Of breakout expecting Massive bullish moves In Midterm
Incase Of breakout expecting 300 to 320% bullish Move
Btc-usdt

BitcoinUSDT(Comprehensive review)Hi friends In this analysis, the following is examined:
1-Ma 100 and Ma 50
2-Rsi
3-Ichimoku
4-Fibo
Check the status of moving averages:
(1D.3D.6D)
1D:The price chart has broken the 200 and 100 moving averages and at the same time it has pulled back to both moving averages.
After the pullback, we have seen an upward trend from the technical point of view, and in connection with the moving average, we are witnessing an upward trend after small corrections.
3D:We see a moving average 100 broken by the price chart We also see a Pullback chart to the place of failure .We also have to note that MA 100 with MA 50 is likely to cut off and cross
6D:The price chart had a collision with the Ma 200 and this collision was associated with the reaction .It should be noted that this is the second price impact with the moving average of 200
And this price chart has a lot of volume and power and there is a possibility of failure of this area.
Also, the moving average 100 is in the range of 33 to 34, which makes it possible to touch these range by the price chart after minor corrections.
Check the status of moving averages:
(4H.8H.12H)
12H:We see an uptrend (CROSS) between moving averages and price charts
Of course, we expect a corrective process to the moving average of 100 (PULLBACK), which is 24500 to 25000.
8H:Here too we see a rising cross between moving and the price chart .Here again we see a bullish cross between the moving gains and the price chart
Moving average of 100 in the price range of 24
And the moving average is 50 in the price range of 25
We expect both of these to create support within the mentioned range.
4H:Here too we see bullish crosses and we have started a corrective trend which confirms the above analysis.
Check the status of ICHIMOKU:
(3D.6D)
6D: The price is inside the red cloud, which shows us the cloud ceiling of the 32000 range and the cloud floor of the 19000 range
Conversion Line can stabilize in the cloud, which can act as support .According to this unwritten rule that the price chart inside the cloud can touch both the ceiling and the floor of the cloud, there is a possibility
that the price will be supported after the blue line and touch the ceiling of the cloud.
3D: The price chart has managed to break the cloud and validate its failure after a pullback
It should also be mentioned that after 450 days, the price was able to stabilize above the three-day cloud.
Base and conversion lines are expected to act as support and prevent the price from falling.
Also, the future cloud has opened in green, which can give strength to continue the upward trend
In this case, the price can move up to the specified area.
Check the status of RSI
(1D.3D.12H.4H)
1D:We see a negative divergence between the price chart and the RSI. If the floor of this divergence is higher than the previous floor, we can expect price growth after the correction. The upper floor should be between 20,500 and 22,800.
3D:RSI is in the range of 70. There is an expectation of RSI correction. According to the EMA, the correction area can be observed between 23000 and 24000
12H:Here we see the divergence of price and RSI
In this case, we will usually see a quick correction process that will also cause the RSI to rest
4H:RSI has completely rested and has reached the range of 30. If the EMA breaks and stabilizes, the price will increase again.
Check the status of FIBO
(12H.1D)
12H:If we draw a fibo between the price of 20 and 29, the zones 23 and 24 are considered reversal zones
3D:If we draw a fibo between the price of 15 and 48, the price is currently trying to break the 0.6 zone.
If this area breaks, it can continue to climb up to the 0.5 and 0.3 areas.
Conclusion
My personal view is to correct the price up to the area of 23500-2400 and if it stabilizes in these areas, we can expect the price to increase up to the area of 33000-34000.
If the price is not stabilized in the mentioned areas, it can be expected to drop up to 19
Note that there is a possibility of a drop to the range of 23000-22000 in order to collect liquidity
Our criterion will be used to measure the validity of the closing price of daily candles.
How to trade
If the price stabilizes in the range of 23,500, you can enter into a purchase transaction and choose targets above 26,000, and the loss limit can also be set below the range of 22,500.
It is also possible to enter into a sale transaction from the range of 28000 to 27000 and define the loss limit above 28,800
Or if the price does not stabilize above 24,000, you can enter into a sale transaction and set the target below 2,000, and the loss limit can also be set in the range of 25,500.
In case of analysis, it is possible to enter into a sale transaction by checking the conditions from 34000 to 33000, which of course requires Ayub's patience and reanalysis.

#Btc | #UsdtBitcoin is inside a triangle on the one-hour time frame
The momentum time frame is bullish
But it is located in the area of the roof of the triangle and caution should be taken
Due to the upward trend, the short position is not logical
But if the triangle is broken down, you can sell


Finally Joe showing Signs Of Life Forming Descending Channel In daily Timeframe Incase Of Breakout Expecting 140 to 150% bullish Move
always wait for confirmed breakout

Chfjpy Analysis Forming Ascending Channel In h4 Timeframe Incase Of breakout Expecting 250 to 280 Pips Bearish Move
always wait for confirmed breakout to enter or open any position

Pivx Breaking Bullish Flag Seems like getting ready for another bullish impulse
Breaking Bullish Flag In h12 Tf Incase Of Succesful breakout Expecting 45 to 50% bullish move

RLinda ! BTCUSD-> The coin went into consolidation. What's next?Bitcoin tests the high of 28868 and forms a correction, thereby presumably defining local resistance to the uptrend. The coin is in consolidation and let's try to figure out what to expect next
Geopolitical uncertainty and the ongoing banking crisis are factors contributing to Bitcoin's growing appeal as an alternative investment. The flagship cryptocurrency is increasingly separated from traditional financial markets, making it an attractive hedge against potential future crises.
In times of global banking panic and financial turmoil, Bitcoin offers a level of security and control as people can keep the asset in their hardware wallets.
The Fed's rate hike and a number of other economic fundamentals have had a bullish effect on the price, as the potential for global factors in the global economy affect BTC more strongly.
Also what is worth paying attention to:
-Historically, there is a positive correlation between changes in M2 money supply growth in the U.S. and the bitcoin exchange rate (most likely the reason for this is inflows into BTC due to the banking crisis)
-CNBC writes that crypto industry insiders remain bullish on BTC
-A new "supercycle" may be starting in BTC. Cryptocurrency now behaves stronger than many commodities and gold - Bloomberg Intelligence chief strategist
-Tether has printed another 1 billion.
In terms of technical analysis we have the following situation:
Bitcoin is most likely in an upward price channel. The price is testing the resistance of the uptrend range(confirms it)
The tested level of 28654 is currently a strong resistance area, which may stop the price growth for some time.
On the local chart, an upward triangle is forming (horizontal resistance 28390 and an upward support line starting in mid-January). Price is in consolidation within this range. A breakout of the support could drop the price to the liquidity zone of 24800-25000. But a breakout of the triangle resistance would send price to the retest of the 30000 and 31460 (liquidity zone)
Moving averages are acting as support
Currently, bitcoin is approaching the Fibo level of 0.236 (26700) - this level may affect the price (bullish), the next one is 0.382 at 25347, it is not considered at the moment)
Short-term outlook - consolidation, or technical rollback to the middle of the range, but medium and long-term outlook looks bullish: 30000, 31460, 35000, 40000
Regards R. Linda!

BITCOIN - A CLEAR BEARISH HEAD AND SHOULDERS Hello friends,
It was already some time since my last published idea, so here is a fresh one!
You can see here that a head shoulder formation has formed on this 3-day chart
The neckline is immediately a crucial point. We have a divergence with the volume and price as you can see. There are also divergences on several other oscillators.
A picture say more that a thousand words, so you see it all in the chart
The price target for now is USD 10,000 for Bitcoin, and the key here is of course patience. The interest rate hikes are far from done and the macroeconomic looks very bad. The war also seems to be escalating, and there are other tensions in the world as well. E.g. China/ US, Israel and Iran.
Food prices continue to rise. Food prices continue to rise violently. In short, we see everywhere malaise.
My idea is that the Euro and the Dollar are being extremely manipulated, but also the markets in general, by central banks. Stock prices are way too high compared to what is happening in the world, and normally there will be a sharp correction on that.
The SP-500 will my idea quite soon go on the downward path again.
Happy trading and good luck!
Disclaimer This is my view, no advice to buy or sell. Also, always do your own research!
--->> Dear friends, please follow me for updates and give me support with a like 👍 if you like me to continue this work. Thanks 💚

🔥 Bitcoin On Fire After FOMC: Bottom Is In!Recently I've been talking a lot about Bitcoin and my expectation it's following some kind of Elliot Wave pattern since January. In my most recent analysis I said that I expected the 4th wave to bottom between $26,5k - $25k. BTC bottomed around $26,6k, close enough!
In my eyes, the bottom is in and we're likely going to continue our way up. Remember that the day after the FOMC meeting is generally the day of the "real" reaction to the meeting, as opposed to the immediate reaction after the new interest rates get announced.
In the short-term, I'm looking at $28,5k and $29k as my targets. In the longer-term, there's an argument to be made that we can reach well over $35k, as per my Elliot Wave analysis above.

Apt Getting Ready For Another Bullish Move Seems Like Apt Will Continue Its Uptrend
Formed Descending Channel In H8 Timeframe Incase Of Breakout expecting 50 to 55% Bullish Move

Algo Looks Promising In Higher Timeframes Seems Like Already Bottomed Out
Forming Descending Channel In 3days Timeframe Incase Of Breakout Expecting 300 to 320% Bullish Move

Mina Coin Analysis Forming Descending Broadening Wedge In 2day Timeframe Incase Of Breakout expecting 250 to 280% bullish Move
Try To Catch Some On Breakout For Midterm

#Btc | #Usdt#Btc | #Analysis | 1H | #NUM_A8 | 📉
Hey everyone, the trigger for the price drop in the one-hour time frame has been hit by the key resistance that we mentioned before, and we expect the price to drop, we have identified the supports in the chart.
🚨Key support : 26810.14
🟢Support 01 : 26379.66~25893.79
🟢🟢Support 02 : 25201.56~25052.53
🟢🟢🟢Support 03 : 24607.38~24371.29
📉We have already posted this analysis :

BTC/USDTLast week for bitcoin ended very bullish. In the wake of the banking crisis, it overcame strong resistance at $25-26k and exited the range, now it is trading at $28k.
We consider the area of $30-32k as short-term targets for 2-4 weeks. Medium-term goals are to test $45k.

Ardr Coin Analysis Seems Like Getting ready For Massive Breakout
Formed falling wedge in 3 day tf incase of breakout expecting 200 to 220% bullish Move

Pyr Getting ready for Massive Breakout Seems Like getting Ready For Massive Breakout
Formed descending channel In 2days Timeframe Incase Of breakout Expecting 200 to 220% bullish Move

Arpa Getting ready for Massive Breakout Can Give some Good returns In Midterm Incase Of breakout
Forming Symmetrical Triangle Incase Of breakout Expecting 350 to 400% Bullish Move

Finally Band Getting Ready For Massive Breakout Seems Like Has Already Bottomed Out
Formed Descending Channel In 3day Timeframe Incase Of breakout Expecting 350 to 400% bullish Move
Always Wait for confirmed Breakout For entry

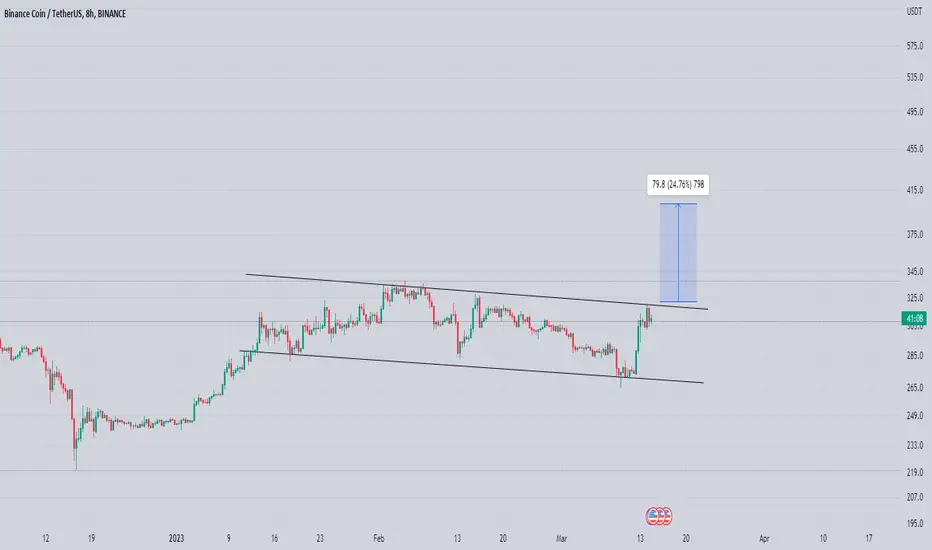
Bnb Building Up For Another Breakout Building Up For Another Breakout
Forming Descending Channel In h8 timeframe Incase Of breakout Expecting 20 to 25% bullish Move
Sandbox Looks Promising for breakout Seems Like Sand will Continue Its bullish Moves
Forming Bullish Flag In H8 Timeframe Incase Of Breakout Expecting Another 45 to 50% bullish Move

Bitcoin massive bear flag formation - TARGET 9k-10kMassive bear flag forming that predicts a target between 9k-10k in the following months.

BTCUSDTBe careful with the trades. We have entered into the trade here after the breaking of the widening corner from the top. This is not an offer for trading. It is very high risk.
