CRYPTO MARKET UPDATE!!!Hi Snipers,
Please refer to the recording for the next price levels and scenarios.
Thanks
MS
Btc-usdt

BTCUSDTHello Crypto Lovers,
Mars Signals team wishes you high profits.
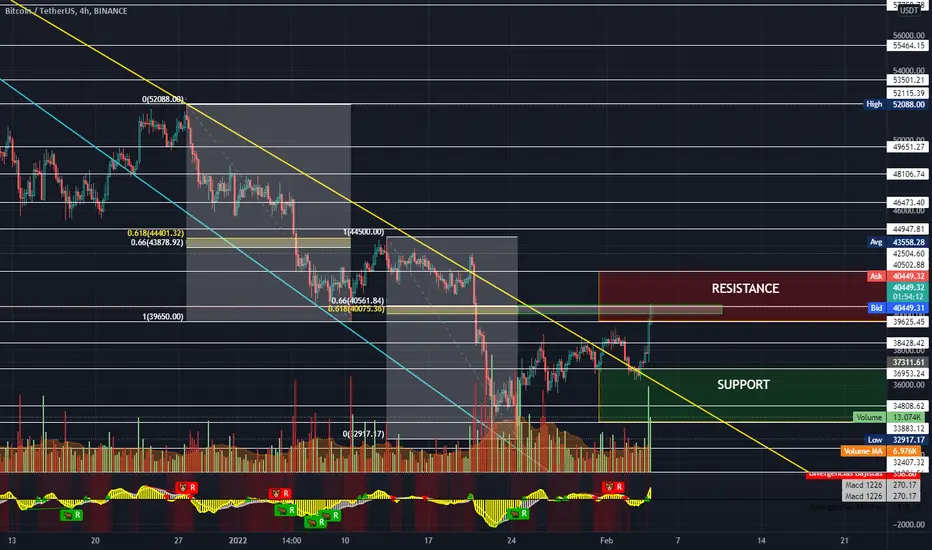
We are in the 4-hour time frame. There is the S1 support which the price is getting close to. Previously it has reacted to this area and if this time it is supported again, it will move up to R1 and then R2. If S1 is lost, after a pullback the price can fall down to its next support S2. The price can also move up from right here but it is more likely for the price to start going up after hitting the S1 line.
Warning: This is just a suggestion and we do not guarantee profits. We advise you analyze the chart before opening any position.
Wish you luck

CRYPTO MARKET UPDATE! Hi Snipers,
Please refer to the recording for the next price levels and scenarios.
Thanks
MS

Icarus who flew too close to the sun…..Bitcoin is behaving like its going to the moon….but i am sorry to say this is just the top of the triangle and we should see $38.5K retracement over 100% down from this most recent breakout. Honestly, we should expect to see BTC go down to $20K this year….just saying. Look at longer time frame picture. Anyways. Enjoy this “bull day” its likely that the stock markets are showing false pumped up gains to intimidate weaker countries and inflation hasn’t even been talked about its just Euphoria Bull Mode at the moment. I’m cautious now. Likely to DUMP HARD.
Icarus flew too close to the sun and his wings were incinerated from his body. Such is the metaphor of our investing environment right now. All we see is gains. But now people are buying in at the top once again and the selloff is coming….if its from $42K or $45K that is the only question for me.

BTC Short term back to supportAs we can see price broke the up trendline and retested it now. I expect a retrace to 39.3k - 37.5k and then go up again.

$BTCUSDT UPDATE!!!!Hi Snipers,
Please refer to the recording for the next price levels and scenarios.
Thanks
MS

I KNOW THIS SOUNDS CRAZY…BUT HOW ABOUT NO TRADE ZONE?Honestly, today has been the ugliest price action ever. Tons of liquidations for both longs and shorts. It’s nearly impossible to set any safe stop loss due to “volatility” AKA the market maker is just making it impossible for anybody to make money. Not bullish, not bearish. I’m in standby mode until the trend is established and always cautious that Bitcoin can change directions +/- thousand dollars or more in one single minute. So don’t get your hopes up that people are buying because NOBODY is buying look at how weak volume was today. Lowest in almost two weeks. Don’t think the market has priced in the actual bad news yet. We are literally inflating our economy to make it look superior to other non-mentionable threatening countries …… welcome to the new stock market 2.0 but worse.
Best of luck traders, let’s all get REKT together, thanks to the market maker. My next target is either $45k then $30k or just straight down to $30k from here. Either way we are going to hit new bottom soon, bullish people are right for long term in next 3 years bitcoin will be back at all time highs but for now put the pipe down and check how much money you actually make from bitcoin…I bet it’s negative we cannot make money without any market direction, it’s always “we might go up, but if we go down here’s whre it’s gonna go FORSURE”……I’m declaring no trade zone until further resolution.

BTC/USDT BinanceBTC/USDT Binance
4H hollow candlesticks.
The end of the market downtrend has occurred, since the price break out of the falling wedge.
The extension of Fibonacci retracement shows the main resistance area at $40.500.
The next Resistance level is at $42.500.
Volume is increasing.
Multiple Support & Resistance areas shown as horizontal lines.
Bitcoin Price (BTC) = $40,505.37 +10.00%
13.71 ETH -2.28%
Market Cap: $1,844,561,061,540
24h Vol: $82,869,202,859
Dominance: BTC: 41.5%
ETH: 19.1%
Good Luck
#Cryptohellas Team
$BTCUSDT UPDATE!!!!Hi Snipers,
Please refer to the recording for the next price levels and scenarios.
Thanks
MS

$BTCUSDT UPDATE!!!Hi Snipers,
Please refer to the recording for the next price levels and recordings.
Thanks
MS

What Did I Tell You…..Market Maker plays Chess not CheckersSee Previous Post…
Despite seeing quite a bit of short liquidations on this upstroke of BTC yet again….just a fakeout. Market Maker plays the same trick on us 3 times in a row! I definitely see BTC not getting higher. Emotional people all are over the internet and YouTube right now saying $50K in the next two weeks…..Hmm….Just look up the term yield curve….You will rethink being a MOONBOY .
Trade Safe, Trade the Trend, Don’t Get REKT.

BTC scenarioI think they will break the short-term trend to leave retailes at high prices. Unless we have good news from the Fed on Wednesday.this is just a scenario and could be wrong.The schematic is approximate

Long the Support - Short the Resistance (Bitcoin)Currently still in my bearish entry trade at $41.5K and holding at 21% Profit….I have very little reason to exit this position unless BTC breaks the current resistance and retests for confirmation. Virtually zero profit loss if trend turns bullish. I only trade dramatic movements and Exit when the trend hits the maximum momentum, then automatically switch trend trade positions.
To anybody not in a position currently: The only trade that makes sense it to go Long……From this point, you have very little to lose and technically we have more range bound movement to come….which means BTC should go up to the $41-$42K before consolidating back down….
On chain data shows the majority of liquidations for BTC have now changed from Longs to Shorts meaning this is NOT the time to go Short….You will be liquidated….70.5% of BTC holders are not looking to sell right now. Keep that in Mind. The whales are buying at $28-$38K and +$50K levels. Everything in between is market maker shaking out retail investors during the final phases of this Accumulation Phase.
My next move is to exit my bearish trade position if BTC uptrends to top of range ($41K) and then WAITING for BTC to reverse, retest $41K and Enter then and only then. Target Take Profits: $20.5K - $30.5K - $32.5K - $37.5K ….. If you haven’t checked out Pionex trading bots it’s worth your time.
In Conclusion, it doesn’t ever hurt to buy Bitcoin. Be proud to own it regardless of price, this is history in the making. Proud to be within the community. Like and Comment Below!

BTCUSDT LongHi, its my next analysis i try my best.
Now i try my skills on BTCUSDT chart in interval 1 Day, first i search for support and resistance origins based on the indicators, white is made for volume analisys, purple for ATR, and orange for PPC. All of this indicators show the same support and resistance price levels with a slowly higher neutral basis, for more the market now switched to bullish sentiment because where the indicators made highs the price made too, if you look back few weeks when indicators made lows the price made small false bullish highs.

btc usdtPossibilities ahead for Bitcoin . Price needs liquidity to reach the 50k level ( In this idea, time is not taken into account )

Elliot Wave Analysis on BTC-USDTHello Traders I have done my best to present accurate and real time illustrations as the story unfolds.
Welcome to Buy Dips and Eat Chips.
Elliot Wave analysis usually works in 3–3-5 meaning ABC-ABC-1-2-3-4-5 movements.
This method is used to accurately predict trend continuation and reversals.
The chart above shows the replicated move for Elliot wave structure. From my perspective the cycle has now reset and we are in wave B of the sequence. About to retest the support for the third and final time before breaking up to downward sloping resistance of our triangle. (White lines)
A mentor once said “when you don’t have to worry about what happens after placing a trade, that is when you know you are doing it right”
*Apply Stop Loss
*Wait for a retest to enter a trade position
*Take Profit is better than No Profits
*Don’t revenge trade / FOMO in middle of trends
*LONG THE SUPPORT - SHORT THE RESISTANCE
*Have your trade parameters defined/written down for both BULL and BEAR situations before entering position
*Sometimes the best trade is NO TRADE - volatility sweeps happen often in zones
*Log your trades and WHY they succeeded or failed. Do this over and over and over.
If you like some of the content please follow and like / comment your ideas !!! Happy Hunting.

BTC 1H double bottom charts never lie ! i think this double bottom will go btc to 40k
don't forget about SL

BEWARE OF MARKET MANIPULATION - BTC HUGE FAKEOUTS EXPECTEDGood Evening Traders,
The NYSE Stock Exchange saw negative moves today majorly bearish…..We have seen the market maker manipulate the long wick candle in this downtrend to liquidate shorts and longs….we have much more to come this weekend because the FUTURES market is closed until Monday. We are seeing liquidity pooling down at $34-$36K which needs to be reclaimed in my opinion. The number one lesson I’ve learned is to not make moves so hastily.
Blue Flag indicates my bearish entry point @ $41,145……Up 26% so far
I have the option to flip my trade or let it ride out….what do you think people?
We are seeing sooo many shorts however that’s exactly what market makers want! The whales and institutions want the retail traders (you and me) to go bearish on Bitcoin meanwhile they are BUYING over the weekend to send this baby to $47K. The only way to win is to play by the market makers rules….if we follow the news and media and fear and greed index there will be herds getting REKT.
Don’t Get REKT. Buy Dips and Eat Chips.


MICRO $BTCUSDT UPDATE!!!Hi Snipers,
Please refer to the recording for the next price levels and scenarios.
Thanks
MS

$BTCUSDT UPDATE!!!!HI Snipers,
Please refer to the recording for the next price levels and scenarios.
Thanks
MS

WYCKOFF THEORY SHOWING CORRELATION - PHASE C - SHAKEOUTI don’t know if this analysis is too early to publish but BTC has been showing larger volume and larger dip below our EMA….We tried to hold $40K but the market makers want to liquidate as many longs as possible just enough to keep you interested. Don’t give in….Don’t Sell….HODL….BUY THE DIP, EAT SOME CHIPS…..My trading bot on Pionex is setup for 30,500 target but will stay attuned frequently. Currently am in 22% profit since entry at $41,150….trading the trend and being patient until serious signs of a reversal show….

Waves ShortWaves have the right Fib. numbers in all 5 elliot waves, and should get a corrective of ABC waves, before second impulse in daily chart.
