Bitcoin - BTC | Weekly Market Recap & Outlook 13.07.2025What Happened Last Week?
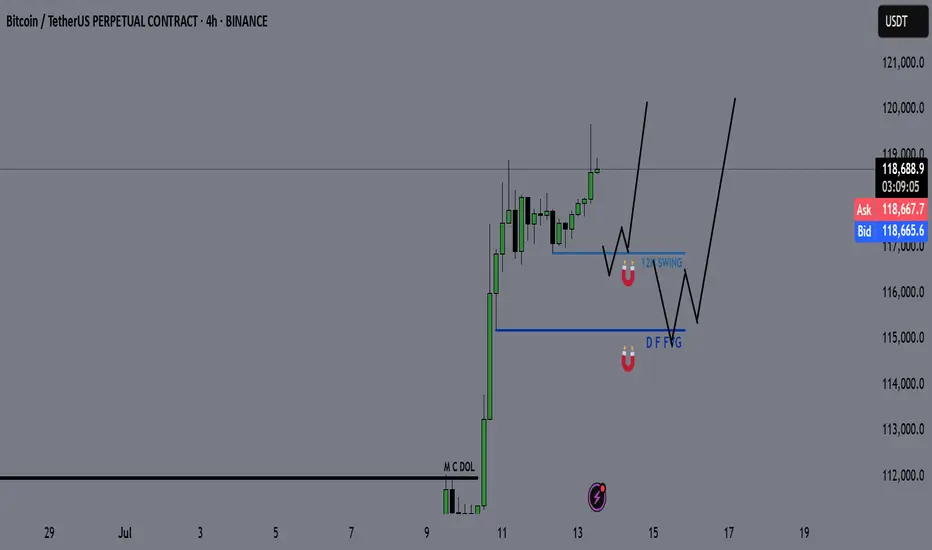
Bitcoin broke out of the recent downtrend structure and established a bullish leg with clear momentum.
The breakout was supported by volume and price structure, suggesting a trend reversal rather than a temporary deviation.
Weekly Bias and Strategy
The current outlook is bullish.
A retracement or sideways consolidation between the $120,000 and $114,000 zone is possible.
This zone may act as accumulation before further upside.
Key Points of Interest (POIs):
12H Swing Liquidity (turquoise line)
Daily FVG (blue line)
These levels will be monitored for long setups with confirmation on lower timeframes.
Macro Consideration – Fed Chairman Jerome Powell
Recent market speculation has increased regarding Jerome Powell potentially stepping down as Chair of the Federal Reserve.
If such a resignation is confirmed, it may act as a significant bullish catalyst for Bitcoin and other risk assets, possibly accelerating upside without allowing for any meaningful pullback.
Summary
• Bullish breakout confirmed
• Long bias maintained unless major invalidation occurs
• Watching retracement levels for entries
• Macro catalyst (Powell resignation) may trigger strong continuation without retrace
Btc1
Bitcoin [BTC1!] Draw and Bias. 05.07.25, SaturdayLooking for bullish action on BTC. No stance on alts.

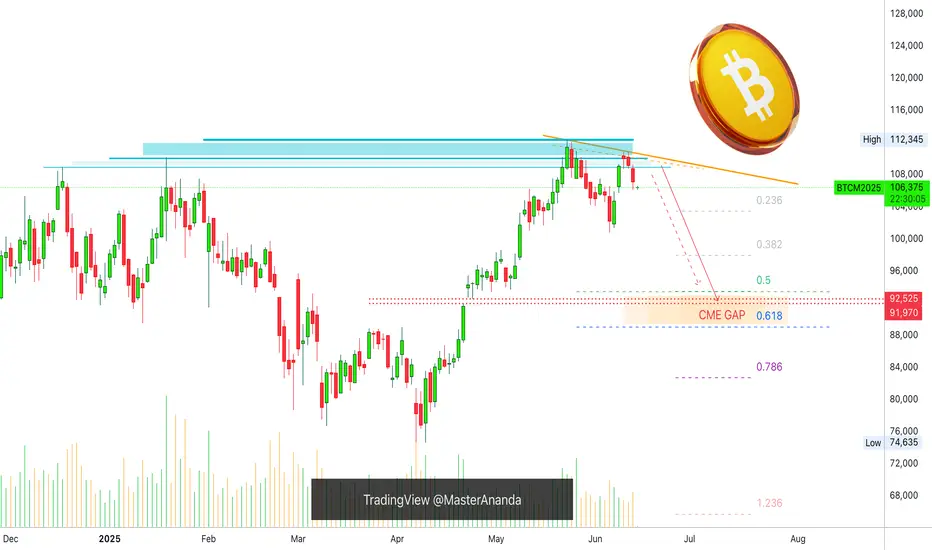
5 Bearish Signals —Bitcoin CME Gap (91,970 - 92,525)Bitcoin's bearish bias is confirmed clearly. Bearish signals are starting to pile up one on top of the other, let's recap those real quick:
1) Bitcoin is trading below its December 2024 high, it's January 2025 peak price and the recent 22-May all-time high. Trading below these levels open the doors for a move downward.
2) Recent lower high. 10-June closed lower compared to 22-May. This is a local lower high.
3) Overall low volume. Total volume decreasing since January 2025. No strong buying activity.
4) Sustained growth. Bitcoin grew straight up for 45 days. It is normal to see a retrace after sustained growth.
5) CME Gap. This is the latest signal that came to my attention and this gives further strength to the bearish case. The GAP sits between $91,970 and $92,525.
It is likely that Bitcoin will move lower before producing a new all-time high. Bitcoin is not likely to move below 80K. This is very unlikely.
Most likely Bitcoin will find support above 90K and if it moves below 90K this might be a brief occurrence lasting only a few hours or a few days at max. When all is set and done, we will continue to see long-term growth based on a bullish structure of higher highs and higher lows. The 7-April bottom will remain untouched.
Namaste.
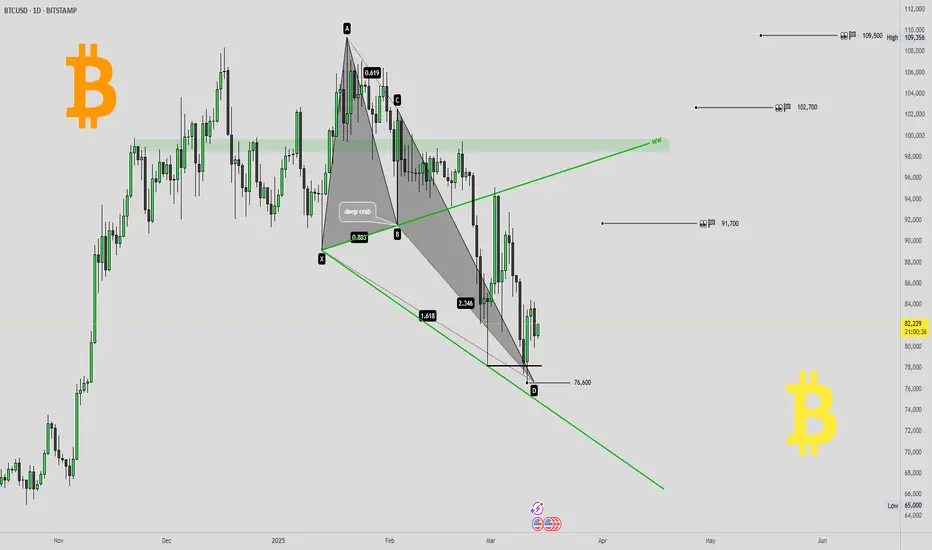
Bitcoin reversal confirmed ?!Bitcoin reversal confirmed ?! 👀
I would like to present you some charts with important levels and relevant patterns.
🖥daily-chart (BITSTAMP) and 💡everything important in the chart 👀
💥Here in the daily chart (BITSTAMP)
- a Deep-Crab harmonic with
- a WolveWave
and the daily-chart of the
🔥Daily MA200 re-test 👀
- gap fill
- support-line 2022 and 2024 TOPs
👉 BITCOIN roadmap/outlook (from 27th february 2024) 💡
🎯 If you like this idea, please leave me a 🚀 and follow for updates 🔥⏰
Furthermore, any criticism is welcome as well as any suggestions etc. - You're also very welcome to share this idea.
Have a nice evening & successful trading decisions 💪
M_a_d_d_e_n ✌
NOTE: The above information represents my idea and is not an investment/trading recommendation! Without any guarantee & exclusion of liability!
CME Futures PREMIUM —Bitcoin Will Continue To GrowThe PREMIUM between Bitcoin's CME Futures and spot price is still on. This means that Bitcoin continues bullish.
In a previous article, I used this signal to predict a bullish breakout and bullish continuation. When there is a bullish bias Bitcoin becomes more expensive on CME vs spot, it means buy demand is very strong. With a strong demand for Bitcoin from the public, prices continue to grow.
There is a huge difference between the double top in 2021 and the chart structure in 2025.
The double top in 2021 came out of a 5-up waves pattern. The current top comes out of a 7 months long consolidation phase. Based on Elliotts law of alternation, the bull market will end in a blow off top in 2025 rather than a double top. This means that we will see one final and very strong move up followed by a crash, and that's how the bull market will end. Think of 2017/2018 and you can get a perfect picture of how the bull market will end. The only question that remains is about how far up prices will go, will the bullish wave end at $157,425 or will it go to $211,855?
Six months is enough to reach the second target.
This is a friendly reminder.
Bitcoin will continue to grow.
Namaste.

a possible massacre.what if i told you that bitcoin could drop 50% before june is over?
i know that probably sounds extreme. maybe even a little unbelievable. and that's okay; most people react that way when faced with a scenario they weren't prepared for.
i’m not here to scare you, and i’m not trying to make a bold claim just to get attention. i’m here to share a message that comes from a rare, proprietary sell signal in our system; something that doesn’t trigger often, but when it does, we pay very close attention.
i believe there’s a real possibility bitcoin drops below 50k by the end of june.
---
here’s the technical stuff to anyone interested:
since the bottom in november 2022, bitcoin moved up in a clear five-wave pattern, peaking around january 2025. from there, it seems to be forming what’s known as an expanded flat correction. this is a three-wave structure (3-3-5) that often tricks the crowd before the next major move begins.
ironically, this potential drop doesn't change the bigger picture at all. i still believe the long-term target sits between 750k and 1m by year-end. but markets don’t move in straight lines; sometimes, they shake out everyone who’s too confident, right before taking off.
consider this a heads-up,
not a certainty,
but one worth preparing for.
---
ps. the stop-loss on my btc long sits at the target of this idea. if i'm right about this, my stop will get hit, and it will open the door to a new entry.
---
🌙

get in loser, we're going to 1M.gm,
before i share my in-depth analysis, i just wanted to share a piece of my mind on how i approach this market:
there are many valid trajectories constantly at play. most people only ever see one; and they get emotionally attached to it. it’s usually the one that validates their own internal bias. they follow people who align with their belief system, and they end up in an echo chamber of regurgitated information, all in the name of pride and ego.
there’s nothing wrong with that, but you won’t find any of that on my page.
when i create a projection, i’m not just drawing it out. i spend a thousand hours tuning into the vibe... i become it. temporarily, i am the trajectory, which allows me to speak from its perspective on a deep, intuitive level. i’m not here to convince you that my idea is playing out. i’m just showing you that it’s one of many valid trajectories in this market.
this one here just happens to be my primary.
it has been for years, and it will remain my primary until we, at the very least, reach 752k.
now, that might sound mind-boggling to a lot of people, especially those still tuned into outdated belief systems or the mainstream media, which is incredibly gloomy right now.
----
what i have before you is a bullish nest that took 3 years to form;
a structure built with precision and patience,
and it's about to rip faces once the third wave explosively and unexpectedly begins.
i’ve color-coded all the waves for your convenience,
and i come to you this morning with a simple heads-up:
a monumental breakout is about to unfold.
and the harsh truth is,
you’re probably not going to be a part of it
because you got shaken out right before it began.
---
🌙
---

1 Billion USD+ SHORTs Liquidation —Bitcoin BullishGood morning my fellow Cryptocurrency trader, I hope you are having a wonderful day.
We all know that life is not a game of checkers, it is more like fifth dimensional chess. It can be easy once we master how to play but it is actually hard to learn the game. The same goes for trading Cryptocurrencies, it is not an easy game.
Billions of dollars are about to be liquidated from SHORT traders. The All-Time High liquidation. This is a friendly reminder.
» If you are bullish, congratulations. You are good and you will do great.
» If you are bearish, there is still time, you don't have to lose knowing beforehand what will happen next.
The whales and market manipulators are setting up a trap right now, but they can never fool you because you know best.
What do you know?
» You know Bitcoin to be bullish because it is easily trading above 100K.
» You know Bitcoin is rising because it has been moving up since the 7-April low.
» You know a continuation will soon follow because we have signals coming from the Altcoins, the Stock market and Gold. Everything is pointing up.
I know you are smart and thank you for coming back and reading again. In only a matter of days, billions of dollars worth of SHORTs will be liquidated. Make sure not to be caught on the wrong side of the fence.
» Bitcoin is going up.
Namaste.

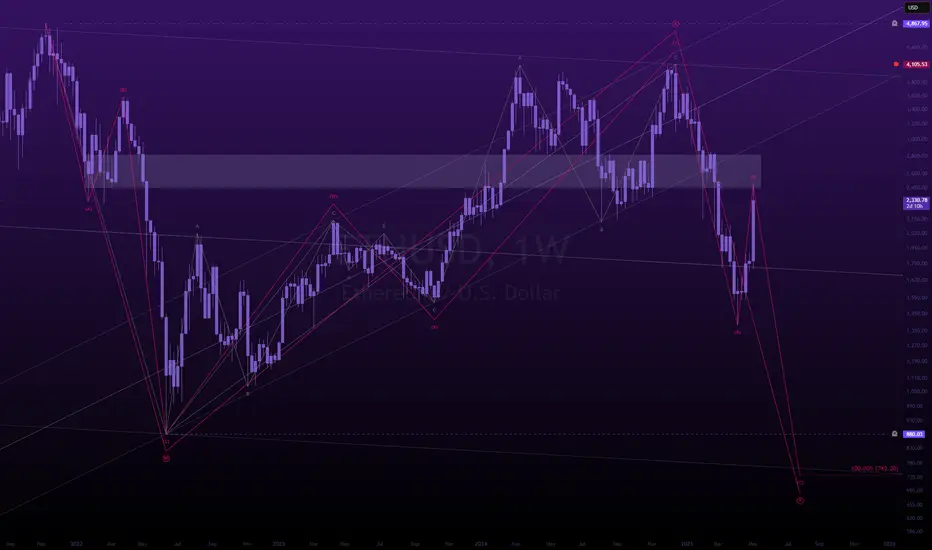
one last dancegm.
you finally woke up and ethereum was soaring.
you saw the bounce. the reclaim. the headlines.
you convinced yourself the bottom was in.
you drew trendlines, watched influencers say “we’re so back.”
you wanted to believe.
and that’s exactly what wave B needed.
because this wasn't a breakout.
it’s a reset.
a psychological rinse,
engineered to bait late longs and build fuel for the final l i q u i d a t i o n.
this is the macro (W)-(X)-(Y).
not hopium, not dreams structure.
wave A brought devastation.
wave B brought complacency
wave C brings the execution.
make no mistake:
we’re not going up,
we’re being set up.
the chart says $742.
you call it impossible.
but the market doesn’t care what you believe.
the market only exists to find the maximum pain,
your maximum pain.
eth to $700 is not a prediction.
it’s a scheduled event.
and you’re RSVP’d unless you wake up.
wave C of wave (Y) is coming.
and it doesn’t care how bullish you feel.
---
Top of ABC correction on Bitcoin ~ ShortBitcoin has had quite the run up since 2023 and is currently in an ABC corrective pattern after a 5 wave impulse. The January high was the starting point. The April low was A. Now is the top of B which happens to be 0.618 retracement of the A wave. What follows is a down move for C which should end somewhere between 63k and 53.5k. This will make a bottom and will stay in accumulation until late 2027 early 2028 before shooting to the upside in anticipation of the next halving.

bitcoin enters a hyper-parabolic state to 753kgm,
this was initially a private post,
but i've decided to open it up to the public, for the people.
---
interest rates are collapsing. not slowly. not in a controlled, measured descent. this is a freefall. the kind that rewrites economic history.
monetary debasement is inevitable. quantitative easing will accelerate, liquidity will flood the system, and the us dollar will plunge. this isn’t speculation. this is math.
and when that happens, the gates open. the largest alt season in history is not a possibility. it is an inevitability. this will be the kind of move that people will talk about for decades. portfolios multiplied beyond reason. valuations pushed to levels most can only dream of.
the everything bubble will expand beyond comprehension. people will call it unsustainable. they will call it madness. but madness is where the greatest opportunities are born.
most won’t be ready. they will hesitate. they will overthink. they will sell too early,
watching in disbelief as the market leaves them behind.
we will not.
🌙
---
tp - 753k

bitcoin dips below 60kbitcoin dips below 60k, but we're unfazed.
i see this playing out as we move into the depths of winter,,,
this crypto winter ❄️
why would this happen, you ask?
the answer is simple: a stop-loss raid.
a sharp wave 4 designed to shake out weak hands.
distribution may have already started, hypothetically speaking, but it'll take the rest of the year to unfold.
think of it like the jan 2021 -> april 2021 vibe, only on a slightly higher degree and timeframe.
---
take note of the highlighted wave 2's and wave 4's on my chart.
what i'm illustrating is "the law of alternation," which states:
if wave 2 is flat, wave 4 will be sharp, and vice versa.
all the wave 2's in this cycle have been flats,
so by design, all of our wave 4's are set to be sharps.
this fits neatly into the larger cycle:
sharp retracements triggered by over-leveraged positions,
yet consistently bought up thanks to strong demand.
with each sharp retracement, however, the upward moves become smaller,
as momentum gradually fades.
---
w4 target: below 60k
w5 target: between 150k-200k (conservatively).
---
ps. i have recently shared a much more bullish idea via:

Fading Risk Sentiment Supports Solana Amid Crypto SlumpLast week, Mint Finance published a comparison of Solana with other blockchain networks, focusing on speed, transaction costs, network size, and valuation. We emphasized Solana’s unique position in the decentralized application (dApp) space—particularly in NFTs and meme coin trading—where it has cultivated a loyal user base by offering low fees and fast transaction speeds.
While Solana’s network growth has been notable, its token performance tells a more nuanced story. The token generally trades with a high correlation to broader crypto markets, though it has experienced periods of divergence that have presented attractive spread opportunities.
Solana sits further out on the risk curve compared to BTC and ETH, exhibiting higher volatility. It tends to outperform in risk-on environments, delivering stronger returns during market rallies. However, during risk-off periods, it typically underperforms as investors favor more established and resilient assets like BTC.
Amid the current turbulence in crypto markets, this paper examines Solana’s relative outlook versus BTC and ETH, and outlines how investors can position accordingly using CME Solana and Micro Solana futures.
Recap of Solana Performance and Volatility
After a strong recovery from its 2022 lows following the FTX collapse, Solana began trading closely in line with BTC throughout 2024. Both were among the top-performing crypto assets last year. However, since January, this trend has reversed, with Solana surrendering most of its year-to-date gains.
Data Source: TradingView
Historical volatility across SOL, ETH, and BTC follows a similar trend but varies in magnitude. SOL consistently exhibits the highest volatility, followed by ETH, with BTC being the least volatile. These differences become more pronounced during volatility spikes, while during calmer periods, their volatility levels tend to converge.
The trend in implied volatility (IV) mirrors that of historical volatility, with SOL showing the highest IV and BTC the lowest. Recently, IV has begun to moderate, driven in part by the tariff rollback.
Relative Performance During Risk-On/Risk-Off Periods
During periods of risk-off sentiment—indicated by spikes in the VIX index—Solana typically underperforms, often experiencing the steepest declines among major crypto assets.
Conversely, during market rallies, Solana tends to outperform, often posting the strongest gains by a significant margin.
Technicals Sentiment
Technical indicators suggest a weakening bearish trend for Solana. Although prices have been declining since January, a rising RSI and MACD are signaling that the downtrend may be approaching a turning point. While the broader macro environment remains challenging, the postponement of U.S. tariffs has offered some short-term relief. Nonetheless, continued macro stress may weigh further on prices. The USD 100 level could serve as a potential support, offering psychological significance for the market.
A review of near-term technical indicators reflects a similar outlook, with multiple signals aligning toward a Buy summary. However, the 1D timeframe still shows a Sell signal, indicating that further downside may be possible before a definitive bottom is established.
In contrast, the near-term outlook for ETH remains bearish, with a Sell signal across most timeframes. Any sentiment improvement has yet to materialize for ETH.
Hypothetical Trade Setup
Solana sits further out on the risk curve compared to assets like ETH and BTC, as reflected in its higher implied and historical volatility, as well as its more extreme price movements. It typically experiences the steepest declines during market corrections but also leads gains during bullish periods.
Since the start of the year, Solana’s price has been in steady decline. However, early technical signals suggest the downtrend may be approaching a turning point, though some near-term weakness could persist.
BTC continues to serve as the crypto market’s safe haven. Despite a 20% correction since January, it has significantly outperformed both SOL and ETH. While Solana has been the weakest performer among the three for most of the downturn, it has recently begun to close the gap with ETH as the correction appears to be nearing its end.
With the performance gap between ETH and SOL narrowing as the correction approaches its end, a tactical long SOL / short ETH position may be attractive. If prices continue to rise or consolidate, SOL is likely to outperform ETH due to its higher beta.
Alternatively, for investors expecting further downside in crypto markets, a long BTC / short SOL position could be compelling. This setup aims to capture relative strength in BTC, which tends to benefit from safe haven flows during periods of market stress.
In order to express these views, investors can deploy CME futures which offer compelling margin offsets for inter-market spreads involving cryptocurrencies which can enhance capital efficiency.
Long Micro SOL, Short Micro ETH
Long 1 x Micro SOL April futures: 117.2 x 25 SOL/contract = notional of USD 2,931
Short 19 x Micro ETH April futures: 1554 x 0.1 ETH/contract x 19 = notional of USD 2,952
This trade requires margin of USD 2,185 as of 11/April (USD 1,255 for 1 x MSL and USD 931 for 19 x MET (49/contract)
CME offers 40% margin offset for this trade as of 11/April reducing margin requirements to USD 1,311
A hypothetical trade setup with a 2x reward to risk ratio is described below:
Long Micro BTC, Short Micro SOL
Long 1 x Micro BTC April futures: 81,250 x 0.1 BTC/contract = notional of USD 8,125
Short 3 x Micro SOL April futures: 117.2 x 25 SOL/contract x 3 = notional of USD 8,793
This trade requires margin of USD 5,678 as of 11/April (USD 1,913 for 1 x MBT and USD 3,765 for 3 x MSL (1,255/contract)
CME offers ~25% margin offset for this trade as of 11/April reducing margin requirements to USD 4,261
A hypothetical trade setup with a reward to risk ratio of 1.6x is described below:
To access the standard size contract spreads, investors can use the ratios of 1 x BTC to 6 x SOL and 2 x ETH to 3 x SOL.
MARKET DATA
CME Real-time Market Data helps identify trading set-ups and express market views better. If you have futures in your trading portfolio, you can check out on CME Group data plans available that suit your trading needs tradingview.com/cme .
DISCLAIMER
This case study is for educational purposes only and does not constitute investment recommendations or advice. Nor are they used to promote any specific products, or services.
Trading or investment ideas cited here are for illustration only, as an integral part of a case study to demonstrate the fundamental concepts in risk management or trading under the market scenarios being discussed. Please read the FULL DISCLAIMER the link to which is provided in our profile description.

Bitcoin At $250,000 In 2025: Bull-Market Entry (Buy) Zone ActiveBitcoin's 2025 bull-market buy-zone is still active. Actually, Bitcoin is at a great price right now. We are aiming for a target of $250,000 for this cycle. We are looking at the bottom right now, literally. Any buy below $90,000 is extremely good and below $80,000 a dream come-true. This will be obvious in just a matter of weeks.
How are you feeling today?
I hope the start of the weekend is treating you good.
This is a friendly reminder, Bitcoin has been sideways for months. When Bitcoin drops, it drops but, currently, there are no new lows.
Bitcoin peaked in December 2024 and produced a double-top in January 2025. A small retrace and that's it; the accumulation phase is ongoing and the buy-zone active.
There are many signals that support a correction bottom being in. We looked at these already so you will have to trust me. Leverage is possible on this setup. Leverage for a long-term trade. This is the best possible scenario and the best type of trade.
No complexities. No calculators. No fees. No interest, just buy and hold.
Wait patiently... It will be a very strong rise and the Altcoins will grow even more than Bitcoin. The entire Cryptocurrency market will produce maximum growth.
This post is intended to alert of you a great entry-timing. Great prices as well but timing right now is great. We might have to wait a bit longer, it won't move right away, but with this price you can't go wrong.
I am wishing you tons of profits in 2025 and financial success.
Thank you for reading.
If you are new, feel free to follow.
Master Ananda for you (formerly Alan Santana).
Namaste.

Appetite For Risk Through the Lens of Nasdaq and BitcoinBitcoin tends to track Wall Street sentiment well, particularly compared to the Nasdaq. Growing concerns that Trump's policies will tip the US (and therefore the global economy) into a recession, which currently has the Nasdaq on the ropes and bitcoin getting dragged along for the ride. And there could be further losses to follow, though a cheeky bounce at a minimum could be due first.
Matt Simpson, Market Analyst and City Index and Forex.com

Bitcoin Goes "Red Days Again" since "Relief Rally" Has Been NullBitcoin's price has experienced significant fluctuations over last "Intl Women's Day" weekend, reflecting the volatile nature of the cryptocurrency market. To understand these movements, it's essential to consider both the broader economic context and specific events that have influenced investor sentiment.
Background: Economic and Political Factors
In recent weeks, Bitcoin's price has been heavily influenced by economic indicators and political announcements. The U.S. Federal Reserve's stance on interest rates, particularly comments from Jerome Powell, has been closely watched by investors.
Political factors have also played a crucial role. For instance, Donald Trump's re-election and his proposals related to cryptocurrency, including the creation of a "Strategic Bitcoin Reserve," have contributed to market optimism and price increases. However, these developments also introduce uncertainty, as regulatory environments and geopolitical tensions can quickly shift investor confidence.
Recent Price Movements
As of the last weekend, Bitcoin's price has shown a decline of nearly 5%. This decrease is part of a larger trend where Bitcoin's price has struggled to maintain consistent gains, often experiencing sharp drops followed by rebounds. For example, on March 9, 2025, Bitcoin's price was noted to be choppy, trading around $81,500.
Bitcoin's price initially dropped but then rebounded slightly. This rebound was likely driven by renewed optimism in the altcoin market and strategic purchases by entities like Metaplanet, which has been actively buying Bitcoin. However, the overall sentiment remains cautious due to ongoing economic uncertainties and the potential for further interest rate hikes.
Key Events Influencing Price
Mt. Gox Bitcoin Movement: The recent transfer of over $1 billion worth of Bitcoin from Mt. Gox to an unmarked address has raised concerns about potential market impact. Such large movements can lead to increased volatility as investors speculate about the intentions behind these transactions.
Regulatory and ETF Developments: The ongoing efforts to establish a U.S. spot Bitcoin ETF have seen mixed results, with periods of significant outflows followed by brief moments of positive inflows. These developments can influence investor confidence and, consequently, Bitcoin's price.
Global Economic Conditions: Trade tensions and economic stimulus measures, particularly those involving China, have also played a role in shaping Bitcoin's price. As investors seek safe-haven assets, Bitcoin's performance relative to traditional assets like gold can impact its value.
Technical challenge
The fluctuations in Bitcoin's price over the last weekend reflect the complex interplay of economic, political, and market-specific factors. As investors continue to navigate these uncertainties, Bitcoin's price is likely to remain volatile. The influence of major economic data releases, political announcements, and strategic investments will continue to shape the cryptocurrency's trajectory in the coming days and weeks.
The main technical 1-day resolution graph indicates that Bitcoin Goes "Red Days Again" since recent "relief rally" has been Null.
Ahead of upcoing week our "super-duper" @PandorraResearch Team is Bearishly calling to numbers between $30 000 to $50 000 per Bitcoin, that is correspond to major current support of 200-week SMA.
Conclusion
In summary, Bitcoin's price movements are a testament to the dynamic and speculative nature of the cryptocurrency market, where sentiment can shift rapidly based on a wide array of factors. As the market continues to evolve, understanding these influences will be crucial for investors seeking to navigate the volatile landscape of Bitcoin and other cryptocurrencies.
--
Best 'Jojoba oil' wishes,
@PandorraResearch Team 😎

Bitcoin 10X Trade-Numbers (1,375% Potential)The low is in and this is the perfect timing for a long-term LONG on Bitcoin (BTCUSDT and other trading pairs).
This is for experienced traders and can end up producing huge profits, great growth, amazing results —great entry timing.
__
LONG BTCUSDT
Leverage: 10X
Entry levels:
1) $85,000
2) $83,000
3) $81,000
3) $78,000
Targets:
1) $94,810
2) $98,804
3) $101,058
4) $104,266
5) $108,353
6) $112,859
7) $115,648
8) $120,154
9) $132,643
10) $139,250
11) $158,347
12) $165,345
13) $189,212
14) $200,000
Stop-loss:
Close monthly below $78,000
Potential profits: 1375%
Capital allocation: 5%
____
Thanks a lot for your continued support.
Namaste.

BTC CME GAP
- A new gap was created this weekend on the CME.
- BTC's price is higher there, which is typical.
- A gap isn’t always filled; while many do eventually close as prices retrace, it’s never guaranteed.
- This isn’t a price analysis, but rather an alert to monitor the gap.
- I’ll add my previous gap analysis in the comments.
Happy Tr4Ding

Will the bitcoin bloodbath send prices below its 200-day SMA?Currently lower for a sixth day, bitcoin futures have just tested the 200-day average for the first time this year. This clearly marks a pivotal moment for bulls and bears over the near term, but we also have to factor in the higher timeframes.
Matt Simpson, Market Analyst at City Index and Forex.com

BTC1!/MBT1! Day Trade Plan for 02/26/25BTC1!/MBT1! Day Trade Plan for 02/26/25
📈 90155, 91590
📉 87280, 85850
Like and share for more daily ES/NQ levels 🤓📈📉🎯💰

CME BTC Futures Weekly Plan analysis
In this tradingview blog, we will refer to our February 10, 2025, weekly trade plan for CME BTC futures . We highlighted three potential scenarios last week. Our main scenario 1 played out. It did not reach the high we expected in our plan, however, BTC futures consolidated further around the mCVPOC, i.e., our Anchored Volume Profile from November 10th, 2024.
We highlighted the following key levels:
Yearly Hi:110,920
mCVAH: 104,400
Dec 2024 mid-range: 101,570
Jan 2025 mid-range: 100,610
mCVPOC: 98,075
mCVAL: 93,730
Key Bull Support: 92,505 - 90,000
Scenario 1 stated Further chop and acceptance. We noted the following:
“In this scenario, we may see price action remain range bound. Traders look for clarity on how policy may affect market sentiment before further committing capital”.
Also, as acceptance (balance) builds, mCVPOC has also shifted. You can see that mcVPOC is currently sitting at 97,965 (when posting this recap). Market was choppy as expected, although it did not reach December 2024 or January 2025 mid-range. Markets chopped below mCVPOC, touching mCVAL.
This is a time where patience is required and it is better to sit on your hands rather than engaging with markets in choppy conditions.
Although we are wary of news and that it may impact prices. Our main portion of analysis and plan is founded upon Volume Profile, multiple time-frame analysis as mentioned in our recap from February 6, 2025.
This is just one of many ways to look at the markets. We provide these recaps on our thoughts on markets to help you understand and incorporate these into your own style of viewing and analyzing the markets.

MBTC1!/BTC1! Day Trade Plan for 02/10/25MBTC1!/BTC1! Day Trade Plan for 02/10/25
📈 99590
📉 93365
Like and share for more daily ES/NQ levels 🤓📈📉🎯💰
(💎: IF THERE IS NOT MUCH VOLATILITY; FOCUS ON ZONES VERSES INDIVIDUAL PRICE LEVELS)
*These levels are derived from comprehensive backtesting and research, demonstrating over 90% accuracy. This statistical foundation suggests that price movements are likely to exceed initial estimates.*

"the top is in", "for the rates"gm,
markets tend to be forward looking, and based off my understanding + the chart data, it appears the top is in for the rates.
i predict the market will begin to price in future rate cuts and start bringing the us10y down.
this will open the door to a "risk on" enviroment for big tech, as well as risk assets like crypto .
---
the count on the us10y is relatively simple.
5 waves up from the 2020 lows.
predicting 3 waves down into the year ahead.
the low on the us10y should coincide with a high in the global liquidity index,,, which is set to peak into the end first month of 2026.
🌙
---
ps. check out the last us10y update from 2 years ago via:
