BTC. Levels for intraday trading for the weekend 27-28.04.2024During the day you can trade from these price levels. Finding the entry point into a trade is up to you, depending on your trading style and the development of the situation.
If you expect any medium-term price movements, then most likely they will start from one of the zones.Relevant to use as a location for installing TP.
Levels are valid throughout the day, the date is in the title. The next morning I adjust the levels based on current data and publish a new post.
The history of level development can be seen in my previous posts. They cannot be edited or deleted. Everything is fair. :)
---------------------------------------
Levels are drawn before the European session, based on volumes and data from the CME. They are used as zones of interest for intraday trading. When approaching a level, a “reaction” is expected, which can be traded for both a rebound and a breakout. The worst option is if we revolve around the level in a flat.
Do not reverse the market at every level. If there is a trend movement, consider it as an opportunity to continue the movement. Until the price has drawn a reversal pattern.
TV does not allow publishing timeframes smaller than M15.Reactions to levels and the search for entry points are more convenient to look at M5-M1.
Don’t forget to like Rocket and Subscribe!!!
Bitcoin Futures

CASH (DOLLAR) IS TRASH... S&P performance vs gold and bitcoin The stock market had a monstrous performance in recent years and continues its secular bull run but If you compare it to gold it performs quite normally...and if you compare it to Bitcoin it has a disastrous performance. Looks like those monstrous performances of the stock market are mostly caused by the dollar devaluation rather than anything else

BTC CME ANALYSISThis is the CME chart where we can see the Bitcoin GAPs.
In the range of 66360 - 64190 we have a GAP that may be filled.
We have also had a bearish CH and the price has reached supply.
If the gap fills up, it's a good time to look for buy/long trades

Get Ready for Bitcoin to Rally as ETF Adoption Grows!Bitcoin's future is here due to growing ETF adoption. Here's a breakdown of the key points with a neutral perspective:
Key Points:
• ETF Adoption: The message highlights the increasing adoption of Bitcoin ETFs, which could be driving institutional investment.
• Potential Rally: This suggests that Bitcoin's price may rise significantly due to this new wave of interest.
• Call to Action: It strongly encourages you to buy Bitcoin now to potentially profit from the rally.
Neutral Perspective:
• Investment Risk: Bitcoin is a volatile asset, and there's no guarantee of a rally.
• Do Your Research: Focus on potential gains but there are investment risks. It's important to understand Bitcoin's price history and the risks involved before investing.
• Long-Term Strategy: Understand short-term gain. Consider if Bitcoin aligns with your long-term investment goals.
Before Investing:
• Research Bitcoin's price history and volatility.
• Understand the risks and potential rewards involved.
• Only invest what you can afford to lose.
Overall:
There are potentially lucrative opportunities but be cautious. Do your research and prioritize long-term strategy over following short-term hype. Consider consulting a financial advisor for personalized guidance.

Swing trade for Bitcoin (BTC1!) - 1-hour chartBitcoin futures managed to fid support above $60k before snapping a 4-day losing streak. Bullish momentum increased from GETTEX:64K , and the move lower since appears to be corrective in nature against the strong rally from $64k.
A bullish outside / engulfing candle formed around the 50% retracement level and above Wednesday's daily TPO VAH time price opportunity, value area high).
The bias is now for a move higher towards SWB:69K , with the potential for a move to $70k. At which point we'll seek evidence of a bearish reversal, given price action clues on the weekly and daily charts.

AIQ ETF: Artificial Intelligence - Is The New One Bitcoin!?Everyone was talking about ChatGPT in the last quarter.
Investors were trading on a rush. Thanks to launch of the bot, well-known stocks, such as NVIDIA shares, have shown the highest profitability among all stocks - components of the S&P500 and Nasdaq-100 indices since the beginning of the year.
Previously low-profile AI stocks like MobilEyE Global , Ambarella , C3.ai have become more popular.
OpenAI introduced ChatGPT on November 30th, and since then it has demonstrated the ability to perform a number of tasks such as writing stock articles, firing emails, and even messaging on dating apps.
ChatGPT is a conversational AI chatbot developed by OpenAI that supports natural language queries.
The buzz exploded and blew the roof off when it was reported OpenAI is to receive a $10 billion investment from Microsoft .
Undoubtedly, the launch of ChatGPT has become one of the most disruptive topics in the financial markets in Q1 2023.
And now, at the beginning of a new quarter, here is a publication that was fully created by ChatGPT Artificial Intelligence, under request to tell a 1200-word Fantastic story Artificial intelligence Becomes The Next Bitcoin.
Good or bad, y'all be the judge. But here's what ChatGPT said...
n the year 2040, the world had seen incredible advancements in technology. The most talked-about topic was artificial intelligence (AI). AI had become a ubiquitous part of daily life; from self-driving cars to chatbots, AI was everywhere.
But there was something different about this AI. It was not just a tool to make our lives easier; it was a valuable asset that people could invest in. The AI market had become the next big thing, and some even compared it to the early days of Bitcoin.
A young man named Jack had always been fascinated by AI. He had studied computer science in college and had been working at a tech company for a few years. Jack was always looking for the next big thing, and when he heard about the AI market, he knew he had to get involved.
At first, Jack was hesitant to invest his money in something that seemed so new and untested. But as he researched more and more, he became convinced that AI was the future. He decided to take the plunge and invested all of his savings into an AI startup called Mindworks.
The startup had a revolutionary new product that used AI to predict market trends. It was unlike anything else on the market, and investors were taking notice. The company's stock began to rise, and soon Jack's investment was worth ten times what he had put in.
Jack was thrilled with his investment, but he knew that the market was volatile. He had seen what had happened with Bitcoin; it had soared to incredible heights before crashing down. He didn't want to make the same mistake.
As he watched the market closely, he noticed that there were other startups popping up all over the place. Some were using AI to create better healthcare solutions, while others were developing AI-powered robots that could do jobs humans couldn't.
Jack realized that the AI market was growing fast, and he needed to stay on top of things if he wanted to continue to make money. He decided to start a blog where he could share his insights into the AI market and offer advice to other investors.
The blog quickly became popular, and Jack was soon seen as an expert in the field. He was invited to speak at conferences and was even featured on news programs. He was living the dream, making money from something he loved and helping others do the same.
But as the AI market continued to grow, so did the competition. The startups that had once been small and unknown were now getting funding from big-name investors. The market was becoming saturated, and it was becoming harder and harder to stand out.
Jack knew that he needed to do something to differentiate himself from the competition. He decided to create an AI-powered platform that could analyze the market data in real-time and make investment recommendations.
It took months of hard work, but Jack finally launched his platform. It was an instant success, and investors were lining up to use it. Jack's platform was unlike anything else on the market, and it quickly became the go-to tool for AI investors.
As the market continued to grow, so did Jack's wealth. He had become a millionaire, thanks to his investments in the AI market. But he never forgot his roots and continued to offer advice to other investors through his blog.
The AI market had become the next big thing, and Jack had been there from the beginning. He had seen the potential of AI and had taken a chance on something new and untested. And now, he was reaping the rewards.
As he looked back on his journey, he realized that he had become a part of something much bigger than himself. The AI market was changing the world, and he had played a small part in making that happen.
Jack knew that there would be ups and downs in the market, but he was confident that AI was here to stay. It was the future, and he was excited to see where it would take us.
The end.
The main chart illustrates that the Bearish Trend in AIQ ETF - Global X Artificial Intelligence & Technology ETF is also - the end 😊


Gap closed on Bitcoin futures.With a candle that can be seen as a hammer, the price closed the gap by taking buy orders that were in the majority compared to sells, the candle is evident. In the related analysis I had written that it would be a very useful level, given that gaps often work well as supports or resistances, in this case it has become a very useful support, a perforation of the minimum of this candle would be a sign of weakness, but let's see better the context in which we find ourselves.
At this moment the price of btc is correcting in the medium term (2/3 months), therefore faced with a movement of approximately 88 days, a correction could occur (which has drawn a new high) linked to this cycle, of course if if the scenario changes, the session count would also change. So far the price is moving higher and there is no reason to think otherwise, so my bullish hypothesis or scenario continues to be useful in understanding where we are now. Possible even very violent increases could appear before long, we are at the end of this correction which has not yet given the final blow, the classic strong decline, unless it was this weekly candle which we can call hammer, the last decline of the correction. Now we need caution and above all trust in the trend.

Bitcoin ETFs now available on TV. Easy Money As Never Before 😅Bitcoin ETFs now available on TradingView
NASDAQ:IBIT - iShares Bitcoin
AMEX:BITB - Bitwise Bitcoin
AMEX:DEFI - Tidal Bitcoin
AMEX:ARKB - ARK Bitcoin
AMEX:GBTC - Grayscale Bitcoin
AMEX:FBTC - Fidelity Bitcoin
AMEX:BTCW - WisdomTree Bitcoin
AMEX:BTCO - Invesco Bitcoin
NASDAQ:BRRR - Valkyrie Bitcoin
AMEX:HODL - VanEck Bitcoin
AMEX:EZBC - Franklin Bitcoin
SEC officially approves BTC Spot ETFs
Tip #1: use TV search box to filter, find, and sort all Bitcoin funds, just like the attached screenshot.
Tip #2: use TV search box to filter, find, and sort all Bitcoin futures, just like the attached screenshot.
Tip #3: Long 1st, Short 2nd
Tip #4: Enjoy the Money 🤣🤣🤣

BTC VS NDX. FOLLOWING THE BEARISH SCENARIOPreviously in the Series..
👉 Launch of BTC futures on December 18, 2017
Bitcoin is down more than 10 percent in a week and crashed 80+ percent in a year.
👉 Launch of trading on Coinbase IPO NASDAQ:COIN on April 14, 2021
Bitcoin is down more than 10 percent for the week and crashed 50+ percent for the quarter.
👉 Launch of AMEX:BITO - the first fund based on BTC futures, on October 19, 2021
Bitcoin is down more than 10 percent in a week and crashed 80+ percent in a year.
👉 Launch of ̶G̶i̶p̶s̶y̶ ̶C̶a̶m̶p̶ 11 ETFs on BTC, incl. on BTC spot, on January 11, 2024.
Bitcoin has slumped by more than 10 percent in a week and further losing its shores.
The main technical graph is a ratio between Bitcoin BITSTAMP:BTCUSD and NASDAQ:NDX Nasdaq-100 Index.
Indeed, BTC underperforms against NDX, almost for a 3 years in a row..
But blind faith is ineradicable..
Who knows, what BTC halving has to say..
The truth is One and Only - just trend is your real friend ! 😄

BTC for surefib, fractal
log chart
nothing more to say
mention that in higher timeframe we also at top of the fib level

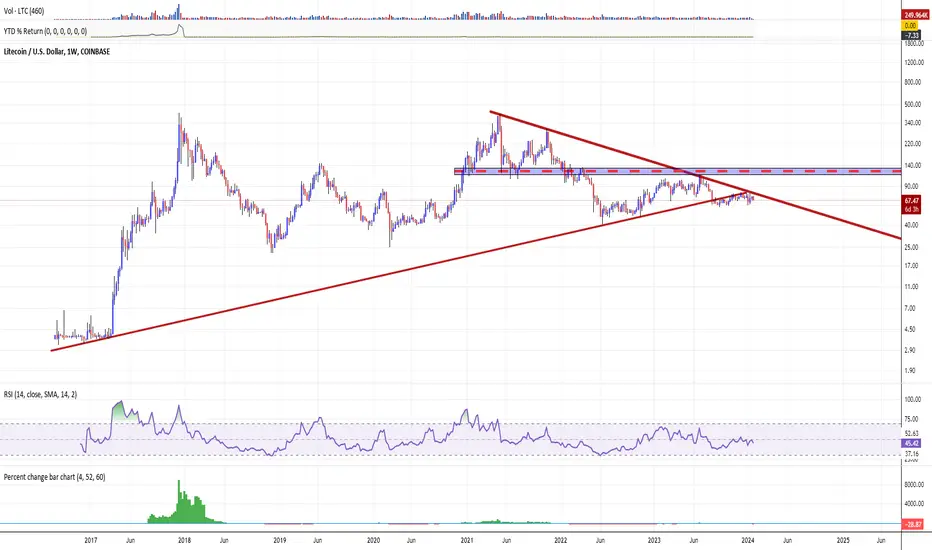
🏃♀️🏃♂ LTC. The spring has compressed. XxX's are inevitableOne of the most anticipated online events in the digital currency ecosystem in H2'23 was the Litecoin (LTC) halving, that took place in early August, 2023.
As the cryptocurrency market prepares for one of the network's major events, the Litecoin (LTC) halving, investors and analysts were peering into the crystal ball of market trends in an attempt to predict the outcome.
However, based on the hype that has accompanied the halving event over the past few months, there is good reason to believe that the online event may produce a different result than expected.
Historical backtest analysis says that every time the number of new addresses COINBASE:LTCUSD exceeded 350,000 over the past five years, a significant price correction followed.
More than 690,000 LTC addresses have recently been created, suggesting that the upcoming halving could be a “news selling” event.
On the other hand, the upcoming Litecoin halving, in theory, provides the opportunity for a significant price increase. This thesis stems from the deflationary effect that halving will cause, reducing the rate of creation of new Litecoins.
Combined with the growing demand for the coin, this again, in theory, could create an ideal scenario for price growth in the medium to long term.
The aftermath of the Litecoin halving should provide the cryptocurrency community with valuable information, especially as investors prepare for the subsequent Bitcoin halving
BITSTAMP:BTCUSD , scheduled for April, 2024.
Technical picture in Litecoin COINBASE:LTCUSD at the same time indicates a continuing deflationary price compression, with possible prospects for a further price decline within the boundaries of a downward channel to multi-year/ historical lows.
🅱️ BTC CME Futures GAPs Points To $35K, Who's Selling? | Go UP!Looking at the Bitcoin CME Futures contracts we have to major gaps on the way down that are yet be filled.
These gaps can be found in the following ranges:
1) $34,445 - $35,775
2) $27,365 - $28,860
Now, let me ask you one question...
Who's selling?
Who is going to sell?
Who is selling now?
I ask this question because there is people around waiting for a "new low", "another leg down"... But who is going to sell?
Who will part with their bitcoins after Bitcoin hit a low back in June 2022?
The capitulation phase is where the masses sell.
The "sucker rally" is not.
The sucker rally, terrible name, happened in July/August 2022, then again months of red.
If you count from June '22 until January '23 you have more than six months.
That's the bottom pricing... The sellers had their time to sell from November 2021 until early this month...
New money is coming in not to sell but to hold long-term and profit as bitcoins price appreciates over the years.
Our billionaire friends gave the Go. ✔
The charts gave us the Go. ✔
Our third eye/intuition gave us the Go. ✔
Conventional markets gave us the Go. ✔
The FED gave us the Go. ✔
Even China, opening its country, gave us the Go. ✔
Astrology gave us the Go. ✔
Nothing is saying down now...
Everything is saying Go... UP!
Namaste.

Bitcoin - Short; For now... Then, dependent on what happens around the $20,000 level, up, then down, ... etc., etc.
This is all speculation, of course, then again, that is the name of the game. - Right?!
Trade it as it unfolds.

Bitcoin (BTC) "Bear Trap" [Daily] LongFor this trade to be in play, Bitcoin still needs to drop about $2,000. That said, we hope BTC eventually trades down below 25K. This setup is considered a “bear trap” because traditional support/resistance traders are likely to be watching/sell a break below the 24756 low which printed on 6/14. Despite what traditional technical analysis suggests, making a bearish bet below 25,000 is not a probabilistically attractive setup. Clear evidence of willing buyers exists in the form of daily demand @ 23940-24745. If Bitcoin continues to trade lower, which seems somewhat likely given that current price falls within a large range of “filled orders” (denoted by white rectangle on right chart + not indicative of material price imbalance), we will be stalking buys below the mid-June ’23 low. If downside momentum is very strong, consider watching refining/micro timeframes for reversal signals before entering; catching a falling knife is never a good time! This buy idea is further bolstered by the Anchored VWAP, which, when secured to the pivot low from 11/20/22, coincides with our demand.
Regarding profit targets and stops, consider using the respective supply zones (in red) south of 28000 and north of 29000. Ultimately, we’re looking for a bigger move in BTC/USD (see thicker red supply zones 35000+). For stops, you can either use a % of the width of the daily demand zone or look for LTF demand within the expanded range candle from 3/12/23; in another charting platform, which we use for our primary work, we’ve ID’d a 15-minute insulating zone 23425-23671. Placing stops below this area would, of course, increase the amount of capital risked, but potentially reduce the probability of a premature stop out. Trading is a very personal undertaking, so be sure to trust your individual trade plans/parameters regardless of the above ballpark suggestions…
Hit us with any questions or comments you have. Hope this helps!
Jon @ LionHart Trading

BITCOIN 1D Bitcoin Price Expected 8% Rise Amid ETF Approvals Bitcoin has broken the ceiling of the falling trend in the medium long term, which indicates a slower initial falling rate. The currency is moving within a rectangle formation between support at 25971 and resistance at 30488 .
Pivot Price: 27687
Resistance prices: 29051 & 29452 & 29807
Support prices: 26967 & 25971& 25303

The first green September in 10 yearsIn my last post , I made the case of Bitcoin going to 21k. In this analysis, I want to question that theory.
TLDR: I am questiong my last analyses of Bitcoin going to 21k, based on the current price action.
After the breakout of the support/resistance zone, I was certain 21k was confirmed. However, the next day, an engulfing bullish candle was formed. This did not had to lead to a new theory, but the price kept on rising.
I set 2 conditions for myself as to when to switch my opinion:
1: Bitcoin has to break the current resistance zone (condition has been met today)
2: Bitcoin has to touch the second resistance zone, and come back to the old zone, making it new support.
As the first condition has been met, I see it less likely for Bitcoin to reach 21k. I think the new confirmation should be: If Bitcoin breaks the resistance line it is touching right now, then 21k is off the table, and we will see our first green September in 10 years.

BITCOIN ROADMAP — HEAVEN AND HELLHeaven can be cold
Baby, baby, when you lose control
Everybody needs someone 🅱
Be careful in the night
He can hurt you more
Baby, baby, as he did before
Come on baby, keep your hands of him
In the gypsy night 😘
It will come and go
Everybody knows
You make your own
Heaven and hell 💔
Daytime traders love for sale
You make your own
Heaven and hell
Statements full of tears will tell 😭
He takes your heart
I know him well
You've got no time to lose
For heaven and hell 🎉
Behind the painted smile
Baby, baby, he is running wild
Everybody needs some love tonight
Be careful in the night 🥳
This publication is to introduce with BTC roadmap, unforeseen rocks and climbs.
// Look first. Then leap!

Bitcoin Below 50ma, Watching $20k Price GapAlong with all of the major stock indices falling below their 50-day moving averages this week, Bitcoin is also below its 50ma and testing the 100ma for support. Failure to hold above the 100ma near $28.7k will likely lead to a test of the orange trendline near $28k. If that also fails to hold as support then we can consider the uptrend in price over and a likely test of the 200ma near $25k. The main lower level that I've been watching and expecting price to hit after price failed to hold above $30k twice this year stems from the gap in price created in early March in the $20k- FWB:21K area. Gaps tend to get filled and Bitcoin has a consistent history of filling gaps in the chart.
The lower PPO indicator shows the green PPO line trending below the purple signal line which indicates short-term bearish momentum. Both lines have also crossed below the 0 level which indicates potential intermediate to long-term bearish momentum in play.
The TDI indicators shows the green RSI line trending below 50 and heading down towards the 40 level. A move below the 40 level would indicate a short-term bearish price trend. The RSI is also trading in the lower half of extremely tight Bollinger Bands which indicates current short-term bearish momentum with a potentially big move head as tightening BBands tend to precede large moves.
Overall, Bitcoin hasn't flipped completely bearish yet, but when taking into account the deteriorating picture in the stock market and Bitcoins indicators leaning bearish, the outlook for price looks weak here. The main level I'm watching for now in the short-term is the orange uptrend line as a breach below there would indicate that price is likely to continue heading lower, which seems like the likely move after two failed attempts to hold above $30k this year.
I'm currently short Bitcoin via the ProShares Short Bitcoin ETF, BITI. Entry was at $19.71 yesterday with a stop-loss at $18.91 should Bitcoin happen to turn around and head higher.

#Bitcoin - thoughts out loud #19Good evening, we are from Ukraine!
Dear colleagues, I am glad to welcome you!
Having familiarized myself with the market situation on the younger time frames, I can note several key points of the situation that need to be paid attention to. First of all, the current decline in volatility on the first cryptocurrency indicates that the "spring" is narrowing and should soon shoot. The false distribution phase is coming to an end, so I expect a successful spike test or the last point of resistance, as it happens, if one of the signals is present, this is a 90% long scenario and then we will see how easy it will be to stop this locomotive. Secondly, in the case of a true distribution, the price should break the local highs above 32000 and then we can safely talk about Bitcoin at 27000, possibly even cheaper.
This is a short action plan in a few words, thank you for your attention, all the best.
A like or a comment would be the best thank you from you. To those reading, I wish you all the best of luck!
Thank you for your attention, and a special thanks for your likes and comments.
Sometimes you win /sometimes you learn .
#Bitcoin

Futures on BTC and S&P500: The ratio you should considerThe main chart is the ratio between Futures on BTC and S&P500
👉 Bitcoin CME Futures contracts are equal to 5 bitcoin, as defined by the CME CF Bitcoin Reference Rate (BRR)
👉 E-mini S&P500 Futures contracts are equal to 50 x S&P500 Index
Special remarks
😀 The Support Area and Resistance Areas are as highlighted on the chart.
😊 Since Bitcoin CME Futures were launched in Dec, 2017, S&P500 outperforms BTC to nowadays.
😁 Bitcoin has NO BALANCE SHEET, EARNGINS AND NEVER PAY DIVIDENDS

Market Update - BTC, BTC1!, ETH, SP, NQ, DXYQuick market update focusing on Bitcoin and covering BTC CME Futures, ETH, SP, NQ, and DXY.
Effectively Bitcoin is still holding the $30k support and trend does remain to the upside, with major news events starting Wednesday with inflation data, we are expecting an increase in volume/volatility. Overall we did breakdown from the range high but until the $30k support is lost and bearishly retested the overall trend remains to the upside.
TradFi is also holding its ranges continuing the rally, until higher timeframe structure is lost the expectation is that the upside trend will continue until proven otherwise.
Generally we have hedged off BTC longs with some shorts from $31.2k and higher, we are still net long but have taken some profit in the upside of the range last week as a precaution. The play is the range until proven otherwise.

$BTCUSD #Bitcoin Can Breakout SoonTraders and investors,
Bitcoin has been causing a lot of confusion among traders and investors. So let's break it down and understand.
1. in June 2022 (1 year ago) Bitcoin broke out of the 30000 price tag but never retested that.
2. This year it formed a W pattern to reach that level and retest it.
3. The price reached 30000 this year and completed that W pattern. When a W pattern "completes" the market goes down. So Bitcoin started to fall from there.
4. It reached its target level of Fibonacci 38.2 which was also a good confluence of Structure and Trend Line
5. This formed a flag pattern.
6. Currently the price is supported by the trend line and moving slowly inside the flag
7. This has been going on for quite some time now. So a breakout is imminent.
8. If it breaks out to the downside it can fall further to foran M pattern around 21477
9. If it breaks above the previous high of 31163 and confirms then it will become bullish and can target a bigger W pattern completing around 36783 and a better W pattern at 41000.
10. Caution: Until the breaks and confirms the previous high of 31163 there will still be a chance of it falling down to complete the M pattern as pointed out in point 8 above.
Please support this analysis by liking and sharing. 👍🙂
Rules:
1. Never trade too much
2. Never trade without a confirmation
3. Never rely on signals, do your own analysis and research too
✅ If you found this idea useful, hit the like button, subscribe and share it in other trading forums.
✅ Follow me for future ideas, trade setups, and updates on this analysis
✅ Don't hesitate to share your ideas, comments, opinions, and questions.
Take care and trade well
-Vik
____________________________________________________
📌 DISCLAIMER
The content of this analysis is subject to change at any time without notice and is provided for the sole purpose of education only.
Not financial advice or signal. Please make your own independent investment decisions.
____________________________________________________
