Two unfulfilled gaps in the BTC1! futures chart ?
Hi everyone,
I've just identified these two gaps in the BTC1! Futures chart, does it necessarily means that they will be filled in the future ?
That would mean a huge drop in BTC's price.
Bitcoin Futures

BTC1 - CME - Bitcoin - GapsThere is currently a small gap from weekend.
Normally close in next hours

Technical analysis update: BTCUSD (20th October 2021)BTCUSD reached new all time high today as Bitcoin ETF reached over 1 bn. USD in AUM within just two days since it started trading. We previously noted if new all time high was reached then it would force us to change our stance from bearish to bullish. We also noted that we expected price to continue rise in case of breakout above previous all time high. We continue to think that more upside awaits BTCUSD. However, we think investors should be cautious. Volume keeps decreasing while price reaches new highs and several indicators are overvalued which suggest that price should correct. Because of that we think it would be smart to wait for any pullback before entering long position in the market. Bitcoin currently provides interesting setup with possible long entry above short-term support or short entry below short-term support.
Technical analysis
RSI is extremely overvalued and we expect it to reverse soon. We expect such occurence to be accompanied by selling pressure. Stochastic remains bullish altogether with MACD. ADX contains high value which suggests that trend is strong or near its peak. We expect volatility of BTC to stay elevated in short-term.
Support and resistance
Short-term support coincides with previous all time high of 64 895.22 USD. Support 1 appears at 59 603 USD and Support 2 at 52 956.47 USD. Closest psychological resistance lies at 70 000 USD.
Disclaimer: This analysis is not intended to encourage any buying or selling of any particular securities. Furthermore, it should not serve as basis for taking any trade action by individual investor. Your own due dilligence is highly advised before entering trade.

Technical analysis update: BTCUSD (15th October 2021)BTCUSD trades slightly below 60 000 USD pricetag. We will observe whether it manages to break above this price level and stay there. It would be particularly bullish for BTCUSD and in such scenario we would expect BTCUSD to try new all time high. However, there are several indicators that reached overbought condition already. Therefore, we are very cautious.
Technical analysis
Stochastic is bullish. MACD is also bullish. Trend continues to be bullish, however, RSI reached overbought condition which suggests that price might experience correction soon.
Support and resistance
Short-term support sits at 59 603 USD. Support 1 appears at 52 956 USD and Support 2 at 48 834 USD. Support 3 sits at 39 573 USD while major support lies at 28 600 USD. Major resistance coincides with all time high at 64 895 USD.
Previous thought from 6th October 2021:
Here we noted that we changed stance from neutral to bullish.
Previous thought from 4th October 2021:
Here we presented interesting and very clear setup for BTCUSD. After that price bursted into bullish direction.
Disclaimer: This analysis is not intended to encourage any buying or selling of any particular securities. Furthermore, it should not serve as basis for taking any trade action by individual investor. Your own due dilligence is highly advised before entering trade.

BTC will continue STRONG BULL TREND to new ATHBINANCE:BTCUSD BINANCE:BTCUSDT COINBASE:BTCUSD GEMINI:BTCUSD BITTREX:BTCUSD
BTC show strong bull trend 1D chart Heikin Ashi when broke out of Keltner channel on Oct 8. Strong possibility of new ATH within next week. Trade safe.

Technical analysis update: BTCUSD (6th October 2021)BTCUSD surprised us with its abrupt move up. We have changed our stance from neutral to bullish. We will observe whether short-term support at 52 956.47 USD will hold in case of a selling pressure (if short-term support is broken we will question whether this recent move is a bull trap). However, we have to note that while very bullish breakout above previous peak has taken place today we remain very cautious due to condition of several technical indicators. We will also look for second divergence forming on hourly time frame which would suggest that price rise is losing steam.
Technical analysis
RSI is bullish and nears overbought level. We will observe whether RSI manages to penetrate 70 points mark while we expect this to be accompanied by further price rise. However, we have to say that such phenomenon is often accompanied by peak in price and thus we remain cautious. MACD crossed into bullish zone and continues to build bullish structure. DM+ and DM- suggest bullish trend is prevailing at the moment. ADX continues to reset from previous trend and thus becoming neutral in value.
Support and resistance
Short-term support sits at 52 956.47 USD. Closest support below that is at 48344 USD. Another two support levels can be found at 39 573.21 USD and at 37 300 USD. Major support level is at recent low of 28 600 USD. Closest resistance appears at 59 603 USD and major resistance sits at all time high of 64 895.22 USD.
Here is our previous thought from 4th October 2021:
Here we noted that we were sceptical of recent price move up but we layed out two possible scenarios for setup that was taking place. Price has penetrated resistance at 48 834 USD and moved into bullish territory.
Disclaimer: This analysis is not intended to encourage any buying or selling of any particular securities. Furthermore, it should not serve as basis for taking any trade action by individual investor. Your own due dilligence is highly advised before entering trade.

Strong growth awaits Bitcoin $ 76,000 Expect a sharp rise from Bitcoin to your previous high of 55,000.
There are two views.
After breaking its previous ceiling, it will go up to $ 76,000 in the first step.
Good luck.

Technical analysis update: BTCUSD (1st October 2021)Overnight BTCUSD jumped 10% up leaving many investors perplexed. We noted in our previous idea that we changed our stance to neutral. We think if price fails to break above resistance near 49 000 USD then downtrend will resume. In our opinion this area is very attractive for short re-entry if one took profits on a way down. But we think such position should be accompanied with tight stops due to rising volatility in BTC. Our stance is neutral (to bearish if resistance manages to hold further rise of price).
Technical analysis
On daily time frame RSI and Stochastic reversed to the upside. MACD is striving to turn bullish as well. ADX is declining with suggests that prevailing trend is losing momentum.
However, hourly time frame is in extremely overbought condition. Because of that we are very sceptical of overnight rise.
Support and resistance
We are closely watching mentioned 49 000 USD price level as short-term resistance appears slightly below it. Next resistance sits around 53 000 USD and 60 000 USD respectively. Then major resistance sits at all time high near 65 000 USD. We also watch short-term support near 39 500 USD. Another support below that appears close to 37 500 USD.
BTC1! (Bitcoin continuous futures)
We also observe gap visible in the futures market as we think of it as important level. Breakout to the downside from this area would suggest that downtrend resumed.
Disclaimer: This analysis is not intended to encourage any buying or selling of any particular securities. Furthermore, it should not serve as basis for taking any trade action by individual investor. Your own due dilligence is highly advised before entering trade.

#Bitcoin journey to $130kMaybe last cycle for Bitcoin
Life opportunity one btc $130k usd
After
The crash will be huge
No more bull market, only bear winter season
Bitcoin will back probably to around $13
No more manipulation
No more non backed Tether / usdc
No more Bank frauder Exchanges
CBCD + Regulated market + high taxes
You can back mining bitcoin from your home pc in 2025
Goodluck

bitcoin: sellstop in low and buylimit on fibo 61% is best idea 100% put sl=1500$ trailstop=3000$
advice : near 40.000 if you can pick buy dont close soon , hold it min 30 day min to 50.000

Technical analysis update: BTCUSD (20th September 2021)Price of bitcoin drifts lower towards 45 000 USD on Sunday to Monday night. We continue to be bearish on BTCUSD. Our short term price target remains 40 000 USD.
Technical analysis
We continue to observe price pattern in which Bitcoin increases in price over the weekend and then sells off on a Monday and during the week. It is visible that price exited its gap observable in the futures market (to the downside). We think this phenomenon suggests more selling pressure is on a way. RSI and Stochastic are very bearish at the moment. MACD is also bearish and it needs to be observed in the following days. We will look for MACD's crossover below 0 points to the bearish zone. We expect this to further bolster bearish case for BTCUSD. ADX hoovers around 24 points suggesting that trend of intermediate strength is present and building up in momentum. Because of these technical reasons we continue to be bearish on BTCUSD.
BTC1! graph (continuous futures market):
Above is depiction of BTC1! graph (continuous futures market). It is visible that price broke to the downside from gap zone.
Support and resistance levels
Closest support sits around 43 800 USD while major support level appears around 28 800 USD. Closest resistance sits around 53 000 USD and then around 60 000 USD. Then major resistance level appears around 65 000 USD.
Here is weekly graph of BTCUSD:
Weekly timeframe confirms that downtrend in BTCUSD is building up.
Here is our first idea on BTCUSD we published on 25th August 2021:
Here we noted that we had expected BTCUSD to peak around 53 000 USD before downtrend was to resume. We also layed out bearish case for BTCUSD.
Disclaimer: This analysis is not intended to encourage any buying or selling of any particular securities. Furthermore, it should not serve as basis for taking any trade action by individual investor. Your own due dilligence is highly advised before entering trade.

Technical analysis update: BTCUSD (7th September 2021)Last time we noted that we were very sceptical about bitcoin trading above 50 000 USD. We noted that we were watching RSI for crossover above 70 points which would be subsequently followed by peak in price. Crossover did not occur. However, we believe that the peak in price occured. We are currently very bearish on BTCUSD and we expect downtrend to continue. Our short term price target is 40 000 USD.
Technical analysis
RSI failed to cross above 70 points. Instead it stages reversal. MACD and DMI are bearish. However, Stochastic still oscillates in the bullish area. ADX continues to grow which suggests the trend is building up strength. Closest resistance sits at 59 564.24 USD while major resistance sits at all time high of 64 895.22 USD. Support 1 around 43 800 USD was broken today and we expect it to be retested soon. We remain bearish on BTC.
El Salvador adoption
We would like to express our view on El Salvador's adoption of BTC as legal tender. El Salvador is one out of three latin american countries that are oficially dolarized. El Salvador's GDP is approximately 27 bn. USD and its population stands around 6.4 million. Market cap of BTC is approximately 1 trn. USD while USA's GDP is 21.4 trn. USD. According to well renown economist Steve Hanke over 70% of the population in El Salvador do not possess a bank account. We think it is very interesting information and if true then it is very unlikely that adoption of BTC by El Salvador will have any fundamental impact on bitcoin itself.
Above is depiction of bitcoin futures market. Gap area is observable and we think it plays important role. We previously mentioned that if price of BTC dropped below this area then more selling was highly probable.
Disclaimer: This analysis is not intended to encourage any buying or selling of any particular securities. Furthermore, it should not serve as basis for taking any trade action by individual investor. Your own due dilligence is highly advised before entering trade.

Technical analysis update: BTCUSD (13th September 2021)Recently, when Bitcoin was trading above 50 000 USD we expressed our scepticism about its high valuation. We thought that price was elevated and due to the correction that would begin by price exiting gap zone (observable in the futures market under ticker: BTC1!). We noted that this would further bolster bearish case for BTCUSD. We think this is still the case and more downside awaits BTCUSD. We remain bearish on BTCUSD with short term price target of 40 000 USD.
Futures market (Ticker: BTC1!)
Technical Analysis
RSI is bearish. MACD and Stochastic are also bearish. We expect MACD to cross below 0 points which will take it to the bearish zone. We expect this phenomenon to be accompanied by further drop in price. DM+ and DM- show that BTC is in the downtrend while ADX shows that prevailing trend has intermediate strength. Closest resistance is at 52 956.47 USD and then at 59 603 USD. Major resistance sits at all time high of 64 895.22 USD. Closest two supports appear near 43 800 USD and then near 37 500 USD. Major support is at 2021 low which is 28 600 USD.
Our first thought on BTC1! from 25th August 2021:
Here we expressed our bearish view on BTC. We also noted that we expected temporary peak around 54 000 USD and then subsequent drop in price with possible retest of 2021 lows.

Technical analysis update: BTCUSD (6th September 2021)Bitcoin failed to move down from a gap zone as we previously expected. Instead it broke to the upside and it currently trades around 52 000 USD. This price action forced us to reasses our views. We think it is possible that price might continue little higher. Although, we are sceptical of this price action. We previously noted that we expected temporary high around 54 000 USD before BTC would go retest its 2021 lows. Because of that we will continue to monitor price action closely. In terms of short term outlook we are neutral to bullish at this point. For us to become bearish on BTCUSD again price would have to retrace back into gap zone. Then we would look for break out to the downside.
Technical analysis
RSI is overvalued. It strives to pierce above 70 points. If RSI manages to cross above 70 then we expect more upside for BTCUSD. However, we also expect it to coincide with temporary peak in price. Stochastic is bullish and MACD is also bullish. ADX suggests that trend is still present. Immediate support and resistance is around 50 500 USD. Next closest support is around 48 000 USD and then around 43 800 USD. Major support is exactly at 28 800 USD which is 2021 low. Closest resistance is around 60 000 USD. Then major resistance is at all time high which is 65 520 USD.
Disclaimer: This analysis is not intended to encourage any buying or selling of any particular securities. Furthermore, it should not serve as basis for taking any trade action by individual investor. Your own due dilligence is highly advised before entering trade.

BTC Ascending triangle on the BTC Ascending triangle on the 4 hour. BTC Ascending triangle conversion. Room for BBWP to expand as well as bullish divergence.

Technical analysis update: BTCUSD (31st August 2021)Bitcoin continues to trade within the zone of opening gap from 17th May 2021. In addition to that bitcoin continues to fluctuate above and below its immediate support/resistance. However, it failed to surpass its recent high at 50 585 USD. We view this as bearish and we expect bitcoin to break out to the downside from the opening gap zone (from 17th May 2021). Stochastic, MACD and RSI are all bearish on daily timeframe. This also support our bearish thesis. Due to that we remain bearish on BTC1!.
Previous thoughts from 25th August 2021:
Disclaimer: This analysis is not intended to encourage any buying or selling of any particular securities. Furthermore, it should not serve as basis for taking any trade action by individual investor. Your own due dilligence is highly advised before entering trade.

btc 8\29 updateafter a very skillful shake out, i gotta give market maker props for that move.
i think the move to the upside last night was the ending of an impulse which started on august 26th (from the 0.618)
----
this overnight move down was wave (a), we're currently working on wave (b), followed by wave (c) down to about 47,074
from there i do believe we begin another wave 3 impulse (of wave 5) to about 52.5k, which is also in confluence with the channel btc has been forming over the last few days.
ps. i wouldn't be surprised if btc tested the bottom of the channel we're in - but i have reason to believe it won't. reason being: the lows from august 26th were perfectly in confluence with the local golden zone. whatever positions were accumulated down there by market maker, have not been sold yet - so a revisit back into that area should not take place from my perspective.

Fascinating isn't it?This just an idea.. DOES NOT MEAN IT WILL HAPPEN!! but just think about it. We are up 15x from the covid lows.. all of those who bought at 10k are now sitting with almost 5x returns...With the current trendline from BTC bitstamp chart back in 2012 we should see some kind of drop could be triggered with new black swan event in end of 2021 or 2022. Could be ban of crypto fud or all market crash like the 2020 covid fud.
The cme gap at 9k everyone forgot about could be filled... Everyone is expecting 100k rally or worst case 20k drop... What if they do the unexpected and liquidated everything and make those who bought at 10k sell with panics. That could end the moon boys dreams and institutions buying their bags then going parabolic to 100k.
by the way Black rock bought most of the US housing during 2020-2021 at 20% higher than the market price could be buying crypto they own most of the worlds assets from tesla to pfizer... they want everything control = power. Heard this saying before.. when institutions misses rallies they crash the market to buy at fair price. something like that.
DO NOT TAKE THIS AS TRADE IDEA. this is just conspiracy

Technical analysis update: BTCUSD (25th August 2021)Many people asked us to analyze cryptocurrencies. Therefore we prepared our first bitcoin analysis for you. Recently bitcoin took off its recent lows around 29 000 USD. In the process it closed a gap between 46 620 USD and 48 370 USD. After that bitcoin peakead at 50 858 USD and then reversed lower. We think price level along the gap has an important role. We think if this gap is retraced by price back to the downside then more selling is probable for BTC. In terms of technicals RSI continues to move sideways just below 70 points. It did not cross 70 points to the upside. This is common for corrections in the strong downtrend. MACD is flattening out and it seems as if it wanted to reverse down. In addition to that price is currently far away from its 20-day Simple Moving Average. We think there is high likelihood that price of bitcoin peaked recently (or it will in the short future - around 54 000 USD) and more selling is on a way. If price breaks below its short term support then we expect bitcoin to retest its recent lows around 29 000 USD.
MACD on daily timeframe:
Disclaimer: This analysis is not intended to encourage any buying or selling of any particular securities. Furthermore, it should not serve as basis for taking any trade action by individual investor. Your own due dilligence is highly advised before entering trade.

Short $46,5k long $56kHello traders
Potential inverse h&s on 4h with 2 setup
Short 46.5k
Long 56k
Let’s see if the pattern will plays out or no
-Goodluck


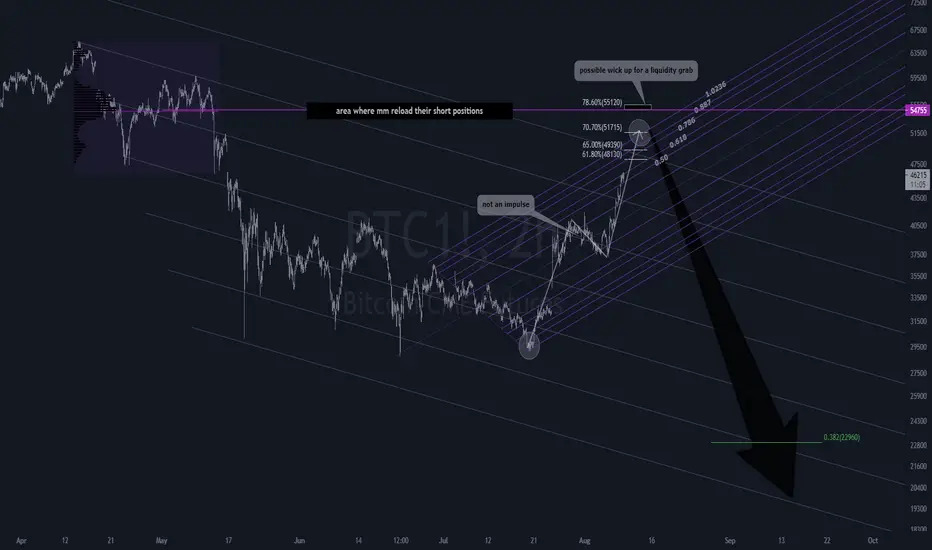
don't shoot the messenger.i'm not convinced that crypto has finished this wave 4 correction, in fact - i am willing to place a large bet against this ponzi when the time comes 😅
take a look at this chart dating back to 2013:
every single correction we've ever had in the history of bitcoin has tested the weekly 200ema before resumption to the upside.
you know what is in perfect confluence with the 200 weekly ema?
the organic wave 4 algo target.
dead cat bounces are fun, but they are short lived - what follows after though, very few ever expect. the majority of the population trade using their emotions & get overly excited due to the large short term gains they experience 😁 (i know the feels, no hard feelings).
--
my downside target is 22k, we could see a wick get as low as 15k for a quick liquidity grab due to the over leveraged long liquidations.
this will put in wave 4 on a higher degree
my upside target from there is 120k (at the bare minimum).
ps. short term bearish, long term very bullish.
ps2. this will be The generational buying opportunity if you know exactly what to buy and when 😉.
best of luck to all 💸
Short bitcoin after fill the gapwe are still in major correction phase and i believe end of this minor bullish correction is around 50k
