BAKKT Bitcoin (BTM1!) - September 22Hello?
Dear traders, nice to meet you.
"Like" is a huge force for me.
By "following" you can always get new information quickly.
Thank you for always supporting me.
-------------------------------------------------- -----
Today's gap is 10510.0-10412.5.
To fill the gap, you need to make sure you can rise above 10510.0 and get support.
If it falls, we have to get support at 10247.5 and see if it can move up along the uptrend line.
If it rises as described above, it is expected to touch the downtrend line (4).
If you fall below the downtrend line (3), I think you need to trade to preserve your profit and loss.
----------------------------------------------------------------
See also the description of the XBTUSD chart.
-------------------------------------------------- ---------
(CME Bitcoin (BTC1!) 1D chart)
There is no gap section for today.
You need to make sure you can get support at 10460.0.
You should also watch for the remaining gaps to fill the 9615.0-9925.0 and 8785.0-8915.0 segments.
It remains to be seen if falling from the uptrend line (2) could give rise to a wave to stop the downtrend.
To do that, we need to see if we can get support around September 28th at 10115.0 and climb along the uptrend line.
If it rises as described above, it is expected to touch the downtrend line (3).
If it falls below the downtrend line (1), I think it is necessary to trade to preserve profit and loss.
-------------------------------------------------- -------------------------------------------
** Check support, resistance, and abbreviation points.
** Support or resistance is based on the closing price of the 1D chart.
** All explanations are for reference only and do not guarantee profit or loss on investment.
Explanation of abbreviations displayed on the chart
R: A point or section of resistance that requires a response to preserve profits
S-L: Stop-Loss point or section
S: A point or segment that can be bought for generating profit as a support point or segment
(Short-term Stop Loss can be said to be a point where profits and losses can be preserved or additionally entered through installment trading. You must trade from a short-term investment perspective.)
GAP refers to the difference in prices that occurred when CME and BAKKT exchanges were closed because they do not trade 24 hours a day.
G1: closing price when closed
G2: The market price at the time of opening
Btc1

CME Bitcoin (BTC1!) - September 21Hello?
Dear traders, nice to meet you.
"Like" is a huge force for me.
By "following" you can always get new information quickly.
Thank you for always supporting me.
-------------------------------------------------- -----
Today's gap is 10880.0-10885.0. (Not shown on the chart.)
We have to see if we can climb above the 11055.0 point.
If it falls, we need to make sure we get support at 10895.0.
It has risen above the 10895.0 point, so it is in a better position than the BAKKT Bitcoin chart or XBTUSD chart.
We don't know how much CME Bitcoin occupies in the coin market, but it makes us look forward to the future as we are preparing to continue the upward trend first.
If it is supported by the uptrend line (2), I think there is a high probability of an uptrend to break through the downtrend line (3).
-------------------------------------------------- -------
(BAKKT Bitcoin (BTM1!) 1D Chart)
Today's gap is 10962.5-10975.0. (Not shown on the chart.)
We have to see if we can climb above the 11055.0 point.
You should also check if the previous gap could rise above 11025.0-11087.5.
As you can see on the chart, the 11055.0 point is a point that must be supported to climb to a very important point.
We will see if we can get support at 11055.0 and move above 11585.0 and above the uptrend line (1) around September 24.
-------------------------------------------------- -------------------------------------------
** Check support, resistance, and abbreviation points.
** Support or resistance is based on the closing price of the 1D chart.
** All explanations are for reference only and do not guarantee profit or loss on investment.
Explanation of abbreviations displayed on the chart
R: A point or section of resistance that requires a response to preserve profits
S-L: Stop-Loss point or section
S: A point or segment that can be bought for generating profit as a support point or segment
(Short-term Stop Loss can be said to be a point where profits and losses can be preserved or additionally entered through installment trading. You must trade from a short-term investment perspective.)
GAP refers to the difference in prices that occurred when CME and BAKKT exchanges were closed because they do not trade 24 hours a day.
G1: closing price when closed
G2: The market price at the time of opening

CME Bitcoin (BTC1!) - September 18Hello?
Dear traders, nice to meet you.
"Like" is a huge force for me.
By "following" you can always get new information quickly.
Thank you for always supporting me.
-------------------------------------------------- -----
Today's gap is 10950.0-10975.0. (Not shown on the chart.)
You need to see if you can get support at the uptrend line (2).
You also need to check that it fills the previous gap, 10815.0-10890.0.
If you sideways while receiving support from 10895.0-11230.0, I think there is a possibility that it will rise above the 10700.0 point in the near future.
It remains to be seen if there is a volatility that deviates from the uptrend line (2)-downtrend line (3) around September 23rd (September 22-24).
-------------------------------------------------- ------------
BAKKT Bitcoin (BTM1!) 1D chart
Today's gap is 11025.0-11050.0. (Not shown on the chart.)
It's not showing big changes.
We need to check if the closing price is generated at this point near the 11055.0 point.
If the closing price is generated at the current location, I think there is a possibility to touch the 11585.0 point or more next week.
You also have to watch to see if it moves to fill the previous gap.
You should also check for volatility that deviates from the downtrend line (3) and the uptrend line (1) during the rest of the time.
-------------------------------------------------- -------------------------------------------
** Check support, resistance, and abbreviation points.
** Support or resistance is based on the closing price of the 1D chart.
** All explanations are for reference only and do not guarantee profit or loss on investment.
Explanation of abbreviations displayed on the chart
R: A point or section of resistance that requires a response to preserve profits
S-L: Stop-Loss point or section
S: A point or segment that can be bought for generating profit as a support point or segment
(Short-term Stop Loss can be said to be a point where profits and losses can be preserved or additionally entered through installment trading. You must trade from a short-term investment perspective.)
GAP refers to the difference in prices that occurred when CME and BAKKT exchanges were closed because they do not trade 24 hours a day.
G1: closing price when closed
G2: The market price at the time of opening

BAKKT Bitcoin (BTM1!) - September 17Hello?
Dear traders, nice to meet you.
"Like" is a huge force for me.
By "following" you can always get new information quickly.
Thank you for always supporting me.
-------------------------------------------------- -----
Today's gap is 11087.5-11025.0.
We have to see if it will fill the previous gap, 10870.0-10900.0.
We also have to see if we can ascend beyond the 11055.0 point.
Departing from the short-term downtrend line (3), it is located near the closing price formed by a surge on July 27.
Therefore, I think the 11055.0 point makes sense.
If you get support at the 11055.0 point, I think there's a chance you'll be touching the 11585.0-11625.0 segment around September 24.
We have to watch for volatility around September 18 (September 17-19) that could deviate from the downtrend line (3)-the uptrend line (1).
-------------------------------------------------- ------
CME Bitcoin (BTC1!) 1D Chart
Today's gap is 11015.0-11045.0. (Not shown on the chart.)
It remains to be seen if it will fill the previous gap, 10815.0-10890.0.
You also need to see if you can get support at the uptrend line (2).
If you get support at the uptrend line (2), it's not far away that you are likely to climb above 11055.0 points and touch above 11230.0 points.
From its current position, the 10895.0-11230.0 section is in a more important position than any other section, and if it is supported and breaks through this section, it is expected to make a lot of gains.
-------------------------------------------------- -------------------------------------------
** Check support, resistance, and abbreviation points.
** Support or resistance is based on the closing price of the 1D chart.
** All explanations are for reference only and do not guarantee profit or loss on investment.
Explanation of abbreviations displayed on the chart
R: A point or section of resistance that requires a response to preserve profits
S-L: Stop-Loss point or section
S: A point or segment that can be bought for generating profit as a support point or segment
(Short-term Stop Loss can be said to be a point where profits and losses can be preserved or additionally entered through installment trading. You must trade from a short-term investment perspective.)
GAP refers to the difference in prices that occurred when CME and BAKKT exchanges were closed because they do not trade 24 hours a day.
G1: closing price when closed
G2: The market price at the time of opening

Graphique du cours du BTC trader a ChicagoLe cour du prix du BTC est dans son nuage daily, porté par la SSB actuellement a 10k8.
Le nuage hebdomadaire est haussier, projeté 26 périodes dans le futur, ici 26 semaines de 5 jours ouvrables dirais-je)
Mon SL remonte a mon prix d'entrée si je le souhaite pour sortir a mon prix d'entrée, soit c'est l'occasion de rentré avec un stop serré sous la SSB journalière.
Nous sommes a l’équilibre niveau momentum RSI
Pour rentrer avec un bon risk/reward (ratio gain/perte), c'est a vous de le calculer. Après le plus important c'est votre gestion du risque, vous pouvez vous servir ou non d'indicateur, si votre gestion n'est pas bonne,vous transpirez a tous les mouvement du marché.
Je vous conseilles c'est indicateur multi unité de temps (MTF ichimoku)
Bonne soirée a tous

BTCUSD Bitcoin | SWING - 16 Sep. 2020Hello my friend | Welcome Back.
Please support this idea with LIKE if you find it useful.
***
The house is poised to rise to $ 12,000 if broken, which could make it to higher levels.
***
Here is the full analysis for this pair, let me know in the comment section below if you have any questions, the entry will be taken only if all rules of the strategies will be satisfied. I suggest you keep this pair on your watchlist and see if the rules of your strategy are satisfied.
Remember this analysis is not 100% accurate No single analysis is To make a decision follow your own thoughts.
***
The information given is not a Financial Advice.
BTCUSD Apple GBPUSD EURUSD XAUUSD AUDUSD

CME Bitcoin (BTC1!) - Sep 16Hello?
Dear traders, nice to meet you.
"Like" is a huge force for me.
By "following" you can always get new information quickly.
Thank you for always supporting me.
-------------------------------------------------- -----
Today's gap is 10815.0-10890.0.
You need to see if you can get support at the uptrend line (2).
Also, we have to see if we can climb above the 10895.0 point.
If you decline at the uptrend line (2), you need to make sure you are getting support at 10670.0.
If you get support at 10460.0, I think there is a willingness to ascend.
If you climb to the 10895.0-11230.0 section and sideways, it is expected that you will have a good chance of ascent.
-------------------------------------------------- -------
(BAKKT Bitcoin (BTM1!) 1D Chart)
Today's gap is 10870.0-10900.0. (Not shown on the chart.)
You need to make sure you can get support at 10797.5.
Also, we have to see if we can ascend above the 11055.0 point.
If you get support at 11055.0, you can expect a lot of gains.
If you move down at 10797.5, you need to make sure you get support at 10622.5.
We need to see if we can get off the uptrend line (1) and downtrend line (3) around September 18th.
-------------------------------------------------- -------------------------------------------
** Check support, resistance, and abbreviation points.
** Support or resistance is based on the closing price of the 1D chart.
** All explanations are for reference only and do not guarantee profit or loss on investment.
Explanation of abbreviations displayed on the chart
R: A point or section of resistance that requires a response to preserve profits
S-L: Stop-Loss point or section
S: A point or segment that can be bought for generating profit as a support point or segment
(Short-term Stop Loss can be said to be a point where profits and losses can be preserved or additionally entered through installment trading. You must trade from a short-term investment perspective.)
GAP refers to the difference in prices that occurred when CME and BAKKT exchanges were closed because they do not trade 24 hours a day.
G1: closing price when closed
G2: The market price at the time of opening


BAKKT Bitcoin (BTM1!) - September 15Hello?
Dear traders, nice to meet you.
"Like" is a huge force for me.
By "following" you can always get new information quickly.
Thank you for always supporting me.
-------------------------------------------------- -----
Today's gap is between 10700.0-10692.5. (Not shown on the chart.)
It started to deviate from the downtrend line (3).
We'll have to see if we can get support by climbing above the 10797.5 point that was the previous gap point.
If it falls, we need to see if we can get support at 10622.5.
If you get support in the 10622.5-10797.5 range, I think there is a possibility of volatility around September 18th.
This volatility is expected to range beyond the downtrend line (3)-the uptrend line (1).
-------------------------------------------------- --------
CME Bitcoin (BTC1!) 1D Chart
Today's gap is 10705.0-10750.0. (Not shown on the chart.)
It is breaking through the uptrend line (2).
You need to see if you can get support at the uptrend line (2) and if you can climb along the trend line.
We must see if we can ascend to 10895.0-11230.0.
If it does not fall below the 10670.0 point, it is expected to rise.
-------------------------------------------------- -------------------------------------------
** Check support, resistance, and abbreviation points.
** Support or resistance is based on the closing price of the 1D chart.
** All explanations are for reference only and do not guarantee profit or loss on investment.
Explanation of abbreviations displayed on the chart
R: A point or section of resistance that requires a response to preserve profits
S-L: Stop-Loss point or section
S: A point or segment that can be bought for generating profit as a support point or segment
(Short-term Stop Loss can be said to be a point where profits and losses can be preserved or additionally entered through installment trading. You must trade from a short-term investment perspective.)
GAP refers to the difference in prices that occurred when CME and BAKKT exchanges were closed because they do not trade 24 hours a day.
G1: closing price when closed
G2: The market price at the time of opening

Graphique du cours du BTC trader a ChicagoSalut a tous, n'étant pas H24 devant les charts, et également ne parcourant pas toutes les unités de temps a chaque fois.
Ce graphique représente le cours du BTC du CME en unité de temps hebdomadaire.
La dernière cloture en toupie posée sur la trend ligne mensuel attrapant les points les plus haut depuis le sommet historique, pullback propre après la cassure de cette trendline mensuel je le rappel. Cependant la dernière bougie n’étant pas clôturée, tenons la a l’œil
On constate également le role de la chikou qui a exactement rencontrée resistance sous la trendline.
Actuellement, la zone du point haut de février est travaillé, plus haut post krach covid et ca chute de 60%.
A suivre...
Sur ce portez vous bien.


CME Bitcoin (BTC1!) - Sep 10 (1W)Hello?
Dear traders, nice to meet you.
"Like" is a huge force for me.
By "following" you can always get new information quickly.
Thank you for always supporting me.
-------------------------------------------------- -----
Today's gap is 10320.0-10285.0.
We must see if we can ascend to the previous gap segment of 10620.0-10425.0.
The 10460.0 point is shown to act as a division between an uptrend and a downtrend.
You need to see if you can get support at 10305.0 and climb above 10460.0.
If you get support above the 10670.0 point or above the uptrend line (2), there is a chance of further upside.
If it falls, it remains to be seen if it can gain support and rise in the 9615.0-9925.0 gap.
-------------------------------------------------- ----------
Due to personal circumstances, the time to publish the chart is likely to change by about two months. (14:00-18:00 (UTC+9))
I apologize to those who have consistently watched during my posting time.
-------------------------------------------------- -------------------------------------------
** Check support, resistance, and abbreviation points.
** Support or resistance is based on the closing price of the 1D chart.
** All explanations are for reference only and do not guarantee profit or loss on investment.
Explanation of abbreviations displayed on the chart
R: A point or section of resistance that requires a response to preserve profits
S-L: Stop-Loss point or section
S: A point or segment that can be bought for generating profit as a support point or segment
(Short-term Stop Loss can be said to be a point where profits and losses can be preserved or additionally entered through installment trading. You must trade from a short-term investment perspective.)
GAP refers to the difference in prices that occurred when CME and BAKKT exchanges were closed because they do not trade 24 hours a day.
G1: closing price when closed
G2: The market price at the time of opening

BTC1! small cme gap closeddon't expect the lower cme gap at 9.6k to be closed even if there is a small pullback.

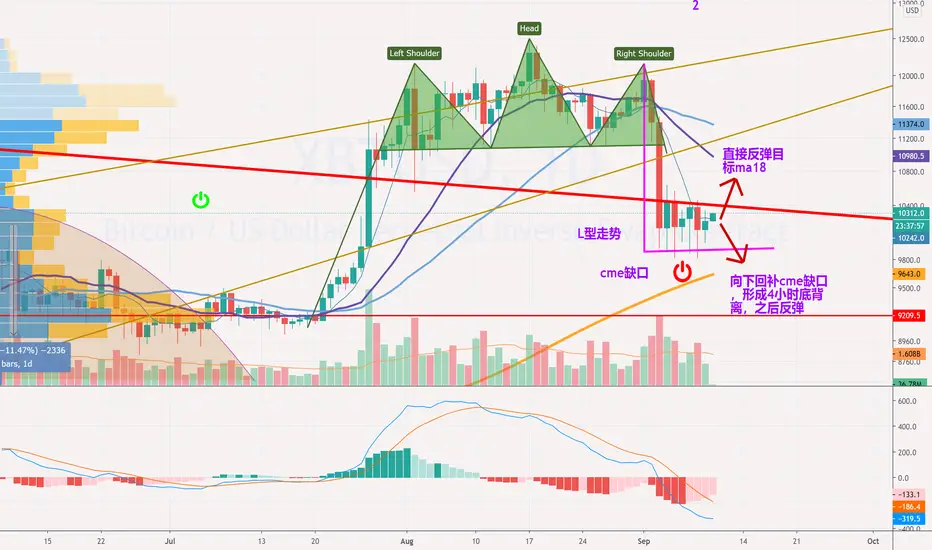
Classic L-shaped trend - how bitcoinBitcoin fell sharply after it formed its head and shoulders. In fact, the history of the formation of the head and shoulder, the success rate is not high, we see the June arc top ended in failure. But this time it seems very standard, and in the surrounding market has not yet appeared before a sharp decline in the formation of shorts should be considered very bold.
It also confirms the logic that Bitcoin did not follow the U.S. stock, but the U.S. stock followed the bitcoin.
After the plunge, the L pattern was formed, which is bitcoin's most classic pattern. I've written articles about it before.
L-type trend, up and up the chance is actually equal. It doesn't make much sense to judgment. It is important to grasp the opportunities after the trend has been formed.
1, direct upward breakthrough, because of the moving average pressure, so ma18 may be blocked, unless it is a bull market, otherwise the rebound is not optimistic.
2, go down, it is possible to form a 4-hour bottom departure, because the daily line ma144 is below, while the CME gap at $9665, if the gap will also produce a rebound momentum. So form the bottom signal down, rebound, should be a better opportunity.
Recommendation: Although it is possible to form a bottom-off opportunity, but do not run away, the probability of failure also has, so pay attention to the right-hand entry strategy.
BTC1! bounced off the gapdid not fill it and produced a 4H bullish hammer. I suspect it will go up to retest previous support at the 4H 200ema before closing the gap. Or it can be nice and wick and close it.

CME Bitcoin (BTC1!) - Sep 9Hello?
Dear traders, nice to meet you.
"Like" is a huge force for me.
By "following" you can always get new information quickly.
Thank you for always supporting me.
-------------------------------------------------- -----
Today's gap is 10015.0-10060.0. (Not shown on the chart.)
We need to make sure we can get support at point 9925.0.
If it falls from 9925.0, it is likely to fill the gap between 9615.0-9925.0.
We must see if there is an ascent to fill the previous gap, 1062.0-10425.0.
It remains to be seen which of the short-term downtrend lines (1) and uptrend lines (2) will be broken.
-------------------------------------------------- -------------------------------------------
** Check support, resistance, and abbreviation points.
** Support or resistance is based on the closing price of the 1D chart.
** All explanations are for reference only and do not guarantee profit or loss on investment.
Explanation of abbreviations displayed on the chart
R: A point or section of resistance that requires a response to preserve profits
S-L: Stop-Loss point or section
S: A point or segment that can be bought for generating profit as a support point or segment
(Short-term Stop Loss can be said to be a point where profits and losses can be preserved or additionally entered through installment trading. You must trade from a short-term investment perspective.)
GAP refers to the difference in prices that occurred when CME and BAKKT exchanges were closed because they do not trade 24 hours a day.
G1: closing price when closed
G2: The market price at the time of opening

CME Bitcoin (BTC1!) - September 7Hello?
Dear traders, nice to meet you.
"Like" is a huge force for me.
By "following" you can always get new information quickly.
Thank you for always supporting me.
-------------------------------------------------- -----
Today's gap is 10620.0-10425.0.
Make sure you can get support above the 10460.0 point.
We need to watch for movement to fill the previous gap, 9615.0-9925.0.
We need to see if we can get support at 10305.0 and move above 10670.0 to fill today's gap.
It remains to be seen that around September 8th (September 7-9) it is possible to deviate from the downtrend line (1) to the uptrend line (2) (9180.0-10670.0).
-------------------------------------------------- -------------------------------------------
** Check support, resistance, and abbreviation points.
** Support or resistance is based on the closing price of the 1D chart.
** All explanations are for reference only and do not guarantee profit or loss on investment.
Explanation of abbreviations displayed on the chart
R: A point or section of resistance that requires a response to preserve profits
S-L: Stop-Loss point or section
S: A point or segment that can be bought for generating profit as a support point or segment
(Short-term Stop Loss can be said to be a point where profits and losses can be preserved or additionally entered through installment trading. You must trade from a short-term investment perspective.)
GAP refers to the difference in prices that occurred when CME and BAKKT exchanges were closed because they do not trade 24 hours a day.
G1: closing price when closed
G2: The market price at the time of opening

Look Out Below ! CME/BTC1! #cmefutures #bitcoin #CME $BTCWell after that Bitcoin dump the other day many are speculating " How low can this go ? " Well there is still a CME BTC futures gap below us on the daily CME BTC1! chart . Can you see above where I have placed the purple arrows on the chart ? That is the gap right there . It's between 9925 - and - 9670 and so we do need to go down there and fill this gap at some point . This gap has been there since late July but since Bitcoin has already gone below 10k today it is highly speculated that we will go down to mid 9k region at least to fill this futures gap . Possibly we go a bit lower too . Will it happen this weekend ? No , because the CME Futures are closed on weekends and Monday September 7th is a holiday in the USA and banks are closed so probably it has to wait until at least Tuesday .
I still expect BTC to hit 14k this year , possibly more , but it seems like we will fill this gap first before we continue on up .
Have a great weekend !


CME Bitcoin (BTC1!) - Sep 4Hello?
Dear traders, nice to meet you.
"Like" is a huge force for me.
By "following" you can always get new information quickly.
Thank you for always supporting me.
-------------------------------------------------- -----
Today's gap range is 10720.0-10780.0.
We need to see if we can get support at 10670.0 by around September 8.
It remains to be seen if it can rise after around September 8th along the uptrend line (1).
Since it fell in the 10895.0-11230.0 range, it can be said that it is out of the uptrend.
We'll also see if we can get support at 10670.0 and quickly climb to 10895.0-11230.0.
If you fall from the uptrend line (1), I think it's a good idea to do minimal split trading to preserve profit and loss.
--------------------------------------------------
I think it is necessary to carefully check the BTC price flow around September 4 (September 3-5) as seen in the XBTUSD chart.
-------------------------------------------------- -------------------------------------------
** Check support, resistance, and abbreviation points.
** Support or resistance is based on the closing price of the 1D chart.
** All explanations are for reference only and do not guarantee profit or loss on investment.
Explanation of abbreviations displayed on the chart
R: A point or section of resistance that requires a response to preserve profits
S-L: Stop-Loss point or section
S: A point or segment that can be bought for generating profit as a support point or segment
(Short-term Stop Loss can be said to be a point where profits and losses can be preserved or additionally entered through installment trading. You must trade from a short-term investment perspective.)
GAP refers to the difference in prices that occurred when CME and BAKKT exchanges were closed because they do not trade 24 hours a day.
G1: closing price when closed
G2: The market price at the time of opening


Bitcoin CME GAP | Weekly SupportBitcoin crashing hard and there is huge chance for cme gap to filled around 9600.
we also made breakout and this one will be retest at the cme gap healthy and good correction we are heading now
