Bitcoin Correction Maturing – Long Setup Brewing!Bitcoin ( BINANCE:BTCUSDT ) has fallen by more than -4% over the past day.
Let's take a look at the reasons for the decline.
One of the key reasons behind Bitcoin’s decline in the past 24 hours ( July 25 ) could be the reduced likelihood of Jerome Powell being replaced as Chair of the Federal Reserve.
In recent days, market participants were speculating that Donald Trump might replace Powell — a scenario that was considered bullish for risk assets like Bitcoin. However, recent reports of a meeting between Trump and Powell, and signs that Powell might not be dismissed, have weakened this fundamental narrative.
This meeting may signal a truce or reduced tension between Trump’s team and Powell , which could imply a continuation of current Fed policies. That’s bad news for Bitcoin, as it removes a potential psychological tailwind from the market and dampens speculative sentiment.
As a result:
Over $500 million in liquidations(Long Positions) occurred
Weak inflows into Bitcoin ETFs
A stronger U.S. Dollar Index ( TVC:DXY )
And declining Gold( OANDA:XAUUSD ) prices over the past two days
all added additional selling pressure on BTC. Now let's take a look at Bitcoin's conditions on the 4-hour time frame .
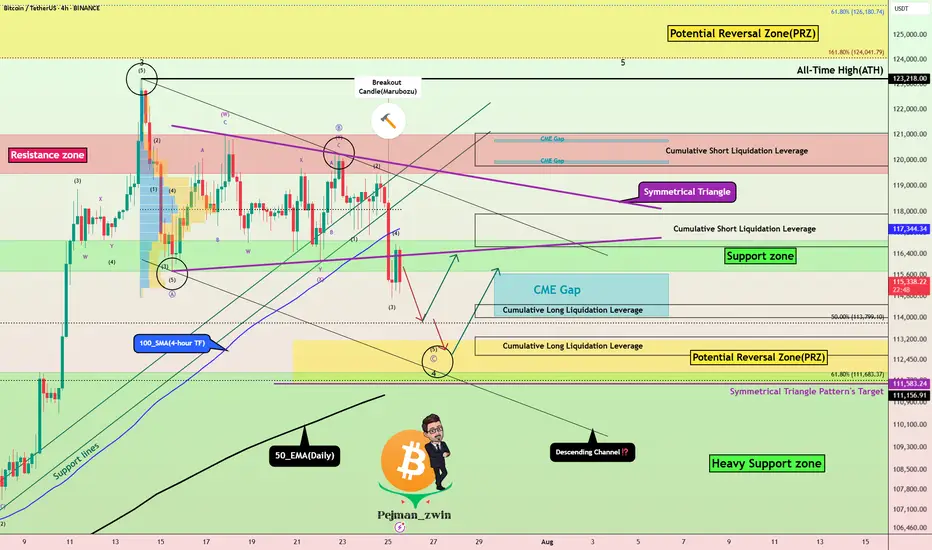
Bitcoin currently appears to have broken the Support zone($116,900-$115,730) , Support lines , 100_SMA(4-hour TF) , and the lower line of the Symmetrical Triangle Pattern with a bearish Marubozu candle .
Note : In general, trading was difficult when Bitcoin was inside a symmetrical triangle (about 10 days).
It also seems that the pullback to these zones has ended and Bitcoin is waiting for the next decline .
In terms of Elliott Wave theory , Bitcoin appears to be completing microwave 5 of microwave C of major wave 4 . There is a possibility that main wave 4 will create a descending channel and complete at the bottom of the descending channel (at Potential Reversal Zone(PRZ) ).
I expect Bitcoin to start rising again after completing the CME Gap($115,060-$114,947) from Cumulative Long Liquidation Leverage($114,480-$114,000) or Cumulative Long Liquidation Leverage($113,284-$112,603) near the PRZ and Heavy Support zone($111,980-$105,820) .
Cumulative Short Liquidation Leverage: $117,904-$116,665
Cumulative Short Liquidation Leverage: $121,046-$119,761
Do you think Bitcoin has entered a major correction, or does it still have a chance to create a new ATH?
Please respect each other's ideas and express them politely if you agree or disagree.
Bitcoin Analyze (BTCUSDT), 4-hour time frame.
Be sure to follow the updated ideas.
Do not forget to put a Stop loss for your positions (For every position you want to open).
Please follow your strategy and updates; this is just my Idea, and I will gladly see your ideas in this post.
Please do not forget the ✅' like '✅ button 🙏😊 & Share it with your friends; thanks, and Trade safe.
Btcanalysis
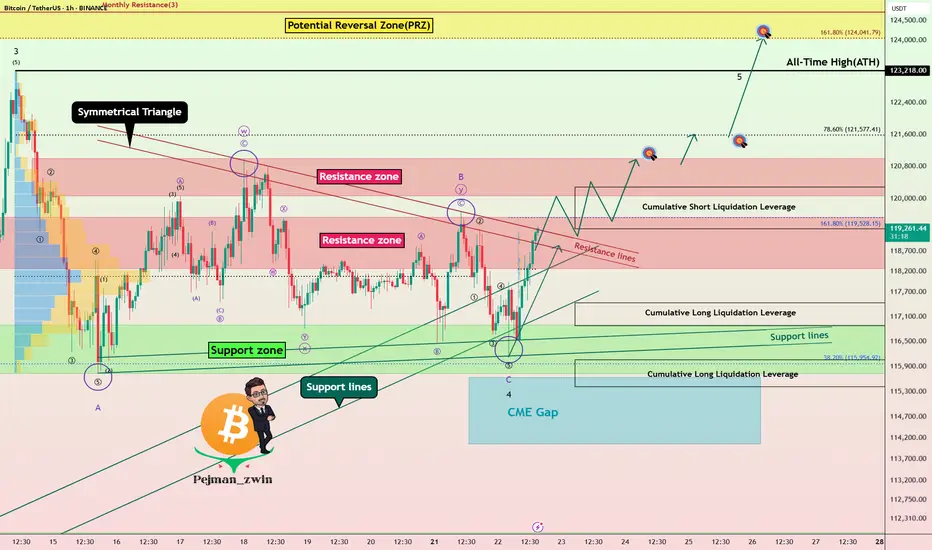
Powell’s Comments Could Decide BTC’s Fate: New ATH or Rejection!Bitcoin ( BINANCE:BTCUSDT ) has attacked the Support zone($116,900-$115,730) several times over the past week but failed to break through, meaning that buyers are still hoping for a BTC increase or even a new All-Time High(ATH) .
Bitcoin has reached a Resistance zone($119,530-$118,270) again and is trying to break the upper lines of the Symmetrical Triangle Pattern . The Cumulative Short Liquidation Leverage($117,255-$116,675) is important and includes high sell orders , so if Bitcoin can break the Resistance zone($119,530-$118,270) and the Resistance lines with high momentum , we can hope for a continuation of the upward trend.
Whether or not the Resistance zone($119,530-$118,270) and the Resistance lines break could depend on the tone of Jerome Powell’s speech today .
Jerome Powell will speak at the opening of the “ Integrated Review of the Capital Framework for Large Banks ” — the final major appearance before the Federal Reserve enters its pre-meeting blackout period.
Market Expectations:
The speech is officially about regulatory frameworks (like Basel III), but traders are watching closely for any hints regarding interest rate policy. Even indirect comments could move risk assets like BTC.
Rate Cut Signals?
With political pressure mounting (including criticism from Trump ) and markets pricing in a potential cut later this year, Powell may adopt a cautious, data-dependent tone emphasizing flexibility in decision-making.
--------------------
In terms of Elliott Wave theory , it seems that the wave structure of the main wave 4 correction is over. The main wave 4 has a Zigzag Correction(ABC/5-3-5) , so that the microwave B of the main wave 4 has a Double Three Correction(WXY) . Of course, the breakdown of the Resistance zone($119,530-$118,270) and Resistance lines can confirm the end of the main wave 4 .
Also, there is a possibility that the 5th wave will be a truncated wave because the momentum of the main wave 3 is high , and Bitcoin may NOT create a new ATH and the main wave 5 will complete below the main wave 3.
I expect Bitcoin to rise to at least the Resistance zone($121,000-$120,070) AFTER breaking the Resistance zone($119,530-$118,270) and Resistance lines .
Second Target: $121,620
Third Target: $123,820
Note: Stop Loss(SL)= $117,450
CME Gap: $115,060-$114,947
Cumulative Long Liquidation Leverage: $117,429-$116,878
Cumulative Long Liquidation Leverage: $116,053-$115,411
Please respect each other's ideas and express them politely if you agree or disagree.
Bitcoin Analyze (BTCUSDT), 1-hour time frame.
Be sure to follow the updated ideas.
Do not forget to put a Stop loss for your positions (For every position you want to open).
Please follow your strategy and updates; this is just my Idea, and I will gladly see your ideas in this post.
Please do not forget the ✅' like '✅ button 🙏😊 & Share it with your friends; thanks, and Trade safe.
BTC New Upodate (4H)This analysis is an update of the analysis you see in the "Related publications" section
We previously stated that Bitcoin lacks the strength to move upward, and we expect the price to soon reach the green zone (114K-112K).
The price is now dropping toward this zone, which is the rebuy area.
The process of reaching the green zone has been and still is somewhat time-consuming, and during this time, it may repeatedly mislead beginners.
For risk management, please don't forget stop loss and capital management
Comment if you have any questions
Thank You

BTC Exhaustion Zone Upper Wick Rejection Candle 🔶 (Orange Circle)
🔍 Candle Breakdown | July 14, 2025
• Opened near the lows
• Rallied intraday to $123K (ATH)
• Closed well off the highs, just above $119K
• Long upper wick = rejection of higher prices
• Elevated volume = signal is valid, not noise
🧠 Translation: Bulls charged into resistance. Sellers didn’t flinch — absorbed the move and slammed price back down. The result? “Exhaustion Candle.”
📦 Exhaustion Zone (Purple Box)
This is the real battlefield. If BTC fails to close above 119.5K by Friday, we likely get Manipulation over the weAkend:
🔄 Chop & Range Behavior
• Consolidation between ~115K support and ~120K resistance
• Classic pause before either expansion or collapse
🔻 Retrace Scenarios
• 21 EMA at $113K
• Breakout retest near $111K
💡 If we close the weAk closer to $111K than $125K… gravity’s working in favor of the HIGH powered short Zone again!
MMM still sTRONg — but without a decisive breakout above $125K, I might just be dancing with the market makers for once.
🧘♂️ Breathe in. Kill the ego. sTAY sHARP. Execute.
100% not financial advice, for edutainment purposes only!

Bitcoin Technical Setup: Support Holds, Wave 5 in FocusBitcoin ( BINANCE:BTCUSDT ) filled the CME Gap($117,255-$116,675) and started to rise, as I expected in my previous idea .
Bitcoin is currently trying to break the Resistance zone($119,530-$118,270) . In the last week's movement, the price of $118,000 can be considered as one of the most important numbers for Bitcoin , with a lot of trading volume around this price.
In terms of Elliott Wave theory , it seems that Bitcoin has managed to complete the main wave 4 near the Support zone($116,900-$115,730) and Support lines . The structure of the main wave 4 is a Zigzag Correction(ABC/5-3-5) (so far). There is a possibility that the 5th wave will be a truncated wave because the momentum of the main wave 3 is high and Bitcoin may NOT create a new ATH and the main wave 5 will complete below the main wave 3.
I expect Bitcoin to start rising near the Potential Reversal Zone(PRZ) and Cumulative Long Liquidation Leverage($118,277-$118,033) , break the Resistance zone($119,530-$118,270) and reach the targets I have marked on the chart.
Note: Stop Loss(SL)= $116,960
CME Gap: $115,060-$114,947
Cumulative Short Liquidation Leverage: $121,502-$121,134
Cumulative Short Liquidation Leverage: $120,612-$119,783
Cumulative Long Liquidation Leverage: $116,810-$115,522
Do you think Bitcoin can create a new ATH again?
Please respect each other's ideas and express them politely if you agree or disagree.
Bitcoin Analyze (BTCUSDT), 1-hour time frame.
Be sure to follow the updated ideas.
Do not forget to put a Stop loss for your positions (For every position you want to open).
Please follow your strategy and updates; this is just my Idea, and I will gladly see your ideas in this post.
Please do not forget the ✅' like '✅ button 🙏😊 & Share it with your friends; thanks, and Trade safe.

Bitcoin Technical Setup: Support Holds, Eyes on $118,600Bitcoin ( BINANCE:BTCUSDT ) moved as I expected in the previous ideas and finally completed the CME Gap($117,255-$116,675) in the last hours of the week. ( First Idea _ Second Idea )
Before starting today's analysis, it is important to note that trading volume is generally low on Saturday and Sunday , and we may not see a big move and Bitcoin will move in the range of $121,000 to $115,000 ( in the best case scenario and if no special news comes ).
Bitcoin is currently trading near the Support zone($116,900-$115,730) , Cumulative Long Liquidation Leverage($116,881-$115,468) , Potential Reversal Zone(PRZ) , and Support lines .
According to Elliott Wave theory , Bitcoin had a temporary pump after the " GENIUS stablecoin bill clears House and heads to Trump's desk " news, but then started to fall again, confirming the end of the Zigzag Correction(ABC/5-3-5) . Now we have to wait for the next 5 down waves or the corrective waves will be complicated .
I expect Bitcoin to rebound from the existing supports and rise to at least $118,600 . The second target could be the Resistance lines .
Do you think Bitcoin will fill the CME Gap($115,060-$114,947) in this price drop?
Cumulative Short Liquidation Leverage: $121,519-$119,941
Do you think Bitcoin can create a new ATH again?
Note: Stop Loss(SL)= $114,700
Please respect each other's ideas and express them politely if you agree or disagree.
Bitcoin Analyze (BTCUSDT), 15-minute time frame.
Be sure to follow the updated ideas.
Do not forget to put a Stop loss for your positions (For every position you want to open).
Please follow your strategy and updates; this is just my Idea, and I will gladly see your ideas in this post.
Please do not forget the ✅' like '✅ button 🙏😊 & Share it with your friends; thanks, and Trade safe.

Bitcoin is still bullish (4H)Bitcoin appears to be in a dual bullish structure, currently in the second bullish phase following wave X.
Considering the expansive nature of the correction in the second pattern, it seems we are within an expanding triangle or a diametric structure.
Based on the duration of wave C, it appears that the bullish wave of the second structure is not yet complete.
We expect such fluctuations for Bitcoin in the coming period.
A daily candle close below the invalidation level would invalidate this outlook.
For risk management, please don't forget stop loss and capital management
Comment if you have any questions
Thank You

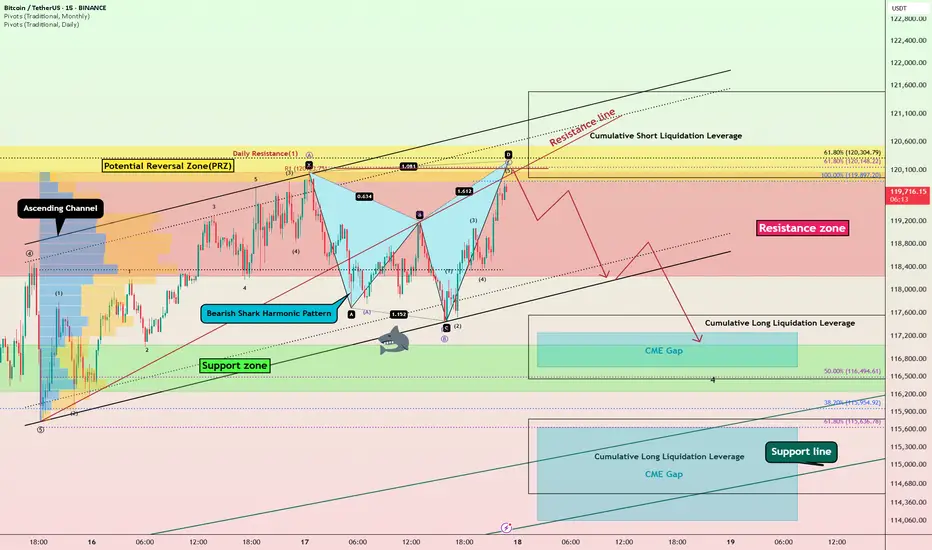
Bitcoin Bearish Shark Detected – CME Gap Below $115K in Sight?Today's analysis is on the 15-minute timeframe , following the previous analysis I shared with you on the 1-hour timeframe .
Bitcoin ( BINANCE:BTCUSDT ) is currently trading in the Resistance zone($120,100-$118,240) near the Potential Reversal Zone(PRZ) and Cumulative Short Liquidation Leverage($121,490-$119,965) .
From a technical perspective , it looks like Bitcoin is completing the Bearish Shark Harmonic Pattern on the 15-minute timeframe .
From an Elliott wave theory perspective, it looks like Bitcoin is completing the microwave 5 of wave C of the Zigzag Correction(ABC/5-3-5) .
I expect Bitcoin to start falling from the top of the ascending channel and at least decline to the lower line of the descending channel, and if the ascending channel breaks this time, we should wait for the CME Gap($117,255-$116,675)/CME Gap($115,060-$114,947) to fill.
Cumulative Long Liquidation Leverage: $117,556-$116,465
Cumulative Long Liquidation Leverage: $115,773-$114,513
Do you think Bitcoin can create a new ATH again?
Note: Stop Loss(SL)= $121,620
Please respect each other's ideas and express them politely if you agree or disagree.
Bitcoin Analyze (BTCUSDT), 15-minute time frame.
Be sure to follow the updated ideas.
Do not forget to put a Stop loss for your positions (For every position you want to open).
Please follow your strategy and updates; this is just my Idea, and I will gladly see your ideas in this post.
Please do not forget the ✅' like '✅ button 🙏😊 & Share it with your friends; thanks, and Trade safe.
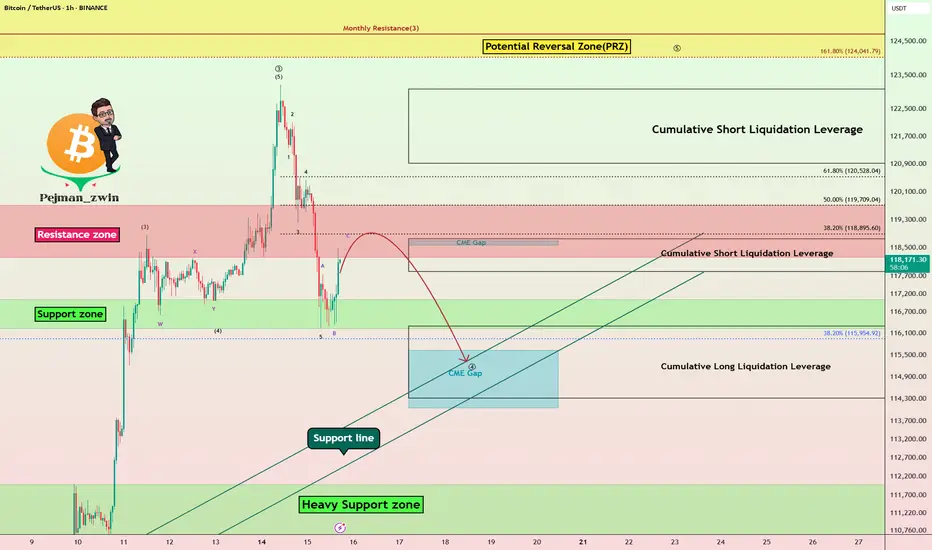
Bitcoin Struggles Below $120K:Will the CME Gap Pull Price Lower?Bitcoin ( BINANCE:BTCUSDT ) has been experiencing a high momentum bullish trend in recent days, which few people expected, especially when it crossed $120,000 . However, in the past 24 hours , Bitcoin has fallen back below $120,000 .
Bitcoin is currently trading in the Resistance zone($119,720-$118,240) and Cumulative Short Liquidation Leverage($118,757-$117,829) on the 1-hour time frame .
In terms of Elliott Wave theory , Bitcoin appears to be completing a main wave 4 . Main wave 4 is likely to have a Zigzag Correction(ABC/5-3-5) .
I expect Bitcoin to attack the Support lines and fill the CME Gap($115,060-$114,947) in the next hour.
Cumulative Short Liquidation Leverage: $123,087-$120,922
Cumulative Long Liquidation Leverage: $116,305-$114,325
Do you think Bitcoin can create a new ATH again?
Note: Stop Loss(SL)= $121,000
Please respect each other's ideas and express them politely if you agree or disagree.
Bitcoin Analyze (BTCUSDT), 1-hour time frame.
Be sure to follow the updated ideas.
Do not forget to put a Stop loss for your positions (For every position you want to open).
Please follow your strategy and updates; this is just my Idea, and I will gladly see your ideas in this post.
Please do not forget the ✅' like '✅ button 🙏😊 & Share it with your friends; thanks, and Trade safe.
BTC Bottom & New ATH..... when ?!!! Hello Guys
There are some notes of BTC weekly Chart:
1. We have a new ATH every 4 years ( 1428-1477 ) days..
2. After the ATH we take about ( 52-59 ) weeks to make a new bottom then we go up a little ...
3. Every time we reach a new ATH we drop down in a same angle (-55) before the new bull run starting .... look at my chart ( Red angles and curves ):
****** We dropped from ATH 2013 to Bottom 2015 by an angle ( -55 ) .
****** We dropped from ATH 2017 to Bottom 2018 by an angle ( -55 ) .
****** Same (24 July 2019) we dropped from local top to the local bottom by Angle ( -56 ) .
****** Will we drop from ATH 2021 to Bottom (2022 - 2023) by the same angle ( -55 or -56 )??
4. In my opinion , I expect we will reach the final bottom between ( 26 December 2022 : 6 march 2023 ).
5. I don't care what will be the price of BTC then , but I care only for when will be the possible bottom !!.
But if we can try to expect the price it will be in a range of ( 11900 : 9000$) ...
Note:( 10K - 10500$) is very very strong demand area for BTC .
-------------------------------------------------------------------------------------------------------------------------------------------------------------------------------------------------------
Finally , I think the new ATH will not be before Nov 2025 ( 150k $ ).
It is not a financial advice , I am only share my thoughts with u :)
Thank u and good luck.

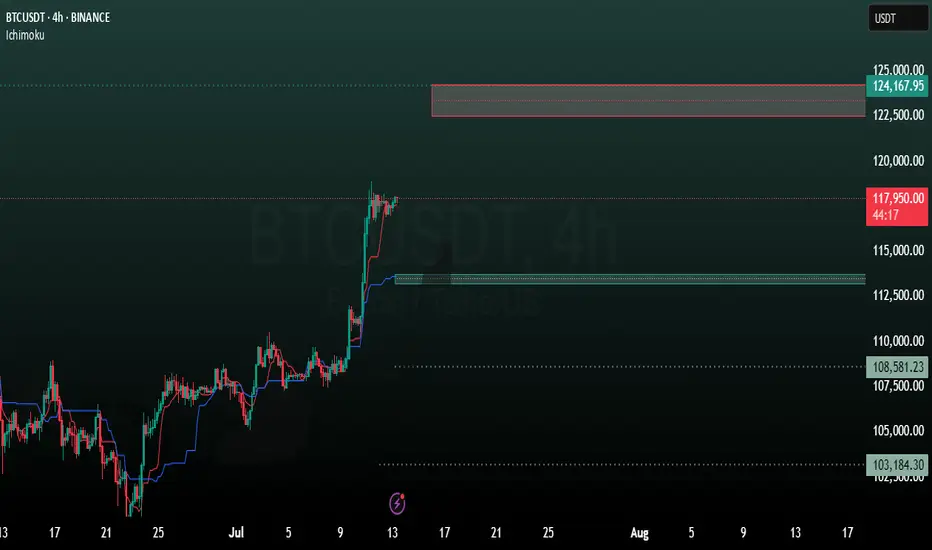
BTC 4H analysisBased on our previous analysis, BTC trend is still bullish. It reacts to our mentioned support level (98699) and moving to new resistance levels.
ICHIMOKU shows these levels as resistance:
122500
124000
137000
And these as support:
113788
113181
108581
Bitcoin Hits New ATH – Is It Time to Short?Bitcoin ( BINANCE:BTCUSDT ) managed to form a new All-Time High(ATH) in the previous one-hour candles .
Do you think Bitcoin can create a new ATH in the coming hours?
Bitcoin is currently trying to break the Heavy Resistance zone($110,720-$105,820) . It has also penetrated the Potential Reversal Zone(PRZ) and Cumulative Short Liquidation Leverage($114,910-$113,850) .
In terms of Elliott wave theory , it seems that the 5 impulsive waves that Bitcoin started in the last 3 days can be completed above the ascending channel and PRZ .
Also, we can see the Regular Divergence(RD-) between Consecutive Peaks.
I expect Bitcoin to drop to at least Cumulative Long Liquidation Leverage($111,563-$110,947) . At least the price zone Bitcoin is in at the time of publishing this analysis is better for short positions , even if the Stop Loss(SL) is touched .
Note: Stop Loss(SL)= $115,023
Please respect each other's ideas and express them politely if you agree or disagree.
Bitcoin Analyze (BTCUSDT), 1-hour time frame.
Be sure to follow the updated ideas.
Do not forget to put a Stop loss for your positions (For every position you want to open).
Please follow your strategy and updates; this is just my Idea, and I will gladly see your ideas in this post.
Please do not forget the ✅' like '✅ button 🙏😊 & Share it with your friends; thanks, and Trade safe.

Bitcoin Roadmap=>End of RallyBitcoin ( BINANCE:BTCUSDT ) has gained nearly +10% in the recent weekly candle so far. The question is where this rally could end up. So to get to that zone, let’s go to the weekly timeframe .
Before we start this analysis, let’s take a look at my last analysis on the weekly timeframe , which was well into the Potential Reversal Zone(PRZ) . ( Analysis time: 9 JUN 2025 )
Bitcoin has now entered the Potential Reversal Zone(PRZ) and Time Reversal Zone(TRZ=June 23 to August 4) , and these zones could be the zones where this Bitcoin rally will end. Do you agree with me?
In terms of Elliott Wave theory , Bitcoin appears to be completing a main wave 5 , as the main wave 3 was an extended wave . The main wave 5 could end at the Potential Reversal Zone(PRZ) .
I expect Bitcoin to start a main correction from the Potential Reversal Zone(PRZ) and could continue to support lines and near the $105(at least) .
What do you think about the end of the Bitcoin rally?
Note: Sell orders near $120,000 are very heavy.
Note: Cumulative Long Liquidation Leverage attractive volume for liquidation.
Note: If Bitcoin goes above $130,000, it can continue to rise to the Resistance lines (near $150,000).
Please respect each other's ideas and express them politely if you agree or disagree.
Bitcoin Analyze (BTCUSDT), weekly time frame.
Be sure to follow the updated ideas.
Do not forget to put a Stop loss for your positions (For every position you want to open).
Please follow your strategy and updates; this is just my Idea, and I will gladly see your ideas in this post.
Please do not forget the ✅' like '✅ button 🙏😊 & Share it with your friends; thanks, and Trade safe.

Bitcoin’s Final Wave & Time Reversal Zone _ New ATH Loading?Today, I want to analyze Bitcoin ( BINANCE:BTCUSDT ) on the weekly time frame and answer these questions :
Can Bitcoin create a new All-time High(ATH) or not!?
At what price range can Bitcoin's uptrend end!?
When can we expect the uptrend to end!?
Please stay with me.
Bitcoin appears to have managed to break the Resistance lines , although we saw a fake break a few months ago , and it also appears to have a Hammer Candlestick Pattern in the previous weekly candle , which could signal the completion of Bitcoin's pullback to the Resistance lines(broken).
In terms of time , if we want to analyze the Bitcoin chart and look at Bitcoin's past, in general, the months of June(Average=-0.13%/Median=+2.20%) and especially July(Average=+7.56%/Median=+8.90%) have been among the most productive months for Bitcoin , and the months of August(Average=+1.75%/Median=-8.04%) and September(Average=-3.77%/Median=-4.35%) were the months when Bitcoin had a correction . Technical analysis tools show the end of the upward trend and the beginning of Bitcoin's correction at the Time Reversal Zone(TRZ=June 23 to August 4) .
In terms of Elliott Wave theory , Bitcoin appears to be completing the main wave 5 , as the main wave 3 was extended .
I expect Bitcoin to trend higher(+10%) in the coming weeks and create a new ATH . New ATH could be created in the Potential Reversal Zone(PRZ) and TRZ , and then we can wait for the start of the main correction .
What do you think about Bitcoin’s future movement? Can Bitcoin create a new ATH? When and at what price?
Note: If Bitcoin falls below $100,000, we should expect further declines.
Please respect each other's ideas and express them politely if you agree or disagree.
Bitcoin Analyze (BTCUSDT), weekly time frame.
Be sure to follow the updated ideas.
Do not forget to put a Stop loss for your positions (For every position you want to open).
Please follow your strategy and updates; this is just my Idea, and I will gladly see your ideas in this post.
Please do not forget the ✅' like '✅ button 🙏😊 & Share it with your friends; thanks, and Trade safe.

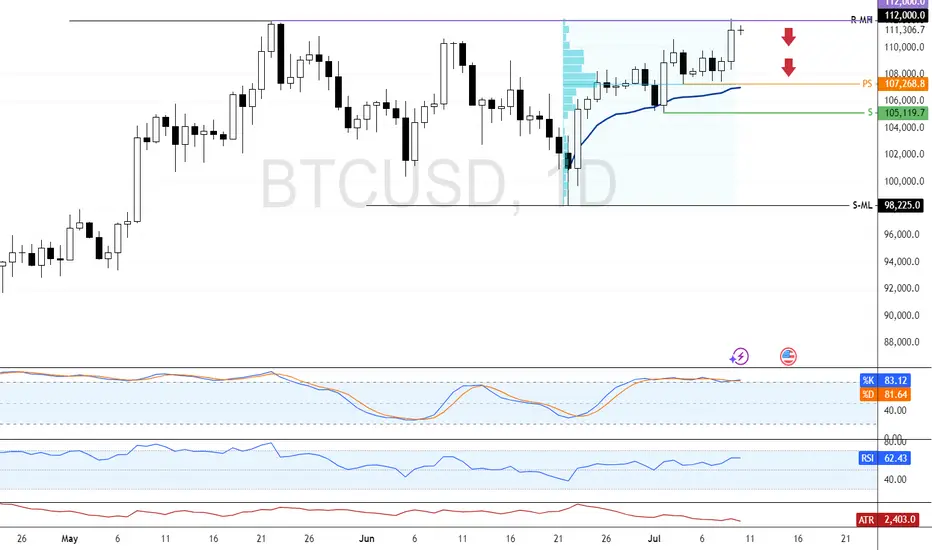
Bitcoin Tests Record High as Momentum FadesBitcoin is bullish, testing the all-time high at $112,000.0. Stochastic shows an overbought reading of 83.0, indicating momentum may stall.
As of now, BTC trades slightly below this level. Since it's the first test of $112,000.0, consolidation could follow. If bulls fail to break higher, price may dip toward $107,268 and $105,119.0 supports.
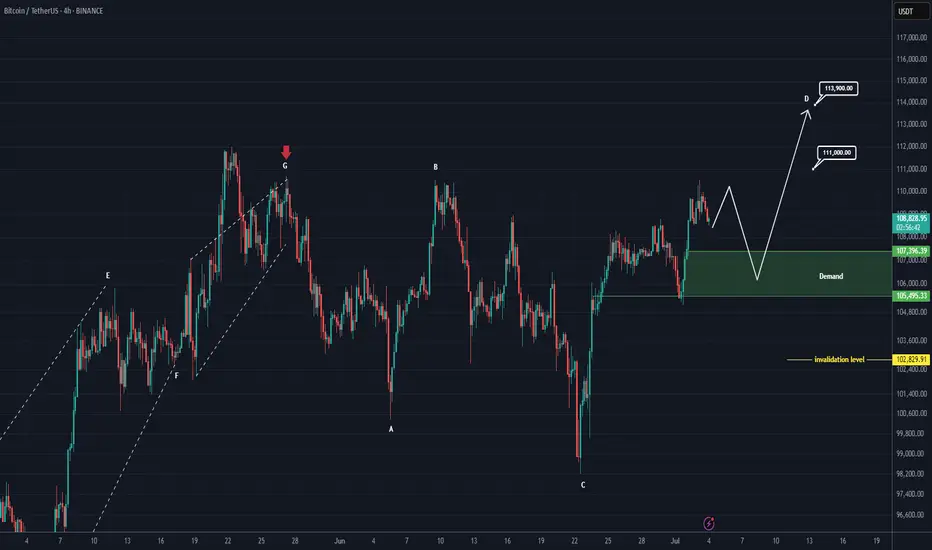
Bitcoin New Update (4H)This analysis is an update of the analysis you see in the "Related publications" section
If we were to publish an update for Bitcoin, wave D could move toward higher levels.
After hitting the green zone and gaining momentum, it could once again move upward to liquidate short positions.
In this update, we've naturally raised and revised the invalidation level.
The new targets have been marked on the chart.
A daily candle closing below the invalidation level would invalidate this analysis.
For risk management, please don't forget stop loss and capital management
Comment if you have any questions
Thank You
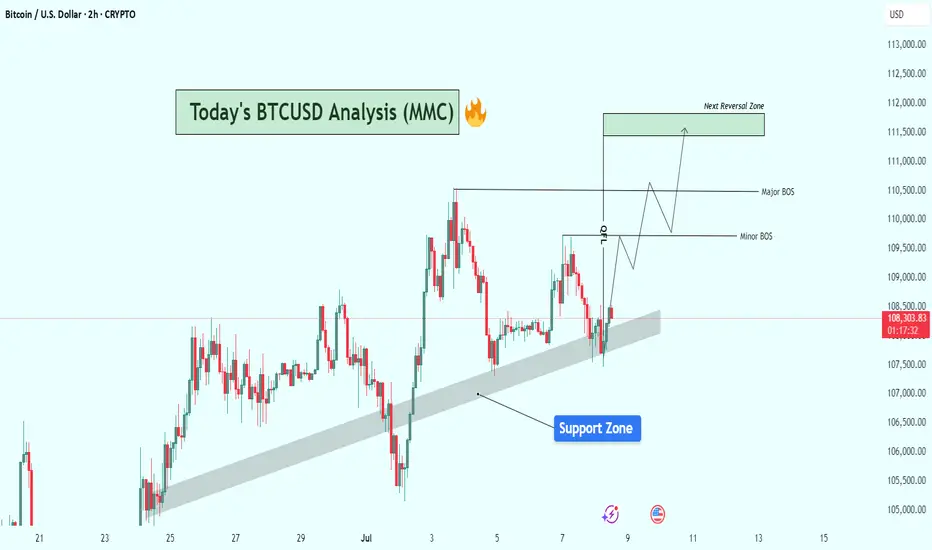
BTCUSD Structure Analysis : Bullish Zone From Support + Target🔍 Current Market Structure Overview:
Bitcoin is currently trading around $108,375, hovering just above a clearly respected rising support zone (shaded area). This dynamic support has held price multiple times and continues to act as a springboard for short-term bullish moves.
The chart illustrates a classic bullish continuation setup forming, with key structural levels marked as Minor BOS (Break of Structure) and Major BOS, indicating potential areas of trend validation and momentum acceleration.
🔹 Key Technical Elements:
✅ Support Zone:
The shaded diagonal support zone has acted as a bullish trendline base, holding up since late June.
BTC recently dipped into this area, found buyers, and is now attempting a reversal from this level.
This reinforces market interest and confirms the accumulation behavior in this zone.
⚠️ Break of Structure (BOS) Levels:
Minor BOS is marked near $109,800, signaling the first key intraday resistance.
A break above this level would signal bullish intent and open the way for price expansion.
Major BOS around $110,600–$110,800 is critical. A clean break here will likely validate a trend continuation toward the next objective.
🟩 Next Reversal Zone (Target Area):
Highlighted around $111,500–$112,000, this green zone represents a potential liquidity grab/reversal area where sellers could re-enter.
This zone aligns with previous price exhaustion levels and may trigger consolidation or a short-term pullback.
📈 Projected Price Path (Wave Schematic):
The chart outlines a wave structure projection, suggesting:
A possible retest of the minor BOS.
Follow-through into the major BOS area.
Final push into the reversal zone before potential rejection or sideways action.
🔧 Bias & Strategy:
Bias: Moderately Bullish as long as BTC respects the support zone.
Invalidation: A decisive breakdown below the trendline support and close under $107,500 would invalidate this bullish setup and shift bias to neutral/bearish short-term.
Trading Plan Ideas:
📥 Buy Opportunity: On minor dips within the support zone, targeting BOS levels.
📤 Sell Watch: Near reversal zone ($111.5K–$112K) if signs of exhaustion or bearish divergence appear.
📌 Final Notes:
BTC appears to be gearing up for a breakout from consolidation, and price action is coiling with higher lows. Market participants should watch closely how BTC reacts at the minor and major BOS zones, as they could define the next leg for either bullish continuation or rejection.
BTC Analysis (4H)This analysis is an update of the analysis you see in the "Related publications" section
Since the red arrow was placed on the chart, Bitcoin's bullish phase has ended and it has entered a corrective phase. This correction appears to be forming a Diametric pattern, and we are currently in the middle of wave E.
After interacting with the demand zone, the price may move toward the specified targets.
A daily candle closing below the invalidation level will invalidate this analysis.
For risk management, please don't forget stop loss and capital management
Comment if you have any questions
Thank You

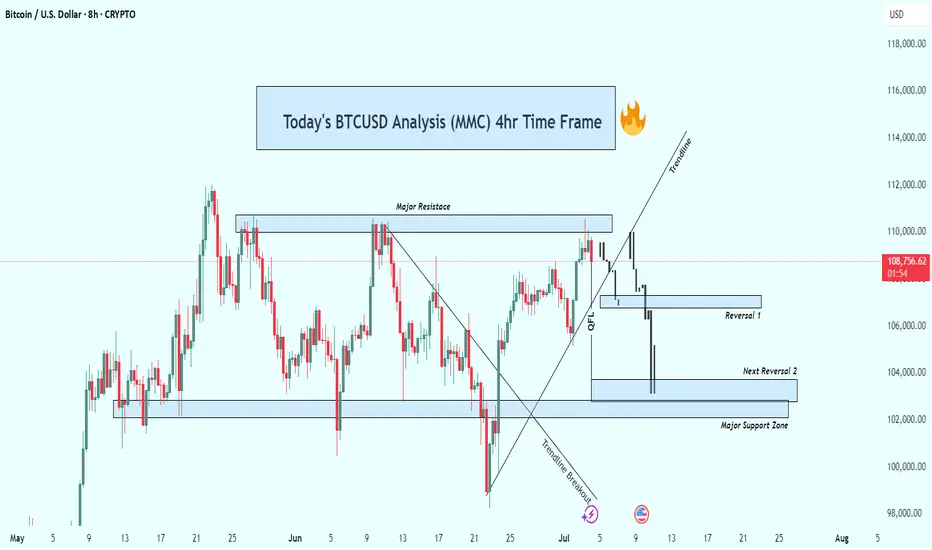
BTCUSD 4hr Technical Analysis : Rejects $110K - Next TargetsOverview:
Bitcoin is currently undergoing a significant technical correction after rejecting a strong resistance level. The 4-hour chart shows a decisive bearish breakdown, suggesting that the bulls are losing control and sellers are gaining momentum. As the price continues to fall, all eyes are now on the major support levels that could trigger a potential reversal—or further acceleration to the downside.
📊 Technical Breakdown:
1. Major Resistance Zone (~$110,000 – $111,000):
This zone has acted as a strong supply area, where price has repeatedly failed to break through. Multiple rejections from this zone confirm it as a key distribution area, where large sellers are stepping in. The repeated failure to close above it shows market exhaustion at the highs.
Multiple candle wicks and strong bearish closes around this area.
Bull traps occurred after brief moves above this resistance, followed by sharp sell-offs.
2. Trendline Breakout:
Previously, BTC had been respecting a rising ascending trendline, which served as dynamic support throughout the last rally. Recently, price broke below this trendline with strong bearish momentum.
This marks a break in market structure.
The trendline retest acted as resistance—textbook confirmation of the trend shift.
3. QFL (Quantity Following Line) Breakdown:
The QFL zone, typically a bullish defense level, has failed to hold. This breakdown confirmed that bulls lost a critical level of control.
Price briefly retested the QFL from below before continuing downward.
This zone now acts as resistance, reinforcing the bearish outlook.
🔻 Downside Targets & Reversal Zones:
✅ Reversal Zone 1 (~$106,000):
This minor support level provided minimal reaction and was quickly breached.
Lack of volume or candle confirmation suggests weak buying interest here.
✅ Next Reversal Zone 2 (~$104,000):
This zone has historical importance as a short-term demand area.
Monitor closely for bullish candlestick patterns, volume spikes, or bullish divergences to assess potential bounce scenarios.
✅ Major Support Zone (~$102,000 – $100,000):
This is the most critical level in the near term.
Historically, price has reversed strongly from this zone, indicating strong buyer interest.
If price breaks and closes below this level, expect a high-probability continuation towards the $98,000 psychological level or lower.
🧠 Market Psychology:
The breakdown from the trendline and QFL indicates panic or profit-taking.
Many late long positions are likely being liquidated.
Smart money may be waiting at the $100K zone to accumulate, depending on market conditions and macro factors.
🎯 Trading Strategy Ideas:
🛑 For Bears (Shorts):
Stay short below $110K resistance.
Trail stop-loss above QFL zone or trendline breakdown.
Look to take profit at $104K and $102K zones.
Add to positions on confirmed bearish retests of broken supports.
📈 For Bulls (Longs):
Wait for clear confirmation (e.g., bullish engulfing, double bottom, RSI divergence) near $104K or $102K before entering.
Avoid catching falling knives—patience is key.
Consider scaling in with smaller position sizes and tight stops.
Watch for a reclaim of the QFL zone or a strong bounce from the $100K psychological level.
🧭 Bias: Bearish
Structure: Lower highs & lower lows.
Momentum: Selling volume increasing, bulls losing steam.
Invalidation: A strong daily close above $111K would flip bias back to neutral/bullish.
🧩 Final Thoughts:
Bitcoin is currently in a fragile state as it retraces from a failed breakout. With multiple key support zones ahead, the next few sessions will be critical in determining whether bulls can reclaim control or if we see deeper downside movement. Watch for signs of exhaustion from sellers or fresh accumulation zones to position accordingly.
BTCUSD RISKY 4H SHORTPrice broke out of bearish trendline but formed resistance at $110600. Price printed a bearish engulfing pattern following Positive US jobs data. A potential two tops or double tops formed. A potential reversal to at least $105000.

Bitcoin Breakdown? Support Zone & CME Gap in FocusBitcoin ( BINANCE:BTCUSDT ), as anticipated in my previous analysis , attacked the Resistance lines and then resumed its decline. In previous analysis, both Long and Short positions could have been profitable .
Bitcoin is approaching a Support zone($106,800-$105,820) and the CME gap($106,645-$106,295) .
From an Elliott Wave theory perspective , it appears that Bitcoin has finally completed a five-wave impulsive move with the help of an Expanding Ending Diagonal .
I expect Bitcoin to attack the Support zone($106,800-$105,820) after breaking the lower line of the Expanding Ending Diagonal .
Note: To break through the Support zone($106,800-$105,820), Bitcoin may potentially use either a Head and Shoulders pattern or a Bearish Quasimodo formation.
Note: If Bitcoin breaks the Resistance lines, we can expect more pumps.
Cumulative Long Liquidation Leverage: $106,249-$105,094
Cumulative Short Liquidation Leverage: $109,483-$108,790
Please respect each other's ideas and express them politely if you agree or disagree.
Bitcoin Analyze (BTCUSDT), 1-hour time frame.
Be sure to follow the updated ideas.
Do not forget to put a Stop loss for your positions (For every position you want to open).
Please follow your strategy and updates; this is just my Idea, and I will gladly see your ideas in this post.
Please do not forget the ✅' like '✅ button 🙏😊 & Share it with your friends; thanks, and Trade safe.

Bitcoin Approaches PRZ – Will the Falling Wedge Break ?Bitcoin ( BINANCE:BTCUSDT ) failed to break through the Support zone($106,800-$105,820) after attacking it five times , and started to rise again.
Bitcoin is currently moving near the Resistance zone($109,220-$108,280) , Cumulative Short Liquidation Leverage($108,800-$108,085) , Potential Reversal Zone(PRZ) , and Resistance lines .
From a Classical Technical Analysis perspective , Bitcoin's movements over the past two days seem to have formed a Falling Wedge Pattern .
From an Elliott Wave theory perspective , Bitcoin appears to have completed the main wave 4 within the Falling Wedge Pattern. The structure of the main wave 4 was a Double Three Correction(WXY) .
I expect Bitcoin to attack the Resistance lines after breaking the upper line of the Falling Wedge Pattern . If Bitcoin fails to break the Resistance lines before the global markets close , we can expect Bitcoin to fall again. Because entering Saturday and Sunday , the trading volume is generally low , and I think Bitcoin needs a lot of volume to break the resistances .
Do you agree with me?
CME Gap: $106,645-$106,295
Cumulative Long Liquidation Leverage: $106,055-$105,430
Note: If Bitcoin manages to break the Support zone($106,800-$105,820), we should expect further declines.
Please respect each other's ideas and express them politely if you agree or disagree.
Bitcoin Analyze (BTCUSDT), 1-hour time frame.
Be sure to follow the updated ideas.
Do not forget to put a Stop loss for your positions (For every position you want to open).
Please follow your strategy and updates; this is just my Idea, and I will gladly see your ideas in this post.
Please do not forget the ✅' like '✅ button 🙏😊 & Share it with your friends; thanks, and Trade safe.

BTC 120K READY ???BTC 4H Chart Update 📉📈
Bitcoin is still trading inside a descending channel, but bulls are now testing the upper trendline for a potential breakout.
Price is consolidating just below $107K, showing strength after the recent bounce from the bottom of the channel.
🔹 Structure: Descending Channel
🔹 Current Resistance: $107K–$110K zone
🔹 Break & close above = bullish breakout confirmation
🔹 If breakout and close above 110k than this target possible
🔹 Target after breakout: $112K-120K+
⚠️ Rejection = pullback likely toward $103K–$104K support
📊 Breakout or breakdown — decision time is near!
#BTC #Bitcoin #Crypto #TechnicalAnalysis #BreakoutSetup
