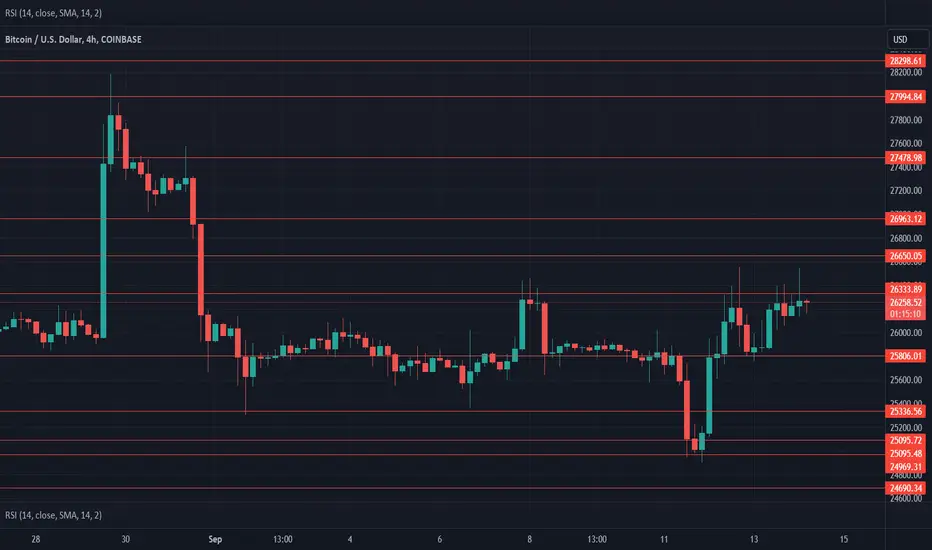
$BTC Daily UpdateMIL:BTC #BTC $27,994 testing for support, beautiful break thru $27,478, $28,298 resistance holding. 4H RSI settling down but still overbought - requires to hold $27,994, previous daily close looks very good with RSI looking good too. Watch given S/R
Btcanalysis

BTC Possible Movements For Next Week!BTC weekly review and possible scenarios for both LONG and SHORT for next week.
New Extreme Level upside is 29.6 and to downside is 23.8
Thanks for watching

$BTC Daily UpdateCRYPTOCAP:BTC $26,650 support looks good, $26,963 resisting, previous 1d closed neutral, $27,478 remains key resistance. volume dry since last 12 hours, could retest $26,650 support if failed to gain $26,963. Watch given S/R

BTC 28.1K Target Remains To Be SweepedOur Targets which were 26.8 and 27.3 are hit. now we are wating to see if bitcoin has the strenght to clear out Previous Week High (PWH) at 28.1K.After that we either consolidate at the top or retrace the whole move back.
Thanks for watching

Bitcoin to 28.1 if it holds The Bullish Structure!Despite yesterdays pump and dump we are still holding the bullish structure. there is still some hope for 28.1 but if we lose the structure we could see much lower 23.8
Thanks for watching

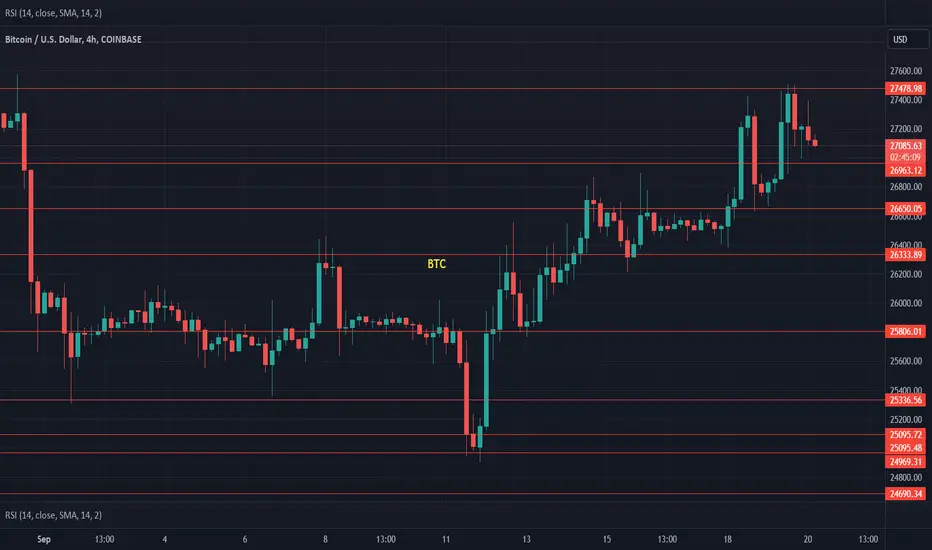
$BTC Daily UpdateCRYPTOCAP:BTC Previous 4H closed bearish, gained $26,333 support and testing, 1D closed with bearish pin, Dry volume on 1D and 4H, RSI looks fine, Could retrace to $25,806 support, Watch given S/R

Bitcoin Might Take Previous Weekly High 28.1KBTC showing some bullish signs and could start going to take the PWH.this consolidation will be big in my opinion!
Thanks for watching

Bitcoin Could have a pullback into a break out to 27.9Bitcoin was rising yesterday despite DXY movement to the upside.that indicates we may see a rise in prise when dxy pulls back down. IF DXY keeps going up and hit specific levels we could see a capitulation candle to the downside instead of a upside for BTC.
Thanks for all your support

$BTC Daily UpdateCRYPTOCAP:BTC #BTC $26,333 being tested as expected😎, struggle at $26,333 like i said yesterday, Previous 1D closed with bullish pin, RSI on 4H and 1D looking neutral, must regain $26,650 to reattempt at $27,478.

Bitcoin Showing Signs Of PumpTo 28.1K. Is it real ?With BTC holding 26.1K it could recover the dump and pump it to clear previous week high.If Not then 25.1 and lower will come.
Thank you for watching and supporting this channel

$BTC Daily UpdateCRYPTOCAP:BTC #BTC Broke $26,333 support, moving towards $25,806 support, RSI on 4H oversold, no sign of reversal yet, expect struggle at $26,333-$26,650 area. Previous 4h close looks good - bears were resisted, volume going dry on current 4H, could test $26,333

BTCUSDT's Epic Showdown: Weekly EMA Battle for SupremacyHello Traders! :)
In this week's analysis, we witnessed an intriguing battle at the weekly EMA level for BTC. Unfortunately, this level held firm, and we are currently seeing accumulation around the lower boundary of the weekly Market Profile. At this level, we can observe the development of the weekly Market Profile's point of control, signifying a significant equilibrium point. My plan for this week is to make another attempt to break above the weekly EMA level.
Currently, a LONG signal has been generated on the Multi-timeframe MACD, indicating a green light for seeking long positions at this juncture. I will initiate the trade after the LONG signal is confirmed by a Heikin Ashi candle.
My initial take profit target is set upon reaching the level of the weekly EMA line, with potential for holding the position longer depending on price behavior.
I will exit the trade if the price falls below the weekly Market Profile, canceling out potential further losses. Additionally, I will consider exiting the trade if the weekly EMA level is rejected, securing any generated profits. If the price successfully breaches the EMA level and holds, I will consider continuing the trade.
Good luck with your trades!

BTC Multiple Sell Signals Showing Possible Flood To 23.8KBitcoin sell signals are getting more and more without showing any sign of recovery to the upside.With VIX going up today could be a volatile day for NY market thus BTC could get volatile as well.
SPX made a gap yesterday and went lower.we could see the same thing today if the bearish momentum is strong
Thanks for all the support

BTC swept both side and ready for the moveBitcoin swept the lows yesterday and with these couple of days of pushing to the upside we could see some downside today specially with DXY pumping.if dxy retrace we might legup to 28.1 or higher.
Thanks for your support as always

$BTC Daily UpdateMIL:BTC #BTC Reattempted $27,478 as expected, testing $26,963 for a support, holding above $26,650 good sign, previous 4h closed bearish, last 1d closed with beautiful follow up to bullish engulfing from Monday, next resistance $28,298, watch given S/R
$BTC Daily UpdateCRYPTOCAP:BTC #BTC As expected $26,963 tested, gained $26,650 key support, $27,478 rejected which was informed days ago, last 4h close looks good, 1D closed with bearish pin but bullish engulfing, RSI looks good on 4h and 1d, must hold $26,650 support to reattempt at $27,478

Bitcoin is not bullishBitcoin to hit support around 21 to 22k.if Bitcoin will not cross 28k and hold there then I am super bearish and if you want to short btc then don't short here. If btc break support of 25k then short and target will be 21700.

$BTC Daily UpdateCRYPTOCAP:BTC #BTC Struggle gaining $26,650 key support, last 4h closed bearish with possibility to test $26,333 support, 1D closed neutral, weak volume as of now, watch given S/R

Bitcoin Still Wants That 27.3Despite BTC showing sell signals on Stoch RSI and Rising Wedge. its still holding the range and trying to slowly crawl higher.Will Momentum pick up today ? If Momentum picks up which side we going? These are the questions to ask.
Thanks for watching

$BTC Daily UpdateCRYPTOCAP:BTC #BTC $26,333 support gained, $26,650 resistance testing as expected, $27,478 key resistance to watch for support, $26,650 will be key support if gained.

Bitcoin Could Go Higher After A Liq Grab Bitcoin made a higher high and a higher low in the past days, showing bullish sign.with this rising wedge at hand we have to see if its valid or not.
Thanks for watching

$BTC Daily UpdateCRYPTOCAP:BTC #BTC Last 4h closed bearish, $26,333 resistance holding, Previous daily closed fine, RSI rising on 1D and 4H, needs volume to push towards $26,650 support. Watch given S/R, FUD coming up with FTX selling it's crypto assets
Bitcoin (BTC) is Turning Up in H4Technical Analysis:
- BTC is doing wave (3) in blue which is part of wave ((1)) in black
- When wave ((1)) is completed, we expect a ABC correction in wave ((2)) in black around at 32,500
- H1 & H4 right side is turning up
Technical Information:
- We only consider the buy opportunity in wave (4) in blue once it's completed
