$BTC Daily UpdateCRYPTOCAP:BTC #BTC pushed thru and gained $25,806 support! $26,333 resisting as expected, previous daily failed to close with bullish engulfing, Must take $26,963 to avoid retrace towards $25,336-$25,095.
Btcanalysis

BTCBTCUSDT Analysis for week ahead, Currently, I make this prediction that, first, we have a pullback to around $30K and then the end of the upward trend.

Where will bitcoin go?According to the price action structure on the chart, it seems that Bitcoin will drop to the green range of ob after hitting the red range of supply.
We have sets of ob's that have been mitigated and now it looks like the way is open for a drop to the green range.
This upward movement of the price seems to be the time to collect sell orders
Also, we should not forget that we are under major dynamic resistance.
I have specified the invalidation level. Closing a 4-hour candle above this level will violate the analysis
For risk management, please don't forget stop loss and capital management
Comment if you have any questions
Thank You

BTC Bitcoin Technical Analysis and Trade IdeaIt's evident that Bitcoin has faced sustained downward pressure for a considerable period. A close examination of the chart reveals a decisive breach of the existing trading range to the downside, followed by a subsequent retracement. In our discussion, we explore the prospect of a potential entry point, while also carefully analyzing certain adverse indicators that are clearly visible on the chart. It's crucial to emphasize that all insights and analyses are comprehensively explained in the accompanying video and should not be interpreted as financial advice.

$BTC Daily UpdateCRYPTOCAP:BTC #BTC FTX Dump will effect the market as FUD rises, $25,806 given resistance holding strong, $25,336-$25,095 support range which will be weak against FUD, $24,129-$22,379 supports to watch

Bitcoin Yet To decide Where To GoBitcoin showing mixed signals,above 27K or below 25K!
My guess : 27K then 25K
Thanks for watching

$BTC Daily UpdateCRYPTOCAP:BTC #Bitcoin continues to struggle at $25,806, last 1D close looks fine, bearish engulfing on previous 4H close, volume remains weak. Spent over 10 days below $26,333 now, $27,994 key resistance, $26,963 support required to test, $25,336 current support.

Bitcoin Might try 26.1 over the weekendBitcoin went up and dropped back to our yellow line - some FVG gap to clear at 26.1 and could also sweep the lows.
Thanks for watching

$BTC Daily UpdateCRYPTOCAP:BTC testing $26,333, Previous 4h closed bearish with resistance holding good, bullish engulfing on 1D previous close, gaining $26,650 support will allow to test for $27,478. Watch given S/R

Bitcoin Might Change Direction to upside todayBitcoin hit 25.3 for the third time. Everytime we touch it we went up.touching 25.3 for fourth time could result in losing the support and going lower
Thanks for all your support.

$BTC Daily UpdateCRYPTOCAP:BTC $25,336 support retested, struggling to regain $25,806, $27,478 support required to reattempt at $28,298. Poor volume as it was, watch given S/R

Bitcoin Gives More Sell Signals.Is it a Pullback Or Reversal?Bitcoin Giving us multiple sell signals so far.Losing 25.1K could be catastraphic for BTC.Whatever it is, its comin very soon (maybe today)
Thanks for watching

Bitcoin Yet To Go Lower For A Sweep!Bitcoin performed a liquidity grab to the upside (origin of dump) now its heading to grab lower liquidities. 25.1 to 24.7 could be the possible target
Thanks for watching

$BTC Daily UpdateCRYPTOCAP:BTC given support at $25,336 in effect, $25,336-$26,333 current range, RSI on 4H and 1D both looking poor awaiting sign of reversal here with very low volume. Watch given S/R

Grayscale vs SECFrom 29-08-2023 to 31-08-2023
Disclaimer:
This is for educational purpose only.
This is not a financial advice.

BTCUSD Analysis 3Sep2023BTC analysis is still in accordance with the analysis some time ago. Where the price goes down to SND and is currently still continuing the bearish trend. Seen prices approaching Wave 2, had seen bullish some time ago but the price returned to the 25800 area. There is a possibility that the price drops back more than wave 2. If this occurs is likely to be fake out, or if there is a bearish continuation then the Elliot wave notation will change .

Bitcoin still has room to go lower before a pull back to upsideBitcoin price hit 25.3 on friday but our expectation was at least 25.1 and at best 24.7. still wating for that.
Overall Im looking for long oppurtonities and Im holding my shorts
Thanks for watching and all your support

Bitcoin still has to perform a higher short squeezWe dropped 22%, should expect a higher short squeez than 28.1 or break the support and go lower but does it have what it takes to go lower ?
Thanks for watching

$BTC Daily UpdateCRYPTOCAP:BTC Back between $25,806-$26,333 range, dumped following bearish pin bar on 4H. Weak volume, $25,336 next support. Watch given S/R
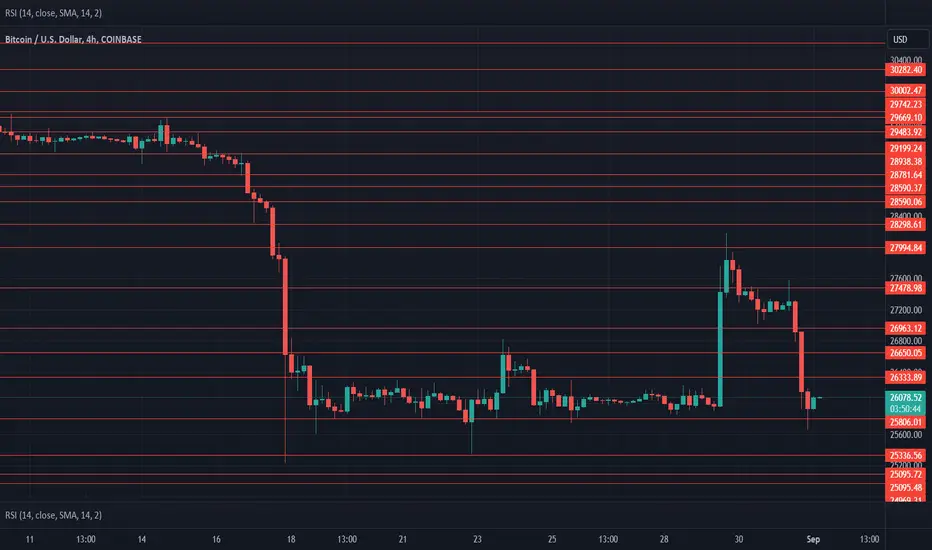
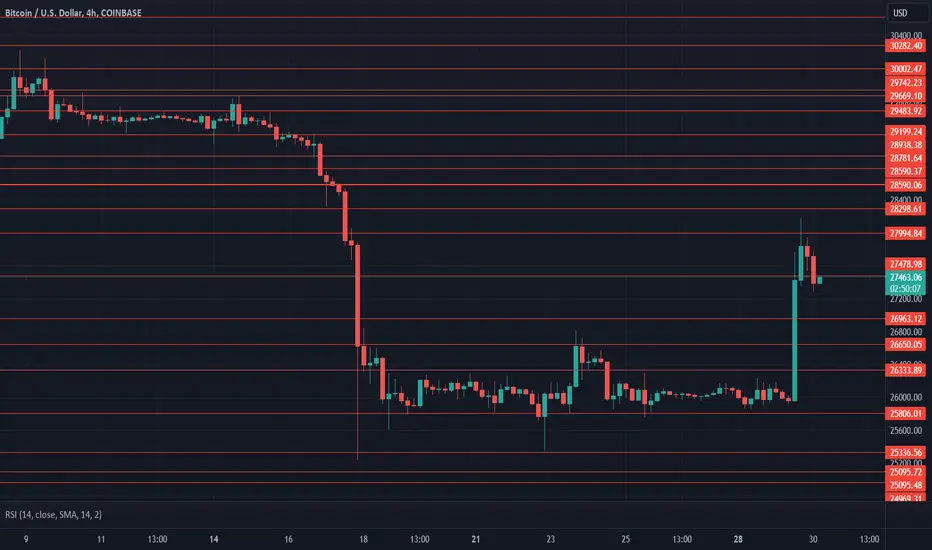
$BTC Daily UpdateCRYPTOCAP:BTC $27,994 resisted, struggling at $27,478 support. RSI on 1D looks good, Must hold $27,478 key support here, Next key resistance at $28,590. Watch given S/R
Channel tradingHow to trade channels after sharp moves, where there is a valid money flow in the market.
During this short video I just described one of very common and useful techniques that is applied for channel trading, which is for this video scalping, but it applies to all time frames.
Here you need to get confirmation and be patient for pull back, it is important to put your stop loss precisely and of course be loyal to it (please do not move it)
Put the stop loss under that shadow but with enough space for breathing

$BTC Daily updateCRYPTOCAP:BTC range maintained - almost 11 days now between $26,650-$26,963. RSI on 1D remains oversold with poor volume, needs a push to regain $26,963 support.

Good Time for Trading Bitcoin.It is too early to succumb to emotions, since there are still many stops under the lows. Most likely, this is a short-term trap, but if the price goes out and fixes above the red zones, it will become a more bullish sign.
When the minimum is updated, the fifth wave of the lower order will be placed, after which we can expect a rebound in order to close the gap.
