BTC NEW UPDATE (4H)This analysis is an update of the analysis you see in the "Related publications" section
Bitcoin has not yet reached our zone, but it has formed a correction of the same degree as the previous ones and has also created a support area. The diametric pattern could potentially shift into a symmetrical one, and Bitcoin may even reach the 100K–105K zone.
We should keep a close eye on the 100K level for now, as it also serves as a psychological resistance.
For risk management, please don't forget stop loss and capital management
Comment if you have any questions
Thank You
Btcanalysis

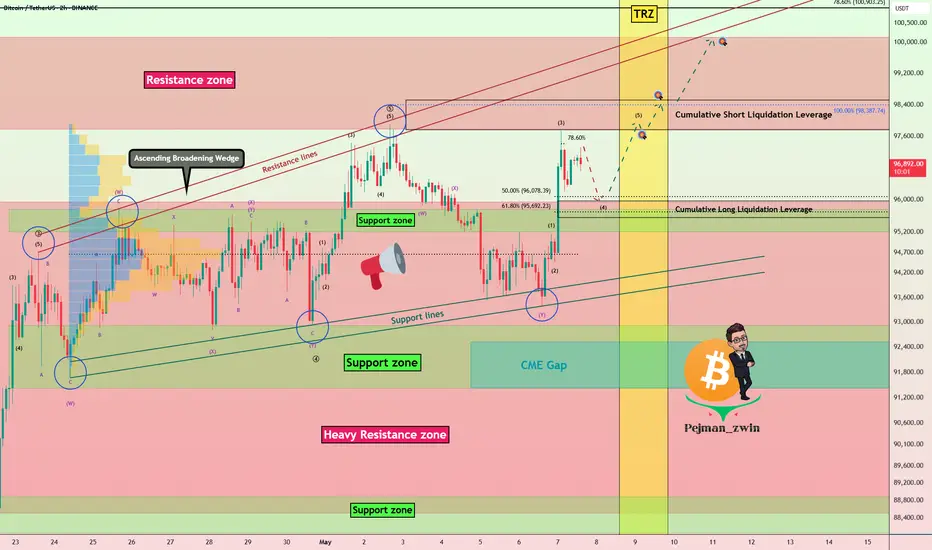
Bitcoin Hits PRZ — Reversal or Breakout?As I expected in my previous idea , Bitcoin ( BINANCE:BTCUSDT ) started to rise from the Support zone($95,760-$95,200) . One of the news that pumped Bitcoin was " Arizona Becomes Second U.S. State to Adopt Bitcoin for State Treasury "
Bitcoin is trading in the Resistance zone($100,200-$97,700) and near the upper lines of the Ascending Broadening Wedge Pattern , Time Reversal Zone(TRZ) and Potential Reversal Zone(PRZ) .
Also, we can see a Regular Divergence(RD-) between Consecutive Peaks.
From an Elliott wave theory , it seems we should wait for corrective waves because the Cumulative Short Liquidation Leverage($100,888-$99,826) is very important and I DO NOT expect it to be broken by a single attack .
Another point we can pay attention to is the existence of two small CME Gaps , the first CME Gap($98,430-$98,380) is likely to be filled.
I expect Bitcoin to drop to at least $98,100 in the coming hours, and if the Support zone($97,900-$97,240 ) is broken, we should expect further declines, so I will label this idea as ''Short' '.
Cumulative Long Liquidation Leverage: $98,500-$97,514
Note: If Bitcoin can break the Potential Reversal Zone(PRZ) with the good volume, we can expect a new All-Time High(ATH).
Do you think Bitcoin is on track for a new All-Time High(ATH)?
Please respect each other's ideas and express them politely if you agree or disagree.
Bitcoin Analyze (BTCUSDT), 2-hour time frame.
Be sure to follow the updated ideas.
Do not forget to put a Stop loss for your positions (For every position you want to open).
Please follow your strategy and updates; this is just my Idea, and I will gladly see your ideas in this post.
Please do not forget the ✅' like '✅ button 🙏😊 & Share it with your friends; thanks, and Trade safe.

$BTC Daily Update - Back above $100KCRYPTOCAP:BTC : Well, Hello! $100K!!!😍
$102,280 support in effect currently, $103,093 resistance testing, current 1W candle looking mighty bullish, RSI looking good on 1D and 4H, $104,987 next key resistance, $99,361 current key support.

Bitcoin Breaks Heavy Resistance Zone— But Can It Hold?Bitcoin ( BINANCE:BTCUSDT ) started to rise yesterday as the S&P 500 Index ( FOREXCOM:SPX500 ) opened and it seems like it can break the Heavy Resistance zone($95,950-$88,500 ) this time, but there are still concerns from a technical analysis , so please stay tuned for this analysis .
Bitcoin is moving near the Resistance zone($100,200-$97,700) and has broken through the Heavy Resistance zone($95,950-$88,500) with good momentum .
In terms of Elliott wave theory , it seems that Bitcoin has completed microwave 3 near the Resistance zone($100,200-$97,700) and we should wait for the completion of microwave 4 . The microwave 4 can be considered a pullback to the Heavy Resistance zone($95,950-$88,500 ).
I expect Bitcoin to drop to at least $96,000 and is likely to touch the Support zone($95,760-$95,200) and start rising again, since microwave 3 was with high momentum , it is possible that microwave 5 will even be truncated . The targets I have indicated on the chart can be the target of a long position .
If you are looking for a Bitcoin reversal, you can focus on the Time Reversal Zone(TRZ) . The next major pivot will likely be within this time zone .
It seems reasonable to open a Long position near the Support zone($95,760-$95,200) , and it can give us a good Risk-To-Reward . What do you think?
----------------------------------------------------
My concerns for Bitcoin's continued bullish trend:
Because Bitcoin's correlation with US stock market indices , especially the SPX500 , is higher than in previous weeks, my analysis is that there is a re-correction in the SPX500 index , which could prevent Bitcoin from continuing its upward trend .
The Ascending Broadening Wedge pattern is likely to complete, which could cause Bitcoin to fall further if the lower lines of this pattern are broken.
If tensions between Pakistan and India increase, it could prevent Bitcoin from growing further.
----------------------------------------------------
Also, Today, the Federal Funds Rate is scheduled to be announced.
Let’s take a look at how this decision — along with Powell’s speech — might impact Bitcoin . Be cautious with your positions during the announcement and Powell’s remarks, as markets may become volatile.
Holding the rate steady is a signal of monetary policy stability, which could give risk assets like Bitcoin some breathing room in the short term.
Given recent U.S. economic data, markets are mainly focused on Powell’s tone during the press conference. If he adopts a dovish stance (hinting at potential rate cuts), this could support Bitcoin’s upward momentum.
However, if Powell emphasizes that rates will remain elevated for an extended period, we might see a temporary wave of selling pressure in the market.
Stay alert and manage your risk wisely — high-impact events like this can lead to sharp moves in crypto.
----------------------------------------------------
Cumulative Short Liquidation Leverage: $98,511-$97,774
Cumulative Long Liquidation Leverage: $95,966-$95,550
Note: If Bitcoin falls below $94,400, we can expect further declines.
Please respect each other's ideas and express them politely if you agree or disagree.
Bitcoin Analyze (BTCUSDT), 2-hour time frame.
Be sure to follow the updated ideas.
Do not forget to put a Stop loss for your positions (For every position you want to open).
Please follow your strategy and updates; this is just my Idea, and I will gladly see your ideas in this post.
Please do not forget the ✅' like '✅ button 🙏😊 & Share it with your friends; thanks, and Trade safe.
Bitcoin Still Stuck in Resistance – Eyes on CME Gaps & USDT.D%Bitcoin ( BINANCE:BTCUSDT ) touched $92,830(first target) and started to rise as I expected in the previous idea . Overall, Bitcoin has been moving in a range for about 12 days .
Note : In general, trading in a range market is more difficult than in a trending market . If your performance in a range market is not good, it is better not to trade until the trend is clear (this is just a suggestion).
Bitcoin is currently trading at a Heavy Resistance zone($95,950-$88,500) and has failed to break through it, and it seems like Bitcoin needs more momentum to break through this zone. Do you think Bitcoin will finally break through the Heavy Resistance zone($95,950-$88,500)?
In terms of Elliott Wave theory , it appears that Bitcoin has completed a five-wave impulsive and we should expect Corrective waves .
The analytical conditions of the Bitcoin chart have been a bit ambiguous in the past few days, so it's better to take a look at the USDT.D% ( CRYPTOCAP:USDT.D ) chart to increase the accuracy of Bitcoin analysis .
USDT.D% failed to break the Support zone(5.13%-4.95%) after several attacks. It currently appears to be forming an Ascending Broadening Wedge Pattern . It appears that USDT.D% needs to complete this pattern to break the support zone, and if this pattern fails , we should expect further increases =Bitcoin crash .
I expect Bitcoin to decline to the Support zone($92,910-$91,414) , 21_SMA(Weekly) and Cumulative Long Liquidation Leverage($93,359-$92,296) and probably fill the CME Gap($92,525-$91,415) this time and then start to rise and prepare to break the Heavy Resistance zone($95,950-$88,500) and fill the CME Gap($97,680-$96,455) .
Cumulative Short Liquidation Leverage: $98,989-$97,924
Note: If Bitcoin breaks below the Support zone($92,910-$91,414), we should expect further declines.
Please respect each other's ideas and express them politely if you agree or disagree.
Bitcoin Analyze (BTCUSDT), 1-hour time frame.
Be sure to follow the updated ideas.
Do not forget to put a Stop loss for your positions (For every position you want to open).
Please follow your strategy and updates; this is just my Idea, and I will gladly see your ideas in this post.
Please do not forget the ✅' like '✅ button 🙏😊 & Share it with your friends; thanks, and Trade safe.

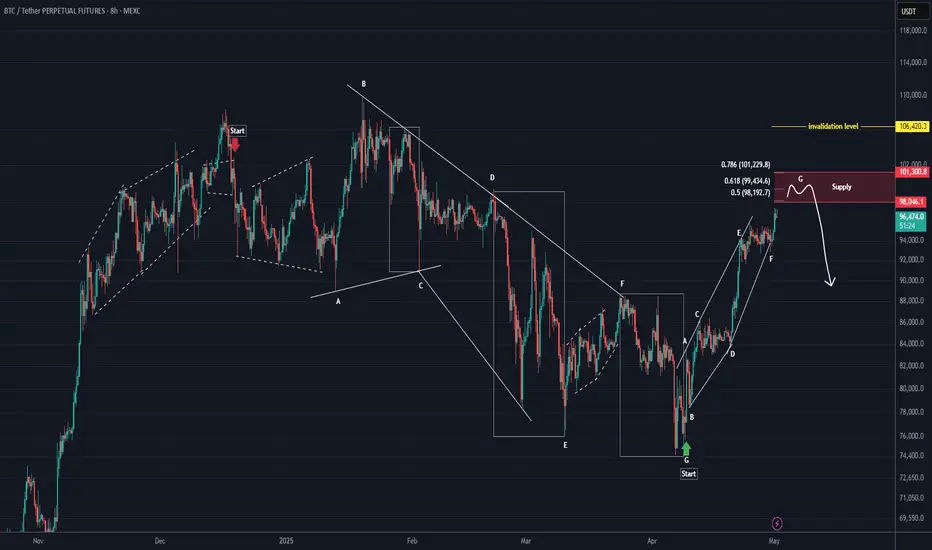
BTC New Update (8H)This analysis is an update of the analysis you see in the "Related publications" section
In the previous scenario, we considered that Bitcoin was in a diametric where wave E had extended. However, after reviewing the charts and analyzing various scenarios, we decided to revise the wave count as shown in this update, since wave E of the previous diametric scenario became overly extended.
You can see the complete wave count of the chart in this update. The correction in Bitcoin started from the point where we placed the red arrow on the chart. This correction was a diametric and ended where the green arrow is placed.
From the point where the green arrow is shown on the chart, Bitcoin's bullish wave has started, which is either wave A or W.
According to this scenario, the expected rejection zone should be between 98K and 103K.
The lowest-risk area for price rejection is the red box.
A daily candle close above the invalidation level will invalidate this analysis.
Let’s see what happens.
For risk management, please don't forget stop loss and capital management
Comment if you have any questions
Thank You
BTCUSD Possible Move May 6th 2025🔻 BTC/USD – SHORT SIGNAL & ANALYSIS
📉 Signal:
Sell BTC/USD below 94,000 after a confirmed break and retest of the ascending trendline.
Target: 93,000 liquidity zone
Stop Loss: Above 94,400 (or structure high after retest)
Risk/Reward: Approx. 1:2+
📊 Analysis:
Price has been in a descending channel, followed by a corrective structure forming higher lows.
Currently testing a rising trendline, suggesting weakening bullish momentum.
Clean liquidity pool rests around 93,000, likely to be targeted if structure breaks.
Expected flow:
Break below 94,000 trendline
Retest the trendline as resistance
Continuation to 93,000 demand/imbalance area
🧠 Trade Idea Summary:
This setup aligns with bearish market structure and liquidity concepts. A breakdown from the trendline would confirm bearish intent, with 93,000 as the next logical draw on price.

BTC testing support or more downside?After breaking out of last week's range, BTC failed to flip R to S. Currently testing potential support, if price fails to hold it current price range between $93.k, we could see a retest of GETTEX:92K or the 1D 200MA around $90k.

Bitcoin Analysis (4H)Bitcoin has lost its trendline and appears to have accumulated significant sell orders near the top.
The zone between $96K and $100K could act as the main supply area, potentially pushing the price down to at least $88K.
Targets are clearly marked on the chart.
A daily candle closing above the invalidation level would invalidate this outlook.
Do not enter the position without capital management and stop setting
Comment if you have any questions
thank you

Bitcoin Range-Bound in Heavy Resistance – CME Gap Still Open!Bitcoin ( BINANCE:BTCUSDT ), like Gold , has been moving in a Range for the past 5-6 days and is currently in a Heavy Resistance zone($95,950-$88,500) , as it has been in the past few days .
In terms of Elliott Wave theory , Bitcoin appears to be completing a main wave 4 . The main wave 4 structure can take two forms: Double Three Correction(WXY)_Expanding Flat(3-3-5) .
I label this analysis " Short " for the following reasons:
Due to Bitcoin's higher correlation with the S&P 500 Index ( SP:SPX ) these days, I am short on the S&P 500 Index.
China’s president Xi Jinping says Trump lied about them having a phone call ; it is NOT good news for the S&P 500 Index and Bitcoin .
CME Gap($92,525-$91,415) has NOT filled yet, and I think Bitcoin will NOT start the next bullish rally before filling the CME Gap.
I expect Bitcoin to drop to at least $92,830 and then decline to the Support zone($92,000-$91,400) if the Support lines are broken.
Cumulative Short Liquidation Leverage: $96,741-$95,520
Note: If Bitcoin can touch $97,000, we should expect more pumping.
Note: If Bitcoin goes below the 100_SMA(Daily), we should expect a fall.
Please respect each other's ideas and express them politely if you agree or disagree.
Bitcoin Analyze (BTCUSDT), 1-hour time frame.
Be sure to follow the updated ideas.
Do not forget to put a Stop loss for your positions (For every position you want to open).
Please follow your strategy and updates; this is just my Idea, and I will gladly see your ideas in this post.
Please do not forget the ✅' like '✅ button 🙏😊 & Share it with your friends; thanks, and Trade safe.

BTC DOMINANCEBitcoin dominance could break down at this point, potentially signaling the start of an exceptional altseason.

Will BTC Correct Before Breaking $96K? CME Gap Still Open!Bitcoin ( BINANCE:BTCUSDT ) moved as it did in the previous post , I hope it was useful for everyone.
Bitcoin is still moving in the upper areas of the Heavy Resistance zone ($95,000-$88,500) , this type of movement does NOT seem to be enough to break Heavy Resistance zone ($95,000-$88,500) , so I still expect a correction .
The volume of Bitcoin's price rebound to the previous high does NOT seem to be sufficient, and even Regular Divergence(RD-) is evident.
According to Elliott Wave theory , it seems that Bitcoin has completed its 5 impulse waves and we should expect another decline . Of course, there is still a possibility that the main wave 4 will be an Expanding Flat(ABC/3-3-5) . But both scenarios can bring us a decline in Bitcoin price .
I expect Bitcoin will NOT be able to break the Heavy Resistance zone ($95,000-$88,500) before the CME Gap($92,525-$91,415) is filled, This is just my analysis of course, considering the above explanation. What do you think?
Cumulative Short Liquidation Leverage: $96,000-$95,095
Cumulative Long Liquidation Leverage: $93,350-$92,551
Cumulative Long Liquidation Leverage: $90,276-$89,160
Note: If Bitcoin goes over $96,100, we can expect more pumps.
Please respect each other's ideas and express them politely if you agree or disagree.
Bitcoin Analyze (BTCUSDT), 1-hour time frame.
Be sure to follow the updated ideas.
Do not forget to put a Stop loss for your positions (For every position you want to open).
Please follow your strategy and updates; this is just my Idea, and I will gladly see your ideas in this post.
Please do not forget the ✅' like'✅ button 🙏😊 & Share it with your friends; thanks, and Trade safe.

Bitcoin's Next TargetBTC starts the week with a 4H doji, potentially signaling a reversal of the short term retracement from local Hs around $95.4k.
Reclaiming those Hs can easily lead to a retest of Feb's resistance around $98.7k - or even surprise us with a test of $102k.
A loss of momentum and close below GETTEX:92K could signal weakness.

Bitcoin Walks Into a Robust Resistance AreaFenzoFx—Bitcoin remains bullish above the 50-period simple moving average at around $93,950. A doji candlestick on the daily chart signals potential consolidation or a bearish move.
Resistance spans from $94,990 to $99,420, suggesting a possible reversal. We recommend waiting for Bitcoin’s reaction before planning a strategy.

BTC Is Still Bullish (4H)This analysis is an update of the analysis you see in the "Related publications" section
Bitcoin is still struggling with the supply zone we identified in the previous analysis. It has not yet been able to establish itself above this supply area.
A slight correction is expected, with support anticipated from the green box.
The closing of a 4-hour candle below the invalidation level will invalidate this analysis.
For risk management, please don't forget stop loss and capital management
Comment if you have any questions
Thank You

Bitcoin Monthly compared to Historical Cycle Tops-UPDATE $400K ?
Keeping this simple
PA is on the 3rd of 3 Candles below that Threshold line. The comparison is the same position back in 2017 ( left Arrow ), Same Months, same position and also in the 4th year of the Cycle.
Now, I will say, I am one of the many that are saying "this time is different" and yet, when we see this.....well....Is it ?
We will find out in time but for now, Lets follow the chart, as we Must......Charts Never Lie
SO, for that Green candle to touch the threshold line, we are looking around the current ATH and then, when MAY comes in, we need to stay above.
Now, The monthly Candle Colours charts I post, mentioned, that if April closes Green, May has a High Percent chance of also doing that.
We have to wait and see - 1 Week to go till April closes.
As you can see, historically, The year with the Green Box is the year we go to ATH and above the upper trend line, with the ATH on or above that dashed line.
This puts this cycle ATH around, or above, $400K !
That is near Twice my current projection.
Is this time different. ?
There is a chart I have that explains how Bitcoin has been under an Arc od resistance since it's crea\ion and This is something that could keep PA down to the 250K ATH that is expected by so many
The chart is Below, it exoplains itself
So, the next 6 weeks are Pivotal to how this cycle will play out, with one of two ATH zones available.
But more importantly, Bitcoin PA NEEDS to break above and away from that Arc of resistance....and THAT WOULD MAKE THIS TIME DIFFERENT
Enjoy the ride guys and Gals

BTC Pumped Hard – Is It Time for a Pullback to Fill CME GAP!?Bitcoin ( BINANCE:BTCUSDT ) started pumping after the pullback, as I expected in my previous post , I hope you were able to take profits.
Bitcoin is trading in the upper areas of the Heavy Resistance zone ($95,000-$88,500) , near the Resistance lines and the upper line of the ascending channel .
Also, we can see the Regular Divergence(RD-) between Consecutive Peaks .
From the Elliott Wave theory perspective , it seems that Bitcoin has completed the main wave 3 and we can expect the completion of the main wave 4 today .
I expect Bitcoin to correct in the next few hours and drop to the targets I have specified on the chart and fill the CME Gap($93,465-$91,415) .
Cumulative Short Liquidation Leverage: $95,700-$94,542
Cumulative Long Liquidation Leverage: $92,666-$91,415
Cumulative Long Liquidation Leverage: $90,276-$89,160
Note: If Bitcoin can break the upper line of the ascending channel, we should wait for the next pump.
Please respect each other's ideas and express them politely if you agree or disagree.
Bitcoin Analyze (BTCUSDT), 1-hour time frame.
Be sure to follow the updated ideas.
Do not forget to put a Stop loss for your positions (For every position you want to open).
Please follow your strategy and updates; this is just my Idea, and I will gladly see your ideas in this post.
Please do not forget the ✅' like '✅ button 🙏😊 & Share it with your friends; thanks, and Trade safe.

BTC Breaks Key Resistance –Pullback Your Last Chance to Enter!?To start today's analysis, it's best to look at the Bitcoin ( BINANCE:BTCUSDT ) analysis I shared with you on April 10 , which can give us good insight and has performed well so far .👇
Bitcoin seems to have finally managed to break through Important Resistance lines as well as the Resistance zone ($86,500-$85,150) . The break volume is also high and could be a good sign for the continuation of the upward trend .
According to Elliott Wave theory , with the breaking of important resistance lines , we should wait for the next 5 impulsive waves , which I will try to analyze step by step in this idea and future ideas.
I expect Bitcoin to attack the Heavy Resistance zone ($95,000-$88,500) for the first time after the pullback to the broken Resistance zone ($86,500-$85,150) (it is better to enter a long position on the pullback ). Basically, assets can NOT break such heavy zones for the first time . ( With very good news, it may break for the first time ).
Cumulative Long Liquidation Leverage: $86,022-$85,539
Cumulative Short Liquidation Leverage: $89,340-$88,000 = Important
Do you think the main uptrend has resumed or will Bitcoin correct again?
Note: The pullback is likely to start from the third point of contact with the Resistance lines.
Note: If Bitcoin falls below $85,100, it seems we should expect further declines.
Please respect each other's ideas and express them politely if you agree or disagree.
Bitcoin Analyze (BTCUSDT), 1-hour time frame.
Be sure to follow the updated ideas.
Do not forget to put a Stop loss for your positions (For every position you want to open).
Please follow your strategy and updates; this is just my Idea, and I will gladly see your ideas in this post.
Please do not forget the ✅' like '✅ button 🙏😊 & Share it with your friends; thanks, and Trade safe.

Failed Breakout + Rising Wedge = Bearish Signal for Bitcoin!?Bitcoin ( BINANCE:BTCUSDT ) attacked the Resistance zone ($87,520-$85,840) and the important Resistance line as I expected in yesterday's idea , but it seems that it failed to break .
Bitcoin is moving between two Support and Resistance zones .
From a Classic Technical Analysis , Bitcoin appears to have formed a Rising Wedge Pattern .
From an Elliott Wave theory , Bitcoin appears to have completed a main wave 5 on the 1-hour time frame .
Also, we can see the Regular Divergence(RD-) between Consecutive Peaks .
If we look at the Bitcoin chart in the 4-hour timeframe , a Shooting Star Candlestick Pattern with high volume is clearly visible near the Resistance zone ($87,520-$85,840 ), which could signal a reversal and decline in Bitcoin .
I expect Bitcoin to start declining again after an upward correction and break the lower line of the rising wedge pattern , and reach the targets I have indicated on the chart.
Cumulative Short Liquidation Leverage: $87,708-$86,487
Cumulative Long Liquidation Leverage: $84,520-$83,687
Do you think Bitcoin can finally break the important resistance line? I would like to hear your thoughts.
Note: If Bitcoin breaks above the Resistance zone ($87,520-$85,840), we can expect a pump.
Note: If Bitcoin falls below $81,000, we can expect further declines.
Please respect each other's ideas and express them politely if you agree or disagree.
Bitcoin Analyze (BTCUSDT), 1-hour time frame.
Be sure to follow the updated ideas.
Do not forget to put a Stop loss for your positions (For every position you want to open).
Please follow your strategy and updates; this is just my Idea, and I will gladly see your ideas in this post.
Please do not forget the ✅' like '✅ button 🙏😊 & Share it with your friends; thanks, and Trade safe.

Choose your Side- i often compare TheKing with Nasdaq right now.
- Have a main reason :
- NAS100 (Nasdaq) have mostly "Top Tech Companies" acting as Thermometers in this index.
- SPX (SP500) have Tech Companies + traditional ones. Nasdaq Companies are also included in SPX, but 500 Companies start to be a lot.
- DJIA (Dow Jones Industrial Average) is a Mastodons, i don't use it much because this top 30 is too mixed ( coca cola, boeing, techs, big banks, nike.. etc).
- i mostly use very high TFs, i prefer look from far, less noise, more easy and less headaches.
- i use sometimes to trade with 1D, H12, H4 TFs but when we are bullish. In bearmarket, it's hard to find entries points in bearish mode.
- i don't short markets and accumulate more coins/tokens, so i just DCA, Dollar Cost Averaging is investing a fixed amount of money into a particular investment at regular intervals.
- so this chart is basically only about MACD :
- it's really interesting to see Nasdaq making another red columns in 3W TF, while the markets should recover slowly.
- if you take a look at BTC, columns stayed in Light Red Color and reducing size.
What could it means ?
- Keep in mind that BTC is not a STOCK.
- One of the most pivotal events on Bitcoin's blockchain is the halving, when the supply of new bitcoins is cut in half (2024).
- BTC have 21M Supplies and that's all. no more will be created.
- At any time BTC could stop to follow Nasdaq and do his way, TheKing used to do that before already.
- A small bounce in Nasdaq could be also a huge move for BTC.
- " Choose your side " and DCA the money you don't need for living.
Happy Tr4Ding !

Bitcoin Monitoring- This is not a trade setup.
--------------------------------------------
- Zones to keep close surveillance :
--------------------------------------------
- 25,200$
- 27,300$
--------------------------------------------
Happy Tr4Ding!

$BTC Update - Sideways Movement AheadCRYPTOCAP:BTC #BTC at $84,221 support and testing, Next key resistances at $88,674 and $91,357, $81,614 current key support area, Ranging between $86,305-$82,833. Low volume on 4H, put bullish engulfing on previous 4H close but no follow up on current 4H, Last weekly close looks good with a bullish engulfing, but current weekly not looking promising for a follow thru yet. Previous daily closed bearish, RSI remains neutral on 4H, 1D and 1W. Expecting more sideways movement until $91,357 resistance is taken as support.

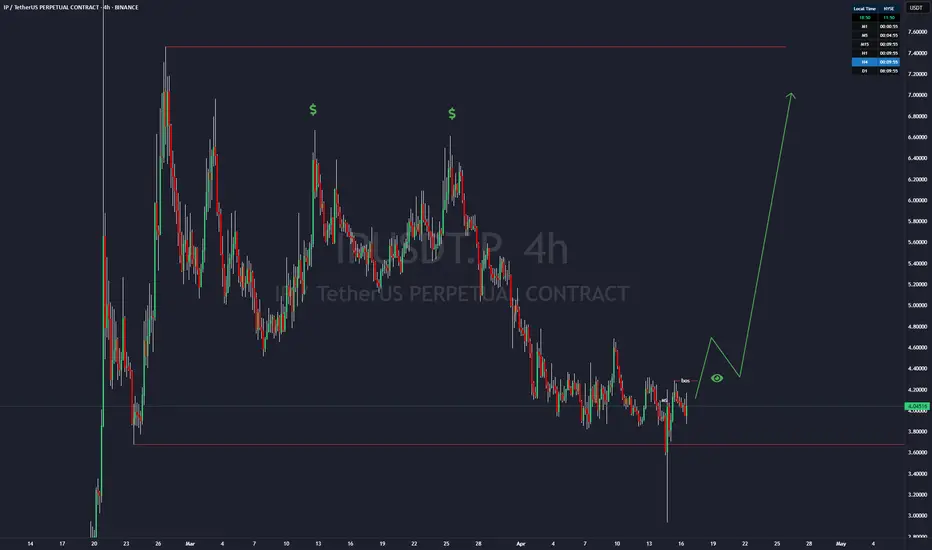
Is crypto dead? NO! IP might save the day!Price Action Analysis
NYSE:IP recently declined to the $3.67 level, effectively sweeping external liquidity by triggering stop-loss orders below key support. This move was followed by a strong recovery, with price fully absorbing the bearish momentum and closing within the global trading range. This price action resulted in a Market Structure Shift (Change of Character, or ChoCH), indicating a potential reversal from bearish to bullish sentiment. The ChoCH suggests institutional buying interest, as the market rejected further downside and reestablished bullish structure.
However, caution is warranted. Bitcoin ( CRYPTOCAP:BTC ), a key market driver, may experience a corrective move lower, potentially influencing NYSE:IP ’s price action. As such, immediate entries are premature without further confirmation of bullish momentum.
Key Levels and Trade Setup
Break of Structure (BoS) at $4.28
The $4.28 level on the daily timeframe is pivotal, representing a potential Break of Structure (BoS). A decisive close above this level would confirm bullish continuation, signaling the start of a significant upward move. Should this occur, NYSE:IP is likely to target the following resistance zones:
$6.61: Initial target, likely aligning with prior swing highs or liquidity pools.
$6.98: Secondary target, potentially coinciding with a Fair Value Gap (FVG) or institutional sell-side liquidity.
$7.46: Final target, representing a high-probability zone for profit-taking.
Entry Confirmation
To ensure a high-probability trade, the following conditions must be met:
Daily BoS Confirmation: A clean break and close above $4.28 on the daily chart, supported by elevated trading volume.
4-Hour Timeframe Validation: A breakout above $4.28 on the 4-hour (4H) or higher timeframe, ideally accompanied by a bullish Fair Value Gap (FVG). An FVG forming on the 4H chart post-breakout would serve as an optimal entry zone, minimizing risk by aligning with institutional order flow.
Pullback to FVG: Post-breakout, a retracement to a 4H bullish FVG (e.g., $4.20–$4.25) that holds as support would confirm the setup for a long position.
Trade Execution
Set Alerts: Configure price alerts at $4.28 to monitor for a daily or 4H breakout. Ensure alerts trigger on a candle close above this level to confirm BoS.
Risk Management: Risk no more than 1–2% of trading capital per trade. Position size should be calculated based on a stop-loss placed below the FVG or recent swing low (e.g., $4.00–$4.10), targeting a minimum risk-reward ratio of 5:1.
Exit Strategy: Take partial profits at $6.61 (50–70% of position) and trail stops for the remaining position toward $6.98 and $7.46, monitoring for signs of rejection or bearish structure at these levels.
Bitcoin Correlation
Given CRYPTOCAP:BTC ’s influence on altcoin price action, monitor its key levels closely. A potential corrective move in CRYPTOCAP:BTC could lead NYSE:IP to retest lower supports (e.g., $3.85 or $3.67). Set a secondary alert at $3.85 to watch for a bounce in case of a broader market pullback. Conversely, a stabilization or bullish breakout in CRYPTOCAP:BTC would enhance the likelihood of NYSE:IP ’s bullish setup materializing.
Conclusion
NYSE:IP presents a compelling technical setup, with a ChoCH at $3.67 signaling a potential bullish reversal and $4.28 as the critical level for BoS confirmation. Traders should set alerts at $4.28, await a clean 4H or daily breakout with FVG formation, and execute entries with disciplined risk management. Monitoring CRYPTOCAP:BTC ’s price action is essential to avoid adverse market-wide corrections. This setup offers a high-probability opportunity for significant upside, provided the outlined conditions are met.