BTC Is Still Bearish (4H)Given the structure formed at the price floor (3D), the mitigation of supply zones at the price ceiling, the sellers holding their ground, and the failure to clear key supply areas, the buyers who have pushed the price upward will likely turn into sellers around the red zone. This suggests that a significant drop is ahead.
In reality, the price reaching these levels has not accomplished anything substantial, as no critical zone has been cleared.
The target could be the green box.
Be cautious with your buy/long positions.
A daily candle closing above the invalidation level will invalidate this analysis.
For risk management, please don't forget stop loss and capital management
When we reach the first target, save some profit and then change the stop to entry
Comment if you have any questions
Thank You
Btcanalysis

Bitcoin’s Next Challenge – Can BTC Break the Heavy Resistance?Bitcoin ( BINANCE:BTCUSDT ) started to rise from the Support zone($84,120_$81,500) as I expected in the previous post . The question is, can Bitcoin break the Heavy Resistance zone($93,300_$89,200) and Resistance lines ?
Please stay with me.
Bitcoin appears to have broken through the Resistance zone($87,100_$85,800) and is preparing for its first attack on the Heavy Resistance zone($93,300_$89,200) .
In terms of waves, Bitcoin appears to be completing microwave 4 of microwave C of the main wave Y . The waves structure inside the Ascending Channel appears to be of the Double Three Correction(WXY) .
I expect Bitcoin to prepare for its first attack on the Heavy Resistance zone($93,300_$89,200), the upper line of the ascending channel , the monthly pivot point , 50_SMA(Daily) , and the Resistance lines after completing the pullback to the Resistance zone($87,100_$85,800 ) and fill first CME Gap($86,640_$86,520) . I think the Potential Reversal Zone(PRZ) could be the zone to start a new decline for Bitcoin.
I chose the label of this analysis ''SHORT'' because I think Bitcoin is in a bit of a risky zone for a LONG position, what do you think?
Note: If Bitcoin goes over $91,000, we can expect more pumps.
Note: If Bitcoin falls below $85,200 before hitting the Heavy Resistance zone($93,300_$89,200), we can expect further declines.
Please respect each other's ideas and express them politely if you agree or disagree.
Bitcoin Analyze (BTCUSDT), 2-hour time frame.
Be sure to follow the updated ideas.
Do not forget to put a Stop loss for your positions (For every position you want to open).
Please follow your strategy and updates; this is just my Idea, and I will gladly see your ideas in this post.
Please do not forget the ✅' like '✅ button 🙏😊 & Share it with your friends; thanks, and Trade safe.

What will happen first? BTC to 67k or to 100K?Hey traders! Long time no see.
Looks like Trump and his team won’t be responsible for keeping the market healthy anymore—or maybe they just don’t care right now...
So let’s check some technicals and try to figure out what to expect next.
Not gonna lie, the picture isn’t looking too bright 🥹
Even though we’re moving up a bit, this price action feels more like a bearish flag—meaning we could be setting up for further downside (nervous laugh). Plus, that golden cross on the weekly chart isn’t giving bullish vibes, and volume is confirming our fears.
So… if this plays out, does that mean no bull season for now?
What do you think, guys? Any promising news out there?

Where are we with BITCOIN ? 4hour, Daily and Weekly charts tell I am hearing so many people shouting about "This is it, we are on the way"
It may turn out to be right BUT for me, It seems people are looking at the smaller Time Frames only.
Sure, the main chart here is a 4 hour chart, has been climbing from around 76K ( Told you we would go there )
Looks Lovely and Bullish, though a return to 80K is very possible on the lower trend line
Lets Look at the Daily.
And there it is, Even though on a shorter Time Frame, we seem to be climbing, and we are, it is in fact, all with in a DESCENDING channel
But do not worry, a Bullish sign is that PA does appear to have broken over that Upper trend line of resistance.
We need to wait , probably till next week, to see if this remains Bullish or not.
It is Wise to take note of that Fib Circle that we are coming to in the next couple of weeks. If we get trough, we will hit resistance increasingly from 91K
And so now the weekly - this is a different chart to the Daily
The Bigger picture ALWAYS tells us the reality of the situation. and that is simply that PA is currently on a line of strong Local support (dashed line )
Should this fail, we have strong support below, all the way to 70K.
Be fully aware, this COULD FAIL. We are Mid channel, MACD is still falling Bearish and at current rate of descent, will arrive at Neutral near end of April
The Bullish note is we are still above the 2.272 Fib extension. Sentiment is rising, Selling is Slowing
So in conclusion, we are in a Good place.
PA is becoming stronger and we have support below and PA has remained in "channel" for 3 weeks.
That is NOT Bearish
But we are also NOT in a Bull Run yet.
But, for me, I think we are certainly getting ready/.
As I have said, April may see Volatility, March looks like it may Close GREEN but htis has a week to go yet...
Bullish Caution is what I say - And so expect anther Drop out of this rising channel.
It would present excellent Buying opportunity and reset MACD quicker.
Aere we en-route to the New ATH ? We are getting Near but I still say the stronger probability for The CYCLE TOP ATH that is Early Q4

BTCUSD – Rising Wedge Breakdown Setup | Short OpportunityBitcoin (BTCUSD) is trading inside a rising wedge pattern on the 4H chart—typically a bearish reversal structure. Price is currently hovering near the wedge resistance and a previous supply zone, presenting a clean short opportunity with solid risk-to-reward.
📊 Technical Breakdown
1. Rising Wedge Formation
The price action has formed a clear rising wedge, a pattern often associated with a bearish breakout.
Current price action shows momentum fading near the wedge top, aligning with historical resistance.
2. Key Sell Zone
The 88,600–89,000 region marks an ideal short-entry zone.
This overlaps with a prior consolidation/supply block and wedge resistance—making it a high confluence zone.
3. Bearish Target & Projection
Breakdown of wedge support could drive price down toward the target zone near 78,000, a potential -8.89% move.
This target zone acted as a strong demand area in mid-March and is likely to attract buy interest again.
📌 Trade Plan
Sell Entry: Around 88,600–89,000
Stop Loss: Above 92,923 (beyond wedge + supply zone)
Target: 78,000 zone, prior demand and technical projection
Risk-to-Reward: High conviction R:R setup with structured invalidation
⚠️ Watch for Confirmation
Ideal confirmation would be a strong bearish 4H candle below wedge support or bearish divergence on RSI/MACD.

Bitcoin Following 2013-2017 Fractal UPDATE 2We can see from the chart above that PA has now fallen below the Fractal for the first time since July 2023
This is itself was expected as we can see from previous posts on this Idea
PA was overbought and so HAS to cool off
However, we have targets as to when PA may try and recover.
initially, the circle in End of May was my expected "turn around" point
Things have progressed faster and so now, we have possibilities opening up for a move higher, sooner, maybe around end of April 2925
However until the weekly MACD is on Neutral, these would be short lived - hopefully.
For a sustainable move higher, PA needs to have the ability to maintain the push
the Weekly MACD shown above needs till end of April before any significant move can be maintained. PA has bounced of Neutral previously. But MACD can , obviously, Drop below this point, wait till May, or later, and move then.
For me, the line of the arrow higher is becoming the more realistic ideal path
But the longer we wait, the Steeper the rise has to be to maintain the idea of Cycle ATH in Q4, as per cycle trends.
And to conitnue to follow this Fractal.
The Time WILL come were we break away from this Fractal but as I have been saying for years, we are still on it......many things point towards that continuing.
But as I have mentioned in a post earlier today, These Trends may be changing.
Bitcoin is Maturing
All we can do is watch, react and learn
HAVE A PLAN FOR ALL OUTCOMES but also understand, the idea of Bitcoin collapsing is becoming more and more unrealistic...
The outlook is BULLISH noi matter what
I expect to remain on the fractal path till Next cycle ATH
Time will tell

Bitcoin’s Next Move – Another Attack on Resistance zone?Bitcoin ( BINANCE:BTCUSDT ) fell to $83,400 as I expected in the previous analysis , the question is whether Bitcoin will continue to decline or not.
Please stay with me.
Bitcoin is moving in the Support zone($84,120_$81,500) and near the Support lines . The way Bitcoin has moved and decreased since yesterday until now has been such that it seems that Bitcoin can attack the Resistance zone($87,100_$85,800) at least once more.
In terms of Elliott Wave theory , given Bitcoin’s movements over the past few hours, it appears that Bitcoin is completing a microwave B of the main wave Y .
I expect Bitcoin to be able to attack the Resistance zone($87,100_$85,800) once again and if it breaks, I have marked the next targets on the chart .
Do you think Bitcoin can touch $90,000 again?
Note: If Bitcoin goes below $81,800, we can expect more dumps.
Please respect each other's ideas and express them politely if you agree or disagree.
Bitcoin Analyze (BTCUSDT), 2-hour time frame.
Be sure to follow the updated ideas.
Do not forget to put a Stop loss for your positions (For every position you want to open).
Please follow your strategy and updates; this is just my Idea, and I will gladly see your ideas in this post.
Please do not forget the ✅' like '✅ button 🙏😊 & Share it with your friends; thanks, and Trade safe.

(BTC/USD) – Rising Wedge Pattern - Critical Breakout Setup🔍 Market Overview & Technical Breakdown
Bitcoin (BTC/USD) is currently forming a rising wedge pattern on the 4-hour timeframe, which is a bearish signal indicating a potential reversal. The price action shows higher highs and higher lows, but the narrowing wedge suggests that buying momentum is weakening.
BTC has been battling a major resistance zone around $85,000 - $87,500, struggling to break higher. If Bitcoin fails to hold above the key support level at $80,000, we could see a strong downside move. However, if BTC breaks the upper resistance, the bearish setup may be invalidated, opening the door for a push toward $95,000+.
📉 Rising Wedge Pattern (Bearish Formation)
A rising wedge occurs when the price moves upward within two converging trendlines, making higher highs and higher lows but with a weakening bullish momentum. This pattern often breaks downward, leading to a sharp sell-off.
Characteristics of This Wedge Formation:
✅ Upward Sloping Support & Resistance Lines: BTC is trending higher, but the slope is narrowing, showing a loss of bullish strength.
✅ Decreasing Volume: Volume is declining as price moves higher, indicating buyers are losing control.
✅ Bearish Breakout Probability: Rising wedges typically break down 75% of the time, suggesting a high likelihood of a drop below support.
🔑 Key Levels to Watch
🔺 Resistance Zones (Potential Breakout Levels)
1️⃣ $85,000 - $87,500 → Strong resistance; BTC has repeatedly failed to break above.
2️⃣ $90,000+ → A confirmed breakout would invalidate the wedge and shift the trend bullish.
3️⃣ $107,000 Target → If BTC breaks above resistance, we could see a move toward the psychological $100,000 - $107,000 level.
🔻 Support Levels (Bearish Breakdown Zones)
1️⃣ $80,000 - $82,000 → Key support within the wedge; a breakdown confirms the bearish move.
2️⃣ $75,000 → Strong historical demand zone; BTC could bounce here if it drops.
3️⃣ $70,000 and Below → Ultimate bearish target if selling pressure accelerates.
📈 Bullish vs. Bearish Scenarios
⚠️ Bearish Scenario (Rising Wedge Breakdown)
🔴 Entry: Below $80,000 (confirmed breakdown).
📉 Stop-Loss: Above $83,500 (to avoid fakeouts).
🎯 Take-Profit Targets:
TP1: $78,000
TP2: $75,000
TP3: $70,000
🔹 Confirmation: Look for increased selling volume and a retest of $80,000 as resistance after breakdown.
🚀 Bullish Scenario (Breakout Above Resistance)
✅ Entry: Above $87,500, confirming bullish momentum.
📉 Stop-Loss: Below $85,000 (to minimize risk).
🎯 Take-Profit Targets:
TP1: $90,000
TP2: $95,000
TP3: $107,000
🔹 Confirmation: BTC must break the wedge’s upper boundary with strong volume for bullish continuation.
📊 Technical Indicators & Market Sentiment
🔵 RSI (Relative Strength Index)
Currently near 60 – Showing bullish momentum but not yet overbought.
A move above 70 could signal an overbought market and potential reversal.
🔴 Volume Profile
Volume is decreasing as BTC rises, suggesting a possible exhaustion of buying power.
A breakout should be accompanied by strong volume to confirm bullish strength.
🟢 Moving Averages (EMA & SMA)
BTC is trading above key EMAs (50 & 200), supporting the bullish case.
A breakdown below the 50 EMA could accelerate selling pressure.
📢 Final Thoughts: High-Risk, High-Reward Setup
🚨 BTC is at a critical decision point! The rising wedge pattern suggests a bearish reversal, but confirmation is needed. If BTC breaks below $80K, expect a strong sell-off. However, if bulls manage to break above resistance, BTC could rally toward $100K+.
🔹 Risk Management Tip:
✅ Always wait for confirmation before entering a trade.
✅ Use stop-losses to protect your capital.
✅ Monitor volume & key levels for stronger trade signals.
🔥 What’s your take on this setup? Will BTC break down or push higher? Let’s discuss in the comments! 👇

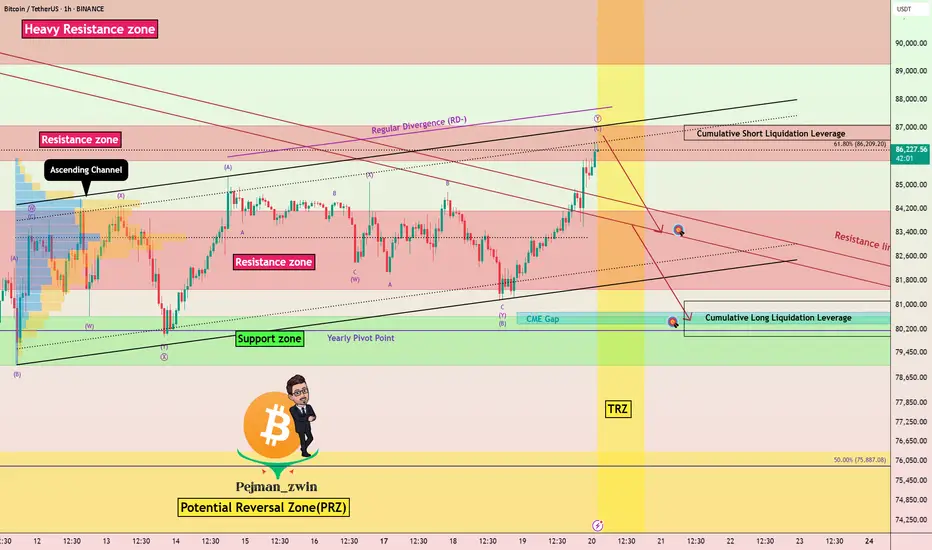
Bitcoin at Key Resistance – Will Bears Take Control?Bitcoin ( BINANCE:BTCUSDT ) started to rise as I expected in the previous posts .
Bitcoin is moving near the Resistance zone($87,100_$85,800) , the upper line of the Ascending Channel , and the Time Reversal Zone(TRZ) .
In terms of Elliott Wave theory , Bitcoin appears to be completing microwave C of the main wave Y .
Also, we can see the Regular Divergence(RD-) between Consecutive Peaks .
I expect Bitcoin to start declining from the Resistance zone($87,100_$85,800) again, the first target could be $83,400 and the second target can be the CME Gap($80,760_$80,380) filling.
Note: If Bitcoin breaks the Resistance zone($87,100_$85,800) we can expect more pumps.
This analysis is in line with the following analysis that I shared with you on the weekly timeframe. 👇
Please respect each other's ideas and express them politely if you agree or disagree.
Bitcoin Analyze (BTCUSDT), 1-hour time frame.
Be sure to follow the updated ideas.
Do not forget to put a Stop loss for your positions (For every position you want to open).
Please follow your strategy and updates; this is just my Idea, and I will gladly see your ideas in this post.
Please do not forget the ✅' like '✅ button 🙏😊 & Share it with your friends; thanks, and Trade safe.
Bitcoin Rising to Fill most recent CME GAP - what then ?We have seen some pretty Good CME Gaps in recent months, a sign of volatility.
And, as I have been saying, CME GAPS ALWAYS GET FILLLED
the proof of that is right here, showing you the recent ones.
So, eight now, we are filling a gap from Below
The question is, what will we do than? Once the Gap is filled at around 86485
I would be a Very rich man if I knew for sure but as I have been saying in a few posts, I do not think PA is fully ready to berak out just yet BUT we may see a push higher to around 90K before it returns to the Low, maybe even to dip lower into the 73K zone.
But, obviously, this may not happen. However, Next time you see a CME Gap, understand it WILL get Filled.
If in a bull run Move, it will remain a gap till a later date, or, as we range as we are now, you can see howe this happens.
The Dips are great buying opportunists
Almost like the Fair Value Gaps ( FVG )
Stay safe

Bitcoin at the D-Point of a Bullish Gartley – What’s Next?Bitcoin ( BINANCE:BTCUSDT ) is currently trading near the Support zone($80,600_$79,000) and Potential Reversal Zone(PRZ) and Support line .
Bitcoin appears to be completing the Bullish Gartley Harmonic Pattern .
Educational Note : The Bullish Gartley is a harmonic pattern that signals a potential reversal in an uptrend after a corrective move. It consists of five points (X-A-B-C-D) and follows specific Fibonacci retracements, with the D-point acting as a key buying zone.
Regarding Elliott wave theory , Bitcoin is completing the microwave B of the main wave Y .
Also, we can see the Regular Divergence(RD+) between Consecutive Valleys .
I expect Bitcoin to rise at least to Cumulative Short Liquidation Leverage . If the Resistance zone($84,130_$81,500) is broken, we can expect further increases in Bitcoin .
Note: If Bitcoin breaks below the Support zone($80,600_$79,000), we can expect further declines.
Please respect each other's ideas and express them politely if you agree or disagree.
Bitcoin Analyze (BTCUSDT), 1-hour time frame.
Be sure to follow the updated ideas.
Do not forget to put a Stop loss for your positions (For every position you want to open).
Please follow your strategy and updates; this is just my Idea, and I will gladly see your ideas in this post.
Please do not forget the ✅' like '✅ button 🙏😊 & Share it with your friends; thanks, and Trade safe.

BTC ANALYSIS (4H)Given the reduced downward momentum, the bullish Ichimoku on the chart, and the formation of support zones, Bitcoin is expected to move toward the identified supply level.
Currently, the price is in a discount zone, and an upward move toward premium levels is anticipated.
A 4-hour candle closing below the invalidation level will invalidate this setup.
Do not enter the position without capital management and stop setting
Comment if you have any questions
thank you

A possible scenario for Bitcoin over next 2 monthsI do think this has a Strong possibility of happening
MARCH will close as a RED Candle and the statisical expectation is that April will close GREEN and yet there are many reasons why Bitcoin Cannot rise a lot in April to make that Green
SO, We may see March drop down to the 74K area to end the month
This Gives PA the ability to Rise, hit that trend line and still Close the month GREEN and then take off in May.
Why May ?
Because that descending trend line perfectly matches the Weekly MACD decent and the date is when MACD reaches Neutral. Begining of May.
This is also why PA will likely be rejected from the Trend line before MAY
Should PA remain where it is now, it doesn't give a lot of room for April to close Green.
This really is just an Idea so we just need to see if it happens.
I do have a SPOt buy order sitting at 74779 just in case lol

Bitcoin Index-3 Strength index. Tells us what ? Bull Or Bear ?This post will include the same chart as a Month, Weekly, Daily and 4 hour
The 3 indicators are
RSI - RSI, or Relative Strength Index, is a momentum oscillator used in technical analysis to identify overbought or oversold conditions in the price
TSI - The True Strength Index indicator is a momentum oscillator designed to detect, confirm or visualize the strength of a trend. - the True Strength Index (TSI) does show trend direction.
ADX - the Average Directional Index (ADX) shows the strength of a market trend, NOT its direction. The base line is 25 - Above is strong trned, below is weaker trend
ADX is Yellow - DI + is orange ( positive price index) - DI - is Red ( Negative price index
MONTHLY
The main chart is the monthly chart - the vertical lines Mark Years
Note how ATH's are all Above the Rising upper trend line.
From the Left,
2013 ATH - Note how RSI and TSI both peaked BEFORE ATH, as did the DI+ on the ADX indicator. The ADX itself turned down Later
2017 ATH saw a similar pattern
2021 was slightly different. RSI and TSI peaked on the March ATH but the true cycle ATH was in Q4 ( Nov) , as are most BTC Cycle ATH - Note the sudden drops in both ( probably due to deleveraged)
The DI+ on the ADX did the same but note how the ADX itself peaked in NOV - The ADX seemingly being more accurate on showing us Cycle Top by Trend.
Currently,
The RSI has not entered Fully OVERBOUGHT as in previous cycles. Has Fallen below Overbought entry line in recent weeks. Maybe leveling out
TSI ( orange) is falling since Jan, showing a bearish trend - Falling towards its own average.. PA has been falling in this time.
ADX has also slowed and flatten out, showing a weakening of trend. NOTE - ADX does not show us Trend direction...So, in recent months, we have seen a DROP in PA.
Weakening of this trend could be pointing towards a reversal ?
Also look at the orange DI+ line in ADX....It is getting Lower on each ATH, harder to move higher as Price increase makes BTC harder to move
THE WEEKLY begins to show us more info
This starts to get interesting here
Note that in 2021, It was as we saw in the monthly Except the ADX fell after the March ATH and did not rise again untill half way through 2021 when the Bear Kicked in Fully. The ADX here is showing the strength of that Bear Market as Luna, FTX and 3 arrows collapsed.
The RSI and TSI remained flat Till Jan 2023, when we saw PA beginning to recover. Notice I said RECOVER. I said it at the time and I say it again..Jan 2023 till September was recovery from avery deep Bear market. This is backed up by the fact that the ADX remained Flat untill Late August 2023. Showed No TREND
Then we saw ADX rise, TSI rise off Neutral and RSI begin to head towards Overbought.
All 3 then Dipped in Mid 2024, Rose again to End of 2024 and since then, we have seen the RSI and TSI drop below their averages, head to Neutral
ADX continied to rise as DI+ Dropped, showing us this was a Bearish Trend after all.
However, since beginning of March, the ADX has been showing a weakening of this trend. Still Bearish as the rise in DI - shows, but it is getting weaker.
DAILY begins to show us what could be heading for a new trend, maybe
BTC PA dropped since Feb as did the RSI and TSI, though they have recently stopped doing that and have tried to bounce but still remain below Neutral.
The reason for this is shown in the ADX that has continued to rise untill March, Keeping that Bearish trend Active and strong. This is confirmed by the DI - ( red ) being above the DI +
Even though this trend has weakened, DI + remains flat showing that a change in trend does not appear to be happening to quickly.
Note how the ADX has turned and is beginning to rise higher as the TSI and RSI flatten out
Hpwever. DI - also remain flat.
Change could be near. It is not happening yet but......
The 4 hour chart is full of Noise but given whet we just seen, it may be relevant to see it
It is Volatile but we can see on BTC PA how PA slowed its drop from March and has ranged with a reducing high Low.
We can see how the RSI and TSI rose, dipped and Rose to their current positions near Neutral.
We can see on the ADX, in the centre , was the Last Bearish push, BTC PA Dropped sharply but the trend weakened quickly. the Bears are getting tired.
We see the attempt by the BULLS around the 11 march to push PA higher.
This failed..but showed us the bulls are still here.
The Fact that the ADX is below the DI lines is a sign that a Trend no longer exists or is very weak
The previous Bearish Trend is possibly exhausted.
We have signs that Price recovery is possible from here though I think we will wait a bit longer before we see it.
My conclusion is that we maybe seeing the beginning of a change , a reversal, but it may take a little while before we see the Fruits fully. Possibly up to 5 - 6 weeks or more.
The shorter term data shows we could make a push to top of range ( or near) but that could get rejected.. We need more strength for the long term
But I suggest you read this, look at these charts and make up your own mind.
Because they are hard to read in many ways, Trends can spring up any time, in any direction.
We can only look at them and think..
I wish you well

Bitcoin Market Cap Breakout Potential | Bullish SetupThis 1-hour chart for the Bitcoin market cap ( CRYPTOCAP:BTC ) suggests a potential bullish breakout.
🔹 Major Support: The price recently tested and respected a strong support zone, indicating buyers are stepping in.
🔹 Triangle Formation: A symmetrical triangle is forming, which typically leads to a breakout.
🔹 Weak High & ATH Target: If the breakout occurs, the market cap could push past previous highs, targeting the 1.88T level and beyond.
🔹 Bullish Scenario: A successful breakout above the triangle’s resistance may trigger an uptrend towards the weak high, followed by an attempt to reach new all-time highs (ATH).
💡 Key Levels to Watch:
Support: 1.65T
Breakout Confirmation: 1.66T+
Target: 1.88T
This setup suggests a bullish continuation, but a failed breakout could lead to a retest of support. Keep an eye on volume and momentum for confirmation.
What are your thoughts? Will BTC market cap break out soon? 🚀📈
#Bitcoin #BTC #Crypto #Trading #TechnicalAnalysis

Bitcoin under 40k? Possible, but is this also probable?In life, anything is possible , and when it comes to crypto, everything is possible .
But, as I mentioned in my educational post yesterday, there’s a big difference between what is possible and what is probable.
In this article, I want to analyze the possibility of Bitcoin dropping below $40,000 and more importantly, what would need to happen for this scenario to shift from just possible to truly probable.
________________________________________
BTC — From All-Time High to Distribution?
If we look at the Bitcoin chart, we notice that after the first all-time high very close to $100,000 at the end of November, the market began a consolidation phase.
Although we saw two more all-time highs — one around $108,000 in mid-December and another near $110,000 in January — the entire structure from late November to late February appears to be a distribution pattern rather than a healthy continuation.
Once Bitcoin broke below $90,000, we can consider this distribution phase complete, with a target for short positions around $75,000 — a level I’ve highlighted in my previous posts.
________________________________________
Long-Term Logarithmic Chart — Diminishing Returns and the Bigger Picture
Looking at the long-term logarithmic chart, we can see a clear pattern of diminishing returns:
• The first major leg up, starting in late 2011, was approximately 600x and lasted about two years, followed by a correction.
• The next leg was 100x, spanning four years, followed by another correction.
• Then, a 20x rally, which lasted just over a year.
• Finally, the most recent leg up has been around 7x.
What’s crucial here is that returns are decreasing and, even more importantly, the last leg up looks more like an ascending channel than a parabolic move like in previous cycles.
________________________________________
The Significance of the Ascending Channel
This ascending channel is not unusual — the market has matured, and big players are now involved, reducing volatility.
However, ascending channels on the long-term often signal potential reversals, rather than continuation.
________________________________________
What Would Make $40,000 Probable?
Now, let’s address the real question: What would need to happen for Bitcoin to drop to $40,000?
Zooming in on the logarithmic chart, it becomes evident that the $72,000 - $75,000 zone is a major support confluence.
If this area is broken — meaning a weekly candle closes below this level — the scenario of BTC dropping toward $40,000 becomes probable.
The target zone I’m watching in this case is $32,000 - $36,000, a strong historical support that is clearly visible on higher timeframes.
________________________________________
Conclusion — Watch the Key Levels, Not What you Hope
To conclude:
• Bitcoin dropping to those extreme levels is possible, but not yet probable.
• Probabilities will shift only if key support levels are broken — specifically $72k-$75k.
• The market has matured, cycles are changing, and returns are diminishing, so expecting a repeat of past parabolic runs may not be realistic.
• As traders and investors, we must focus on the charts and key levels, not on hopium and hype.

BITCOIN TRENDS with Heiken Ashi candles & Trend indicator ADX Why HEIKEN ASHI Candles ?
Heikin Ashi is a charting technique that can be used to predict future price movements. It is similar to traditional candlestick charts. However, unlike a regular candlestick chart, the Heikin Ashi chart tries to filter out some of the market noise by smoothing out strong price swings to better identify trend movements in the market. ( Source TradingView )
What is ADX ?
The ADX indicator measures trend strength without indicating direction. It is derived from the Positive Directional Movement (+DI) and Negative Directional Movement (-DI):
+DI (Positive Directional Index): Measures upward price movement.
-DI (Negative Directional Index): Measures downward price movement.
ADX Value: Higher values indicate stronger trends, regardless of direction.
( Source TradingView)
To summarise, Heiken Ashi candles filter out Noise and help identify Trend Direction
ADX shows you Trend Strength - NEVER the direction of Trend, using prince index.
OK, so now we ready. The main chart has 2 Vertical Bold lines that will be explained in a Bit but Note where they are on the Chart
The one on the left is near where the Rise in PA turns and becomes a Ranging PA- PA slowed right on that line.
The 2nd line is near the TOP and before the point where PA entered a descending channel that leads us to where we are currently
Note on the chart, the Orange dotted line. This is the BASIS line of the Bollinger bands. This is The Basis line and shows us the Average of PA and, as you can see, we are currently below Average. This shows a Negative Trend.
See how PA is above the basis line in a Positive Trend
Also note in the chart how the lines of candles are Smoother. Each New candle begins on the centre line of the previous and so it becomes a Lot easier to see if PA rises or drops from previous with out the Jagged Noise of traditional candles. - Taller candles show more Strength than previous;
So now to the ADX Chart
See those 2 Dashed Vertical lines and note how the ADX ( YELLOW ) changes direction at those points.
To remind you, the Left one was where BTC PA Slowed down from a Steep Rise, A BULLISH TREND, and turned to Ranging.
The Drop in the ADX at this point showed us that the previous trend was weakening. I remind you, it DOES NOT SHOW TREND DIRECTION even though, in this case, they follow each other.
PA Ranged horizontal on average till we met the Next line, where the previous Trend Strength had reached Neutral ( Note, this is around 20 on the ADX scale )
At the next dashed lime. ADX began rising. Trend strength was increasing.
Initially, we saw BTC PA rising to a New ATH and so, it was easy to assume that the Trend Was Bullish again. However, as we see now, it turns out it was a BEARISH trend.
So how do we know when this is going to end ?
The ORANGE line DI+ ( positive price action ) and the RED DI - ( Negative price action ) can help
These are Price Direction index. When DI + rises, this indicates a positive price action and Visa Versa for DI -
On its own, this is not easy But, for instance, notice how while we been in the descending channel, the DI+ dropped while the DI- has ranged along the 20 line on average.
This indicates a controlled Drop in PA and NOT a Full on Bearish capitulation. There is strength there in PA and this can be seen by the Slow rise of the ADX
On a shorter time scales, over the last 5 days we have seen PA rise in price.
this is reflected more in the DI- dropping ( Negative price action loosing strength ) more than in the DI + remainf horizontal.( NOT gaining Strength )
This could indicate that we are not finished Dropping yet - and yet, at the same time, we see the ADX weakening.
The Bears maybe getting Tired.
If we now return to the Chart
This fatigue we maybe seeing in the Bears could be reflected in the simple fact that we are now Near a long term Rising line of Support ( bold line) and that we are nearer the lower line of the descending channel ( also support) - We are also very near the 2.272 fib extension that has proved to be support previously.
The upper bollinger band is around 90K, which happens to be near Top of current range.
So, we may see a push higher soon but we need to understand that the Longer term still Looks like we will continue in the Range Bound for a Few more weeks.
I hope this helps but be prepared for anything

Bitcoin 50 SMA time snaps and Low to ATH since 2014 - UPDATEIn a similar vein to the chart posted earlier today about the patterns between the 50 and 100 SMA, this post is using the 50 SMA ( RED) and the time spent above and below PA.
Alongside this, we have the day counts for PA LOW to PA ATH since 2014
After 2013 ATH and once the 50 SMA dropped below PA, it spent 399 days below PA
After 2017 ATH and once the 50 SMA dropped below PA, it spent 329 days below PA
After 2021 ATH and once the 50 SMA dropped below PA, it spent 420 days below PA - This is an impressive stat as it includes the Deep Bear that we experienced after the Luna, 3 Arrows & FTX crashes, includes the raising of interest rates and the utter presecution by Banks and SEX in the USa.
The fact that the drop below PA was only extended by 35 days ( average) Max shows a strength in Bitcoin sentiment. It could NOT be broken
In 2015, once the 50 SMA has risen above PA, it remained there for 938 days
In 2019, once the 50 SMA has risen above PA, it remained there for 1001 days
In 2023, once the 50 SMA has risen above PA, we have been above for 756 days of an expected average projection of 966 days
This projects that PA will Drop Below the 50 SMA in about October 2015, After the ATH as previously.
This points towards an ATH in Q4 - this has some confluence with the previous post though open to suggestion.
Next is the simple PA LOW to ATH and Back to LOW day counts
2013 ATH to Cycle Low was 665 days then 847 days to Cycle ATH
2017 ATH to Cycle Low was 350 days then 1064 days to Cycle ATH
2021 ATH to Cycle Low was 378 days then, using the average of the two previous day Count from Low to ATH, gives us 952 days to Cycle ATH
This puts an ATH in JUNE 2025 !
I do not think this is realistic in anyway however, Anything is possible currently.
I do however think that June is about when PA could seriously begin to make Moves higher, with intent to reach a Cycle ATH.
The reason being, the weekly MACD will have reached Neutral by then ( if not in mid May )
So while this chart offers some confluence to other ideas, it also offers another ATH date that is way earlier than any previous cycle ATH - While I feel this is unlikely to happen, we Must keep open minds.. the adoption of BTC by main stream now may well accelerate the PA cycle.
We shall wait and find out.
Be prepared for ALL occasions....including the arrival of an early Bear. - THAT will be in another post, at some point soon
Stay safe

BTC/USDT#BTC's possible bottom is in.
- took support on a long-term weekly trendline.
-bounced off the 50-week Ema support.
-W.D. Gann's 14th march reversal date

Bitcoin is ABSOLUTELY under Pressure - It MUST react before DECI have been looking at this in detail for some time and have decided to change how I calculate things and here is the result.
There are 2 things of Massive importance to see here.
First is that Curve that PA has been under since 2010
The Lower Dashed Line is the Trend line formed in 2011. It is Strong and it is Valid and PA is currently running along it.
Here is a closer image to show you where we are in relation to it right now. Directly below PA currently, we hit that line around 67K
The Apex of this "Triangle" is December THIS YEAR
PA Has to break Above that Arc, the same Arc that has Rejected PA EVERY TIME since 2011
BUT THIS TIME IS DIFFERENT - IT HAS TO BE and here is why
I am not going to explain the % increase each Cycle Low to ATH, it is in the chart but I do want to show you this,
The first real push of Bitcoin was a massive % rise that created the ATH that formed the 1st point of the Lower Trend line of the New channel. This is A on the chart
The Next push was to B. This push was 1.433% of the Original push A - smaller by a long way in % terms.
These 2 moves created the channel that PA has remained in ever since. ( see dashed upper trend line)
From this point on, we can see that each cycle push , while in channel, has been approx 20% of the previous rise. Or around 1/5 of the size in % terms
Or to put is another way, Each Rise has been a diminishing % rise from previous.
Look at that curve. It has pushed PA down each cycle ATH
This cycle, we are currently at 26.7% of the previous push ( to 2021 ATH ) and it has created a cycle ATH currently.
But is the cycle Over ? - Hopefully NOT
Because if it is NOT over, we need to break through that Curve of resistance by December.
The Much expected 200K ATH is way over that curve and would result in a 55% of previous push rise. That would break the "trend"
This is VERY Different. But Absolutely required.
So, the question that should be on Everyone's lips is "Which is stronger ? The line or the Arc ?"
My expectation is that we will break through. That Arc has been a Major part of the formative years of Bitcoin PA but now, it could prove detrimental. Because, if we do not break through it, It will push Peice DOWN, through that line of Long term support.
We do not want that
SO, Maybe THIS is why the Bulls are waiting for the Weekly MACD to reset to Neutral...PA Needs the strength to break through.
So, Go Buy your Local BULL a Beer ( or white wine lol ) and Lets get on.
Watch this Close. It really is more important that Trumps Reserve, Saylors Love nest or Bezos after burners.................

Bullish Quasimodo in Play – Bitcoin’s Next Target: $84,500?Bitcoin ( BINANCE:BTCUSDT ) attacked the Resistance zone($84,130_$81,500) again as I expected yesterday . Has Bitcoin given up or is it gathering momentum to attack the resistance zone again? What do you think?
Bitcoin is moving near Yearly Pivot Point and Cumulative Long Liquidation Leverage($80,537_$78,390) .
From Elliott Wave theory , Bitcoin appears to be completing an Expanding Flat(ABC/5-3-5) corrective wave .
According to the Price Action , Bitcoin appears to be completing the Bullish Quasimodo Pattern .
Educational Note : The Bullish Quasimodo Pattern is a reversal pattern that signals a potential uptrend after a downtrend. It forms when the price creates a lower low followed by a higher high and a higher low, confirming a shift in market structure.
I expect Bitcoin will NOT leave the CME Gap($86,400_$84,650) unfilled and will rise to at least $84,500 .
What do you think, will Bitcoin leave this CME Gap($86,400_$84,650)?
Note: If Bitcoin falls below $78,800, we should expect further declines.
Please respect each other's ideas and express them politely if you agree or disagree.
Bitcoin Analyze (BTCUSDT), 1-hour time frame.
Be sure to follow the updated ideas.
Do not forget to put a Stop loss for your positions (For every position you want to open).
Please follow your strategy and updates; this is just my Idea, and I will gladly see your ideas in this post.
Please do not forget the ✅' like '✅ button 🙏😊 & Share it with your friends; thanks, and Trade safe.

Bitcoin Tests Resistance: Will the CME Gap Get Filled?Bitcoin ( BINANCE:BTCUSDT ) continued its downward trend as I expected in the previous post , but over the past 12 hours , Bitcoin has started to increase from Potential Reversal Zone(PRZ) . The question is whether this upward trend will continue in the past few hours or not !?
-------------------------------------------------------------------------
JOLTS Job Openings & Its Potential Impact on Bitcoin
The JOLTS Job Openings report will be released today, March 11 . It provides key insights into the U.S. labor market . This data can influence the Federal Reserve’s monetary policy stance , impacting risk assets like Bitcoin.
Potential Impact on Bitcoin :
Higher-than-expected job openings : Signals labor market strength, increasing the likelihood of Fed tightening → Bearish for Bitcoin
Lower-than-expected job openings : Suggests labor market weakness, increasing the odds of rate cuts → Bullish for Bitcoin
Historical Influence :
In previous months, JOLTS data has triggered volatility across financial markets, including crypto. For instance, a sharp decline in job openings last year led to a weaker dollar and Bitcoin rally. Conversely, stronger-than-expected job numbers have reinforced hawkish Fed expectations, pressuring Bitcoin.
I believe there's a higher probability that the JOLTS report will come in weaker than expected, which could lead to a short-term rally in Bitcoin and gold. However, if the report is stronger than anticipated, we might see temporary selling pressure in the market. What is your idea!?
Today's positive news was " Trump Plans Order to End Crypto Banking Restrictions ". In general, Trump's statements no longer affect the crypto market as much as before. Do you agree with me?
-------------------------------------------------------------------------
Now let's take a look at the Bitcoin chart on the 1-hour timeframe and use technical analysis tools .
Bitcoin is moving in the Resistance zone($84,130_$81,500) and near the 200_SMA(Daily) .
According to Elliott Wave theory , Bitcoin has completed five down waves , and we should wait for the next up waves . One of the signs of the end of wave 5 is the presence of a Regular Divergence (RD+) between two consecutive valleys .
According to the above explanation , I expect Bitcoin to re-attack the Resistance zone($84,130_$81,500) after a downward correction and attempt to fill the CME Gap($86,400_$84,200) .
Note: If Bitcoin can move above $87,200, we can expect the start of an uptrend.
Note: We should expect a bigger drop if Bitcoin falls below $72,000.
Please respect each other's ideas and express them politely if you agree or disagree.
Bitcoin Analyze (BTCUSDT), 1-hour time frame.
Be sure to follow the updated ideas.
Do not forget to put a Stop loss for your positions (For every position you want to open).
Please follow your strategy and updates; this is just my Idea, and I will gladly see your ideas in this post.
Please do not forget the ✅' like '✅ button 🙏😊 & Share it with your friends; thanks, and Trade safe.

Powell’s Speech & Bitcoin’s Decline: Is More Downside Ahead? Today, Fed Chair Jerome Powell is set to speak, and traders should brace for potential market volatility! Given the recent economic data , his tone is likely to be balanced but leaning hawkish .
Why a More Hawkish Powell?
1- Strong Job Market :
Unemployment Rate : 4.1% (Still low)
Non-Farm Payrolls (NFP) : 151K (Decent, but lower than before)
Average Hourly Earnings : 0.3% (Steady wage growth)
This suggests that the labor market remains resilient, which might discourage the Fed from cutting rates too soon.
2- Inflation Still a Concern :
Wage growth and inflationary pressures persist, which means Powell may emphasize keeping rates steady longer to combat inflation.
3- Markets Are Too Optimistic on Rate Cuts :
Investors are heavily betting on rate cuts in 2024, but Powell may push back against these expectations to prevent excessive risk-taking.
Powell will likely maintain a cautious yet hawkish stance to manage expectations. Big price swings are expected across forex, crypto, and commodities—so stay alert! (Of course, this is just a personal analysis).
In addition to Donald Trump , Signs Executive Order to Create Bitcoin Strategic Reserve
Of course, today, we didn't see any strange movement in Bitcoin, and probably, the proverb " buy the rumor, sell the news " was fulfilled.
----------------------------------------------------------
Now let's take a look at the Bitcoin chart on the 1-hour time frame and also take help from technical analysis tools .
Bitcoin ( BINANCE:BTCUSDT ) is in a Heavy Resistance zone($93,300_$89,250) and has started to decline from Potential Reversal Zone(PRZ) .
From a Classic Technical Analysis , Bitcoin appears to move in a Symmetrical Triangle .
According to Elliott Wave theory , Bitcoin has completed the Double Three Correction(WXY) , and we should wait for the next bearish wave .
I expect Bitcoin to attack 200_SMA(Daily) again after breaking the lower line of the Symmetrical Triangle .
Note: Bitcoin is likely to pump more if the symmetrical triangle's upper line breaks.
Please respect each other's ideas and express them politely if you agree or disagree.
Bitcoin Analyze (BTCUSDT), 1-hour time frame.
Be sure to follow the updated ideas.
Do not forget to put a Stop loss for your positions (For every position you want to open).
Please follow your strategy and updates; this is just my Idea, and I will gladly see your ideas in this post.
Please do not forget the ✅' like '✅ button 🙏😊 & Share it with your friends; thanks, and Trade safe.
