₿itcoin: ATHBitcoin recently marked a new all time high. Our primary expectation is for an even bigger breakout to the upside, allowing green wave B to reach its peak within the upper blue Target Zone between $117,553 and $130,891. After this corrective high, we anticipate a sharp sell-off during green wave C, which should drive Bitcoin down into the lower blue Target Zone between $62,395 and $51,323—where we also expect the low of the larger orange wave a. This move should, for now, signal the start of another corrective rally along orange wave b, with a retest of the freshly marked all-time high well within reach. Once this countertrend move concludes, another significant decline should follow as orange wave c develops, targeting the low of the higher-level blue wave (ii). Alternatively, there remains a 30% chance that the preceding wave alt.(i) is still in progress, which could result in a direct breakout above resistance at $130,891.
📈 Over 190 precise analyses, clear entry points, and defined Target Zones - that's what we do.
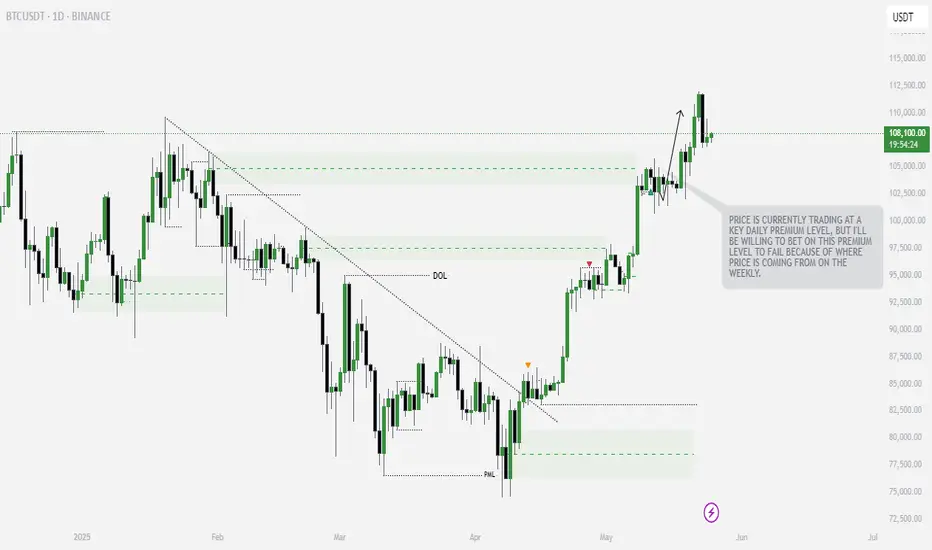
Btcath

Bitcoin Dominance, BTC ATH and ALT Seasons since 2017-some facts
There is little doubt now, that this Crypto cycle is very different from previous cycles and the main reason for this is the Bitcoin Dominance ( BTC.D) of the Market.
The reasons for this Dominance is complicated but we can certainly point towards the arrival of ETF's as one of the principle factors.
Corporations simply Buy Bitcoin, Hold it and Trade the ETF's - The Key Principle here being that the Coins are HELD Long term.
As we can see from the main chart, we have a key point in the BTC cycle called the Bitcoin Halving. To many extents, the explanation of this is not relevant right now.
But what you can see is how, previously, after the BTC Halving, we saw a drop in BTC.D,
This was due to the money Flow out of BTC and into ALT coins.
As more ALT coins were bought up, the demand drove the price higher and so their dominance increased, driving BTC.D down
This has not happened this cycle due to bulk buying of BTC for ETF's and BTC being Held Long term.
We can also see how , as we approached a certain time span After the Halving, we saw a sharp rise in BTC.D as we headed towards the next BTC ATH as the BTC buying picked up.
Again, this is not happening this cycle as the Bitcoins are being held long term.
What we can also see on the main chart is how we would normally be approaching a period of expected BTC ATH ( green vertical box )
And the HUGE question is, Will we get a Bitcoin ATH in this period ?
This is, to many extents, impossible to answer but as demand for Bitcoin continues and coins become harder to find, the price should continue to rise.
The tricky bit is, now, with a Bitcoin costing over 100K usd, it becomes harder to move the price. Only Corporations can afford to bulk buy.
So, again, things are different.. Retail is struggling to find a foot hold in the Bitcoin market, seeming to think that a Bitcoin is too expensive for them.....forgetting that they can buy a bit and that will also increase in price by the same %.
And so they look to the ALTs, fast volatile price rises and high returns,
This is seen very clearly in this chart that shows us when we had previous ALT seasons after the Halving
See how, after a period of time after Halving, the ALT Seasons appeared when the BTC.D dropped.
And that has simply just NOT happened this time.
It has to be said, it did try to appear. ALT season tried to happen.
See how after 210 days after halving this cycle, BTC.D did drop sharply but, it found a line of support and bounced back, Killing the ALT season dead in its tracks
There have been a lot of attempts since but the Market has been Bloody for ALTS, with sharp rise and Falls destroying confidence..... And Bitcoin continues to Rise.
So, where are we now ?
This Daily BTC.D chart may offer some ideas
BTC.D PA is currently at TOP of long Term range and finding it hard to get over that line of resistance.
BTC.D Weekly MACD , while not overbought, is curling over Bearish
BTC ATH's have previously been attained from Oversold areas as MACD Rose back higher.
The Volatility has gone and MACD is ranging smooth
SO, in conclusion, it is anybodies Guess right now if we will ever see an ALT season again.
Technically, on many fronts, we are poised, ready for it, even if it is a mini one.
But as we have seen on many occasions this cycle, Bitcoin is a very desired asset now and Demand drives price.....and so the Sell off that we need to drive an Alt season just may not occur.
One thing that is Absolutely certain though, we are highly likely to see another Bitcoin ATH
Stay safe everyone and Love one another. It is Free to do and is worth more than anything

02/06/25 Weekly OutlookLast weeks high: $110,718.68
Last weeks low: $103,065.74
Midpoint: $106,892.21
As we approach the middle of the year, Bitcoin is back above $100,000 despite pulling back from a new ATH of $112,000. In the month of MAY BlackRocks ETF had record inflows of over $6B propelling prices 11% higher.
Last week we saw as the month closed and with that it's natural to have a window dressing period that usually leads to de-risking slightly. BTC stayed within the previous weeks range and maintains the pattern of:
Chop/consolidation --> expansion to the upside --> chop/consolidation...
However in this case the consolidation week had a much larger range than in the past which is a sign to me that the rally is exhausted for now. It's because of this I feel we may see a weekly low break for the first time in a month and get a more meaningful pullback than we've seen since early April. My target would be around the $97,000 area.
The case for the bulls is still a convincing one despite some red flags. Record ETF inflows continue to pour, M2 money supply continues to grow and a general shift to risk-on assets is clear. However these are longer term factors and just for this weeks outlook the momentum is with the bears briefly.

BTCUSD - NEW ATH!MARKET REVIEW
My previous analysis was proven right but i ended up taking 2 losses be the Buys actually happened. This only tells you that analysis isn't all there is to trading, you have to be right also with your Timing & Execution.
Phemex Analysis #82: BTC Breaking the $110,000 All-Time-High!Bitcoin ( PHEMEX:BTCUSDT.P ) has reached a new all-time high, surpassing $111,000, driven by strong institutional inflows, regulatory clarity, and macroeconomic factors. This surge follows our previous analysis , where we anticipated a potential breakout above the $105,000 mark. The current rally is fueled by increased demand from institutional investors, favorable regulatory developments, and concerns over traditional financial markets.
Possible Scenarios
1. Testing $120,000
With momentum on its side, Bitcoin could aim for the next psychological resistance at $120,000. Institutional interest, as evidenced by significant ETF inflows and corporate investments, supports this bullish outlook. Technical indicators, such as the "golden cross" pattern, also suggest continued upward momentum.
Pro Tips:
Monitor trading volume and market sentiment for signs of sustained bullishness.
Set stop-loss orders to protect against sudden reversals.
2. Rejection and Retest of $100,000 Support
After reaching new highs, Bitcoin may experience a pullback to test the $100,000 support level. This consolidation could be a healthy correction before the next leg up.
Pro Tips:
Watch for buying opportunities near the $100,000 support zone.
Be cautious of false breakouts and wait for confirmation before entering new positions.
3. Bearish Reversal Due to U.S. Treasury Bonds News
Rising U.S. Treasury yields and fiscal concerns have led to increased volatility in traditional markets. A significant shift in investor sentiment could trigger a bearish reversal in Bitcoin's price.
Pro Tips:
Stay informed about macroeconomic developments, particularly U.S. fiscal policies and bond market movements.
Long-Term Accumulation: For investors with a longer-term perspective, significant price dips near lower supports—such as $92750, $83000, or even $66810—could represent attractive opportunities to accumulate BTC at discounted valuations.
Conclusion
Bitcoin's recent surge past $110,000 marks a significant milestone, reflecting growing institutional adoption and favorable market conditions. While the bullish trend may continue, traders should remain vigilant and prepared for potential corrections or reversals influenced by macroeconomic factors. Employing sound trading strategies and staying informed will be key to navigating the evolving landscape of Bitcoin's price movements.
Pro Tips:
Armed Your Trading Arsenal with advanced tools like multiple watchlists, basket orders, and real-time strategy adjustments at Phemex. Our USDT-based scaled orders give you precise control over your risk, while iceberg orders provide stealthy execution.
Disclaimer: This is NOT financial or investment advice. Please conduct your own research (DYOR). Phemex is not responsible, directly or indirectly, for any damage or loss incurred or claimed to be caused by or in association with the use of or reliance on any content, goods, or services mentioned in this article.

BTC - NEW ATH on the HorizonBitcoin has surprised us with a sudden turnaround over the past two weeks.
✅ Technical indicators are bullish
✅ Candle stick patterns are bullish
✅ Trendlines are bullish
I can't help but come to any other conclusion - BTC is now BULLISH, likely making it's way to a new ATH.
This will bring about my much anticipated ALTSEASON:
_________________
BINANCE:BTCUSDT

Bitcoin Monthly compared to Historical Cycle Tops-UPDATE $400K ?
Keeping this simple
PA is on the 3rd of 3 Candles below that Threshold line. The comparison is the same position back in 2017 ( left Arrow ), Same Months, same position and also in the 4th year of the Cycle.
Now, I will say, I am one of the many that are saying "this time is different" and yet, when we see this.....well....Is it ?
We will find out in time but for now, Lets follow the chart, as we Must......Charts Never Lie
SO, for that Green candle to touch the threshold line, we are looking around the current ATH and then, when MAY comes in, we need to stay above.
Now, The monthly Candle Colours charts I post, mentioned, that if April closes Green, May has a High Percent chance of also doing that.
We have to wait and see - 1 Week to go till April closes.
As you can see, historically, The year with the Green Box is the year we go to ATH and above the upper trend line, with the ATH on or above that dashed line.
This puts this cycle ATH around, or above, $400K !
That is near Twice my current projection.
Is this time different. ?
There is a chart I have that explains how Bitcoin has been under an Arc od resistance since it's crea\ion and This is something that could keep PA down to the 250K ATH that is expected by so many
The chart is Below, it exoplains itself
So, the next 6 weeks are Pivotal to how this cycle will play out, with one of two ATH zones available.
But more importantly, Bitcoin PA NEEDS to break above and away from that Arc of resistance....and THAT WOULD MAKE THIS TIME DIFFERENT
Enjoy the ride guys and Gals

Where are we with BITCOIN ? 4hour, Daily and Weekly charts tell I am hearing so many people shouting about "This is it, we are on the way"
It may turn out to be right BUT for me, It seems people are looking at the smaller Time Frames only.
Sure, the main chart here is a 4 hour chart, has been climbing from around 76K ( Told you we would go there )
Looks Lovely and Bullish, though a return to 80K is very possible on the lower trend line
Lets Look at the Daily.
And there it is, Even though on a shorter Time Frame, we seem to be climbing, and we are, it is in fact, all with in a DESCENDING channel
But do not worry, a Bullish sign is that PA does appear to have broken over that Upper trend line of resistance.
We need to wait , probably till next week, to see if this remains Bullish or not.
It is Wise to take note of that Fib Circle that we are coming to in the next couple of weeks. If we get trough, we will hit resistance increasingly from 91K
And so now the weekly - this is a different chart to the Daily
The Bigger picture ALWAYS tells us the reality of the situation. and that is simply that PA is currently on a line of strong Local support (dashed line )
Should this fail, we have strong support below, all the way to 70K.
Be fully aware, this COULD FAIL. We are Mid channel, MACD is still falling Bearish and at current rate of descent, will arrive at Neutral near end of April
The Bullish note is we are still above the 2.272 Fib extension. Sentiment is rising, Selling is Slowing
So in conclusion, we are in a Good place.
PA is becoming stronger and we have support below and PA has remained in "channel" for 3 weeks.
That is NOT Bearish
But we are also NOT in a Bull Run yet.
But, for me, I think we are certainly getting ready/.
As I have said, April may see Volatility, March looks like it may Close GREEN but htis has a week to go yet...
Bullish Caution is what I say - And so expect anther Drop out of this rising channel.
It would present excellent Buying opportunity and reset MACD quicker.
Aere we en-route to the New ATH ? We are getting Near but I still say the stronger probability for The CYCLE TOP ATH that is Early Q4

Bitcoin Following 2013-2017 Fractal UPDATE 2We can see from the chart above that PA has now fallen below the Fractal for the first time since July 2023
This is itself was expected as we can see from previous posts on this Idea
PA was overbought and so HAS to cool off
However, we have targets as to when PA may try and recover.
initially, the circle in End of May was my expected "turn around" point
Things have progressed faster and so now, we have possibilities opening up for a move higher, sooner, maybe around end of April 2925
However until the weekly MACD is on Neutral, these would be short lived - hopefully.
For a sustainable move higher, PA needs to have the ability to maintain the push
the Weekly MACD shown above needs till end of April before any significant move can be maintained. PA has bounced of Neutral previously. But MACD can , obviously, Drop below this point, wait till May, or later, and move then.
For me, the line of the arrow higher is becoming the more realistic ideal path
But the longer we wait, the Steeper the rise has to be to maintain the idea of Cycle ATH in Q4, as per cycle trends.
And to conitnue to follow this Fractal.
The Time WILL come were we break away from this Fractal but as I have been saying for years, we are still on it......many things point towards that continuing.
But as I have mentioned in a post earlier today, These Trends may be changing.
Bitcoin is Maturing
All we can do is watch, react and learn
HAVE A PLAN FOR ALL OUTCOMES but also understand, the idea of Bitcoin collapsing is becoming more and more unrealistic...
The outlook is BULLISH noi matter what
I expect to remain on the fractal path till Next cycle ATH
Time will tell

Bitcoin Index-3 Strength index. Tells us what ? Bull Or Bear ?This post will include the same chart as a Month, Weekly, Daily and 4 hour
The 3 indicators are
RSI - RSI, or Relative Strength Index, is a momentum oscillator used in technical analysis to identify overbought or oversold conditions in the price
TSI - The True Strength Index indicator is a momentum oscillator designed to detect, confirm or visualize the strength of a trend. - the True Strength Index (TSI) does show trend direction.
ADX - the Average Directional Index (ADX) shows the strength of a market trend, NOT its direction. The base line is 25 - Above is strong trned, below is weaker trend
ADX is Yellow - DI + is orange ( positive price index) - DI - is Red ( Negative price index
MONTHLY
The main chart is the monthly chart - the vertical lines Mark Years
Note how ATH's are all Above the Rising upper trend line.
From the Left,
2013 ATH - Note how RSI and TSI both peaked BEFORE ATH, as did the DI+ on the ADX indicator. The ADX itself turned down Later
2017 ATH saw a similar pattern
2021 was slightly different. RSI and TSI peaked on the March ATH but the true cycle ATH was in Q4 ( Nov) , as are most BTC Cycle ATH - Note the sudden drops in both ( probably due to deleveraged)
The DI+ on the ADX did the same but note how the ADX itself peaked in NOV - The ADX seemingly being more accurate on showing us Cycle Top by Trend.
Currently,
The RSI has not entered Fully OVERBOUGHT as in previous cycles. Has Fallen below Overbought entry line in recent weeks. Maybe leveling out
TSI ( orange) is falling since Jan, showing a bearish trend - Falling towards its own average.. PA has been falling in this time.
ADX has also slowed and flatten out, showing a weakening of trend. NOTE - ADX does not show us Trend direction...So, in recent months, we have seen a DROP in PA.
Weakening of this trend could be pointing towards a reversal ?
Also look at the orange DI+ line in ADX....It is getting Lower on each ATH, harder to move higher as Price increase makes BTC harder to move
THE WEEKLY begins to show us more info
This starts to get interesting here
Note that in 2021, It was as we saw in the monthly Except the ADX fell after the March ATH and did not rise again untill half way through 2021 when the Bear Kicked in Fully. The ADX here is showing the strength of that Bear Market as Luna, FTX and 3 arrows collapsed.
The RSI and TSI remained flat Till Jan 2023, when we saw PA beginning to recover. Notice I said RECOVER. I said it at the time and I say it again..Jan 2023 till September was recovery from avery deep Bear market. This is backed up by the fact that the ADX remained Flat untill Late August 2023. Showed No TREND
Then we saw ADX rise, TSI rise off Neutral and RSI begin to head towards Overbought.
All 3 then Dipped in Mid 2024, Rose again to End of 2024 and since then, we have seen the RSI and TSI drop below their averages, head to Neutral
ADX continied to rise as DI+ Dropped, showing us this was a Bearish Trend after all.
However, since beginning of March, the ADX has been showing a weakening of this trend. Still Bearish as the rise in DI - shows, but it is getting weaker.
DAILY begins to show us what could be heading for a new trend, maybe
BTC PA dropped since Feb as did the RSI and TSI, though they have recently stopped doing that and have tried to bounce but still remain below Neutral.
The reason for this is shown in the ADX that has continued to rise untill March, Keeping that Bearish trend Active and strong. This is confirmed by the DI - ( red ) being above the DI +
Even though this trend has weakened, DI + remains flat showing that a change in trend does not appear to be happening to quickly.
Note how the ADX has turned and is beginning to rise higher as the TSI and RSI flatten out
Hpwever. DI - also remain flat.
Change could be near. It is not happening yet but......
The 4 hour chart is full of Noise but given whet we just seen, it may be relevant to see it
It is Volatile but we can see on BTC PA how PA slowed its drop from March and has ranged with a reducing high Low.
We can see how the RSI and TSI rose, dipped and Rose to their current positions near Neutral.
We can see on the ADX, in the centre , was the Last Bearish push, BTC PA Dropped sharply but the trend weakened quickly. the Bears are getting tired.
We see the attempt by the BULLS around the 11 march to push PA higher.
This failed..but showed us the bulls are still here.
The Fact that the ADX is below the DI lines is a sign that a Trend no longer exists or is very weak
The previous Bearish Trend is possibly exhausted.
We have signs that Price recovery is possible from here though I think we will wait a bit longer before we see it.
My conclusion is that we maybe seeing the beginning of a change , a reversal, but it may take a little while before we see the Fruits fully. Possibly up to 5 - 6 weeks or more.
The shorter term data shows we could make a push to top of range ( or near) but that could get rejected.. We need more strength for the long term
But I suggest you read this, look at these charts and make up your own mind.
Because they are hard to read in many ways, Trends can spring up any time, in any direction.
We can only look at them and think..
I wish you well

BITCOIN 50 & 100 SMA Patterns since 2014 -UPDATE - ATH in Q4 ?This is a long post but please read it all, there are some Major things to take note of.
The Main item in this post is the day counts between 50 SMA ( RED ) and 100 SMA ( BLUE ) and the days between Cross overs of these.
The upper day counts on the chart, count from ATH to when 50 crosses below the 100.
Then from that point to when the 50 Crosses back Above the 100
And then, in Grey, the number of days from Cross over to ATH
From 2014 ATH to 50 dropping Below = 504 days
When the 50 returned Above the 100 = 406 days
And from that point to the 2017 ATH = 560 days
From 2017 ATH to 50 dropping Below = 448 days
When the 50 returned Above the 100 = 284 days
And from that point to the 2021 ATH = 686 days ( I am using the Nov 2921 ATH as it was the higher price )
From 2021 ATH to 50 dropping Below = 308 days
When the 50 returned Above the 100 = 441 days
And from that point to the 2025 ATH = The average of the 2 previous is 623 days and takes us to a possible ATH in August, though I feel this is too soon.
If we Look at the day count from ATH to 50 dropping below 100
From 2014 ATH to 50 dropping Below = 504 days
From 2017 ATH to 50 dropping Below = 448 days
From 2021 ATH to 50 dropping Below = 308 days
Could this point towards around 200 days after ATH in 2025?
( This reduction in day count is most likely due ti rapid Profit taking. )
What is interesting is how, on Both the 2014 - 2017 and 2017 - 2021 ATH it was approx 1005 days between the 50 rising above the 100 to when ot fell back below after an ATH. This is Despite a variation in the days count between SMA cross overs.
Using this day count and projecting forward, maybe we can expect the 50 to drop back below the 100 in August 2026, next year
Using the day count from ATH to when 50 Drops below, that was mentioned above, that is around 200 days after ATH and using that August date just mentioned, We are projecting a Cycle ATH in Feb 2026 !
This is NOT a realistic date if we are to remain in the patterns of ATH in late Q4, that we have had every previous cycle.
As I pointed out in a post yesterday, the traditional patterns of Bitcoin HAVE to change this year.
And to many extents, they already have begun.
Take a Look at the angle of ascent of the 50 and 100 SMA's since 2014. Each cycle has seen a reduction of Steepness of Rise.... A slowing down on trajectory and this is most likely caused by the increase of price of a Bitcoin.
The more expensive it gets, the heavier it is to move PA higher.
So far this cycle, PA has landed on the 50 SMA twice and we are SO Close to doing that again.
This has NEVER happened before.
In 2021, we did it once and bounced to the Nov 2021 ATH, so far this cycle, we have done that twice.
This ARE CHANGING and for this to continue, we do need to see PA Bounce again off the 50, when the Bulls are ready.
The ATH in Q4 is open to question as a result. It may happen anytime from Late Q3 to Late Q1 2026
And we are only going to find out when it happens.
But be aware f things changing.
Because they are and so using History may become unusable....a bit like Price discoveryIt will become Trend discovery
Enjoy

Bitcoin is ABSOLUTELY under Pressure - It MUST react before DECI have been looking at this in detail for some time and have decided to change how I calculate things and here is the result.
There are 2 things of Massive importance to see here.
First is that Curve that PA has been under since 2010
The Lower Dashed Line is the Trend line formed in 2011. It is Strong and it is Valid and PA is currently running along it.
Here is a closer image to show you where we are in relation to it right now. Directly below PA currently, we hit that line around 67K
The Apex of this "Triangle" is December THIS YEAR
PA Has to break Above that Arc, the same Arc that has Rejected PA EVERY TIME since 2011
BUT THIS TIME IS DIFFERENT - IT HAS TO BE and here is why
I am not going to explain the % increase each Cycle Low to ATH, it is in the chart but I do want to show you this,
The first real push of Bitcoin was a massive % rise that created the ATH that formed the 1st point of the Lower Trend line of the New channel. This is A on the chart
The Next push was to B. This push was 1.433% of the Original push A - smaller by a long way in % terms.
These 2 moves created the channel that PA has remained in ever since. ( see dashed upper trend line)
From this point on, we can see that each cycle push , while in channel, has been approx 20% of the previous rise. Or around 1/5 of the size in % terms
Or to put is another way, Each Rise has been a diminishing % rise from previous.
Look at that curve. It has pushed PA down each cycle ATH
This cycle, we are currently at 26.7% of the previous push ( to 2021 ATH ) and it has created a cycle ATH currently.
But is the cycle Over ? - Hopefully NOT
Because if it is NOT over, we need to break through that Curve of resistance by December.
The Much expected 200K ATH is way over that curve and would result in a 55% of previous push rise. That would break the "trend"
This is VERY Different. But Absolutely required.
So, the question that should be on Everyone's lips is "Which is stronger ? The line or the Arc ?"
My expectation is that we will break through. That Arc has been a Major part of the formative years of Bitcoin PA but now, it could prove detrimental. Because, if we do not break through it, It will push Peice DOWN, through that line of Long term support.
We do not want that
SO, Maybe THIS is why the Bulls are waiting for the Weekly MACD to reset to Neutral...PA Needs the strength to break through.
So, Go Buy your Local BULL a Beer ( or white wine lol ) and Lets get on.
Watch this Close. It really is more important that Trumps Reserve, Saylors Love nest or Bezos after burners.................

Bitcoin Weekly LINEAR chart shows possible re run of 2021 2X ATHI was just looking at this Linear chart and spotted a couple of things.
So many people Use LOGARITHMIC charts.
In summery, A logarithmic chart is a graphical representation that uses a logarithmic scale, which differs from the conventional linear scale. In a logarithmic scale, the distance between values is not constant but increases by a factor, making it useful for datasets with a wide range of values. This approach helps in presenting numerical information more efficiently and allows for a better visualization of rates of change or percentages rather than absolute values.
A LINEAR chart however, shows you the REAL rate of change.
And on This Linear chart, I have noticed that PA is creating a very Similar Top to the MARCH ATH of 2021
I do not think we will follow it perfectly, as that drop in 2021 was over 50% and that would take us down to 52K, which I think is not a real possibility. But, being open to ALL possibilities, that trend line that was used by PA to bounce to the Nov ATH currently sits around 65K But the longer we wait, it heads higher, towards the 1 Fib ext around the Old 2021 ATH near 70K ( 69300)
Also note, how once PA had Dropped in March 2021, it levelled out and slide sideways for around 7 weeks.
So if we come over to Today, we have just dropped around 30% and seem to have found a Floor around 76K
We HAD to drop out of that Upper range box - It would have been December before we found support on the rising Trend line that has been the trigger for moves higher since 2023
And so, we have dropped to a Lower Range Box ( hopefully ) and this box hits the Rising trend line around June.
This has confluence with a number of other charts
And if we do range sideways, around this level, it is similar to that Range after the drop in 2021.
In 2021, after that range, PA rose by around 122%
I am not to sure we would see that but................
So now we wait to see if we stay in this range or not, with a top around 90K
We could See wicks out of this Range, down to the 70K mark maybe, with swift recovery.....
We may also see further Drop....
there is abcolutly NO guarentee that we will even head higher again.....
We have to wait and see and have plans and stick to them..for both BULl and BEAR

Bitcoin ATH 2025 - Which colour pill do you Want ? Blue ? Red ?
It is a very simple question and one you should be asking yourself RIGHT NOW
And here is why.
On previous 2 cycles, we have spent around 1440 days , on average, Between cycle ATH and the next Cycle ATH and so, by consequence, it should be easy to project forwards now, and estimate when to expect the next cycle ATH.
YES, except for the fact we had 2 Major ATH's in 2021.
Some insist that the March 2021 was the real ATH and the Nov ATH was False, maybe a Pump due to the roll out of TAPRROT.
For me, I say it is the Nov 2021 ATH is the REAL ATH for a number of reasons. 3 of which are simply that BTC ATH tend to be in Q4 and it was simply the Highest price that cycle.
The 3rd reason is in the chart with the Blue Day counts markers.
Using the Nov 2021 ATH, the 1400+ day count remains consistent from Previous ATH in 2013-2017.
Many current projections point toward another Q4 2025 ATH for Bitcoin and so I have added the BLUE day count to estimate when this maybe.
And it is around Oct / Nov , the same as 2nd ATH in 2021
This is the BLUE Pill
BUT if you believe that the March 2021 ATH was THE REAL ATH, then we must take our day count from there.
That was only 1190 from the previous ATH and if we project that number onto Current PA, we have already past that point and set a New ATH, Current ATH was set after that day count.
So Lets Project forward from the March 2021 ATH with the 1400+ average day count and we end up with a projected ATH around Early March, same as in 2021 !
This is your RED pill
I do have charts that point towards a major move in March but the question we need to ask ourselves is , "Will that be cycle Top"
This is obviously impossible to answer but we can continue to observe what does happen.
To simplify the issue, I am looking at the Weekly MACD for Bitcoin
It is SO overbought. In Fact, it is up as high as it was when we had the March 2021 ATH !
What does this suggest ?
We may already have had our Cycle ATH and we need to watch closely as to what happens now.
In 2021, we had a near -50% draw back when MACD was OverBought after the March ATH, before we pushed back up.
The push higher was enabled because the MACD had cooled off after 4 months , enough to be Neutral when it turned up to push for a New ATH
We are currently in a similar position.
MACD OverBought - Last time it was overbought, we ranged for 6 months while it cooled off slowly, controlled.
So what now ?
The Current situation poses so many questions.
OnChain data suggests strength though we have seen a lot of Long term holders selling. This usualy happens at cycle TOPS or near
Are we going to have 2 ATH pushes like we had in 2021 ?
Is this going to happen again ?
Which Colour pill are you taking ?
BLUE for a Q4 cycle ATH
RED for it has already past or is about to arrive.
The possibility does exist that the Cycle has been accelerated by Corporate involvement.
But we have not seen the Public FOMO yet.
Will we ?
So, Ladies and Gents. Which pill are you taking ?
BLUE or RED ?
Me, I already taken the............................................
BLUE

Extrapolating previous cycle price action to predict the futureUsing the Indicator: 4-Year Cycles
Cycle Analysis:
Cycle 1 to Cycle 2 Changes:
ATH increased from $1,160 to $19,676 (16.96x increase)
Gain percentage dropped from 52,287.39% to 12,804.2%
Loss percentage slightly improved from 86.9% to 83.11%
Cycle 2 to Cycle 3 Changes:
ATH increased from $19,676 to $68,979 (3.51x increase)
Gain percentage dramatically dropped from 12,804.2% to 1,976.94%
Loss percentage improved from 83.11% to 75.93%
Projection for Cycle 4:
Based on the observed pattern of diminishing returns and the logarithmic nature of Bitcoin's growth:
Projected ATH: $242,000 to $275,000
(Calculated by applying the observed ATH increase factors)
Projected Gain: Approximately 800-1200%
(Continuing the trend of diminishing percentage gains)
Projected Loss: Around 70-75%
(Following the gradual improvement in loss mitigation)
Each cycle shows a pattern of:
Reduced percentage gains
Slightly improved loss recovery
Continued exponential growth in absolute ATH price
ATH Calculation:
Cycle 1 to Cycle 2 growth multiplier: $1,160 → $19,676 = 16.96x
Cycle 2 to Cycle 3 growth multiplier: $19,676 → $68,979 = 3.51x
Observed Growth Multiplier Trend:
Cycle 1 to 2: 16.96x
Cycle 2 to 3: 3.51x
Projection Approach:
Lower Bound Calculation:
Previous ATH: $68,979
Multiplier: 3.51 (conservative)
Lower target: $68,979 × 3.51 = $242,000
Upper Bound Calculation:
Previous ATH: $68,979
Multiplier: 4.0 (slightly more optimistic)
Upper target: $68,979 × 4.0 = $275,91
Gain Percentage Calculation:
Cycle 1: 52,287.39%
Cycle 2: 12,804.2%
Cycle 3: 1,976.94%
Observed Decline Pattern:
Cycle 1 to 2: ~75% reduction in gain percentage
Cycle 2 to 3: ~84% reduction in gain percentage
Projected Gain Range:
Lower bound: 600-800%
Upper bound: 1000-1200%
Loss Percentage Trend:
Cycle 1: 86.9%
Cycle 2: 83.11%
Cycle 3: 75.93%
Projected Loss: 70-75% (continuing the gradual improvement)
Methodology Notes:
Used geometric progression with decreasing multipliers
Considered logarithmic growth pattern
Accounted for diminishing returns observed in previous cycles
Disclaimer:
Ultimately, these projections are mathematical extrapolations based on historical data and should not be considered definitive predictions. Cryptocurrency markets are highly volatile and unpredictable. This projection is based on historical patterns and should not be considered financial advice. Always conduct your own research and consult financial professionals before making investment decisions.

BTC | BITCOIN ATH | ALTSEASON A comprehensive analysis today on my take regarding Bitcoin , BTC All time High, and for how long we can still expect to see altseason.
When I say altseason, what I am referring to is hard pumps and large increases, scattered across the altcoin market.
In the previous BTC update, I considered an ATH between 99k and 105k. More on that here :
Today's main "concern" is really whether or not the alt-rallies are finished - and I say, not yet .
___________________
BINANCE:BTCUSD CRYPTOCAP:TOTAL3 CRYPTOCAP:BTC.D

Is ~Bitcoin about to repeat the 2021 Double Top pattern ?If you have been following my posts, you will know that I am a firm believer that we are following the 2013 - 2017 ATH Fractal. Only problem is, The 2017 Top was NOT a Double Top.
But if we look at the fractal closely, we can see how this could happen and I will do this in another post shortly.
For now, there are other pointers to suggest we maybe about to repeat that sequence from 2021.
Lets start with this chart
I am using the 2nd ATH in 2021 as THE ATH for a number of reasons, as explained in other posts, But also because it simply WAS the highest ATH that year and was approx the same number of days between ATH as the 2013 - 2017 cycle.
That same day count takes us to September 2025, a projected ATH date range from a number of alternative charts.
If we assume we see a March 2025 High, the same number of days between the 2021 ATH's, applied to March 2025, also takes us to September 2025.
Some are saying we will see an ATH in December 2024 and that day count puts us in Mid summer and, to be honest, I do not see this now, given how overheated PA is. But anything can happen in Bitcoin.
This date range on the rising Trend line off ATH's, also takes us to the Expected price range of 100K - 130K ----for now........
** Note - Assumptions in trading are NOT recommended but we are just projecting here..NOT applying trades to that assumption.
Next we have the NUPL ( Net unrealised Profit Loss )
The Vertical dashed lines are the ATH dates.
And while the 2021 March ATH shows us a higher NUPL, this is where most profit taking was, as most assumed ( see above )
The real ATH was later and as most has already taken profit, people were trapped by Nov, but this is a different story..
What I want you to see is that we have not reached the upper line of Euphoria, that we are now in.
There could be more to come...
The TOP seems to be Signalled when PA Preaches this upper line, even if a ATH can be reached after, as in late 2021
Next, we have SOPR - (Spent Output Profit Ratio)
Simply put, when people SELL and take profit
Again, vertical dashed lines are previsou ATH in 2017 and 2021
First thing to notice here is how Profit taking happens BEFORE the ATH usually. See how the graph Drops to the ATH line.
Also not the Red Diamonds above..they are Warning of Bearish intent.
While we have seen a spike in selling recently, we are reciveing BULLISH intent warnings ( green diamond bottom of chart ). This appeared After that Red diamond above and so is a more recent signal.
The spike in selling in early 2023 was people taking quick profit after 2 years oif Bearish moves.
BUT it must be noted that the way this profit taking has constantly changed makes it VERY hard to read accurtaly as a method of judgement. There is no real pattern
Which brings us to the final indicator.
The ADX and DI - The Trend Strength and Price direction
I find this fascinating. VERY IMPORTANT to remember that ADX ( Yellow ) does NOT show Trend Direction
It only shows trend Strength and you can see that we have just begun turning around from a Drop in trend Strength. This Drop began in early 2024, around March, when we began months of ranging.
The recent push higher seems to be reflected in ADX rising also, showing an increasing Trend strength. BUT will it last ? You can see from the chart, we are on a line of resistance now...We need to break through that.
The Orange line is the DI + and the Red is DI - and not surprisingly show Price direction.
This, combined with the ADX gives us ideas of true trend strength and ability.
For now. DI+ has turned to Drop and reflects the action recently But the DI - has yet to turn higher to meet it, indicating a possibility that Real Negative orice action may not occur just yet.
But we need to watch this closely.
So, in summery, for me, We are Still getting ready to move higher, we may well range for a while before hand and a December ATH, while possible, is not the best thing to hope for.
The final ATH of the cycle could be in September or around there, after an early Sopring push to a new high
And it is important to understand, things can change very quickly in Bitcoin and we need to be ready ALWAYS so I am offering ideas only..
Stay safe and may your God, Gods, Godess or Godesses forever Keep your socks Dry

Here is why we may see 1Million per BTC this time next yearI have been posting about this 2013 to 2017 ATH Fractal for about 2 years now and it is Still following on very Nicely.
PA fell below in 2022 due to the pressure from the {Pressure on Crypto from the USA and the following Collapse of LUNA and then FTX
But PA caught back on in Jan 2023 and we have pretty well been on the fractal since then.
There are a number of other supporting points that back this all up, including the Similar Monthly Candle close colours from previous years
We have only ever seen a RED August followed by a GREEN Sep and October on 3 previous occasions. 2015 & 2016 and then again in 2023 and just now , in 2024 makes the 4th.
To me, this backs up the idea that PA is following the 2013 - 2017 Fractal.
2015 August -30% Sep +18% Oct +41%
2016 August -26% Sep +14% Oct +24%
2023 August -16% Sep +14% Oct +37%
2024 August -23% Sep +30% Oct +30%
It has to be said, this years Growth does outshine the previous years mentioned due to ETF and sustained positivitey.
If we zoom in to see the PA from Nov 2021 to now, we can see in more detail how this has worked out.
AND, if this continues as it has since Nov 2021, we could be seeing a near $1Million BTC by around Nov 2025
Hang on, this could get VERY interesting

Why I believe the Real BTC ATH is this time next yearLots of evidence points towards current PA following the 2013 - 2017 Fractal including Aug, Sep, Oct Monthly Candle close colours for 2023 and 2024. identical to those of 2015 and 2016 - as has been posted here on TV
Also as can be seen on chart, the day count between ATH's
The 1st ATH in March 2021 was NOT the real one and was a result of Sudden publicity and FOMO. The same may happen again this time round.
Look at the ATH dates, November or December
But one of the biggest reasons is a technical issue called "OverBought"
The recent push up and possibly the continued push WILL require PA to reset at some point and the push high from Jan 2023 to the ATH in March this year ( which is NOT the end of a bull run ATH ) required PA to reset for MONTHS, in fact, it took from March 2024 to Oct 2024 before MACD has reset enough to be able to make a new move. 8 Months
We are VERY likely to do the same
We also have the day count between Halving and ATH to take into account. and this works out too..
Final ATH in Autumn / Winter 2025
There is so much more involved in this too that I will not explain here.
You have seen my previous charts, you will know.
HOWEVER, Real world events are making a huge difference and with the arrival of new Ethics concerning Crypto worldwide, things may change.
But for now, I continue with the 2013 to 2017 ATH fractal....It works, it fits
Look at the chart
Look at the numbers

BTC - TARGET REACHED | REPLAY from OCT 2023 - NOWIt is with GREAT pleasure that I say, cheers to you and all the bulls that didn't believe the ATH was in after 74k in March! Although it may seem like I've been a perma-bull, there's been short-term bearish updates throughout the year - let's walk through it and see for yourself!
I will say this, there was a moment when I thought it might happen sooner, but generally I did repeatedly say I plan for the new ATH during December. Close enough!
It is incredibly rewarding to see the entire process playout as I speculated - based off of facts and many hours of analysis and charting since 2017. It all contributed, and makes a world of a difference.
I need some time to plan the next move from here, it will take some time to observe the top out - so keep following!
________________________
BINANCE:BTCUSDT

BTC | Price CELEBRATES Trump VictoryBitcoin has increased by 13% after Donald Trump has been declared the next President of the United States, beating rival candidate Kamala Harris.
Over the past few months, Trump has claimed to be very open to cryptocurrency and this victory has done nothing short of pushing the price to a new ATH... and climbing!
There are two ways in which we can calculate the net major stops; one I have been speaking about since MARCH. This target seems to be the likely next stop for BTC in the short to near term.
Time will tell if the new POTUS will be kind or cruel to crypto - remember that time we all rooted for Garry Gensler...? About that... Let's hope this time will be different.
If you want to know al little bit more about how ALTSEASON fits into this picture, check out the following idea:
_________________________
BINANCE:BTCUSDT

Bitcoin New ATH made a New Trend in MarketAs BTC CRYPTOCAP:BTC has made new ATH and broke all resistance level now we are expecting 128K target in the end of year
Fundamentally trump also won the election and trump always take bitcoin to the moon.
Disclaimer: Always DYOR before taking any trade

BITCOIN STILL following the 2013 - 2017 Fractel - the latest I do not really need to say to much, the image says it all.
As I have been saying for over a year now, I strongly believe THIS is what we are doing.....
This is the Current Bitcoin PA with the 2013 ATH to 2017 ATH Fractal overlaid and you can see for yourself, it pretty well matches. There were some things that pulled PA Lower, like LUNA and FTX issues but here we are, taking a retrace in the same month and almost, so far, to the same % Drop
So, Here is the PA from 2013 - 2017 and we have zoomed into where I think we are now in the 2024 cycle. The Two White Arrows in the main chart show these points
This is now August 2016 - we have seen a sharp -28% Drop, PA leveled out, recovered a little and then. in September, took off to head to the Next ATH - December saw a Spike to a high, a dip back and then off we went.
And Exactly the same is expected currently, with many saying September is when we really start moving and December is possibly a new ATH.
Fractels work until they do not...and we have been following this one since Nov 2021 - that is a remarkably long time. And if it paints a true picture of what is to come, 2025 will be truly EPIC with the Next final ATH of this cycle at around $1Million
I find that hard to believe but, Hey, if it happens, I am not going to say No.........
