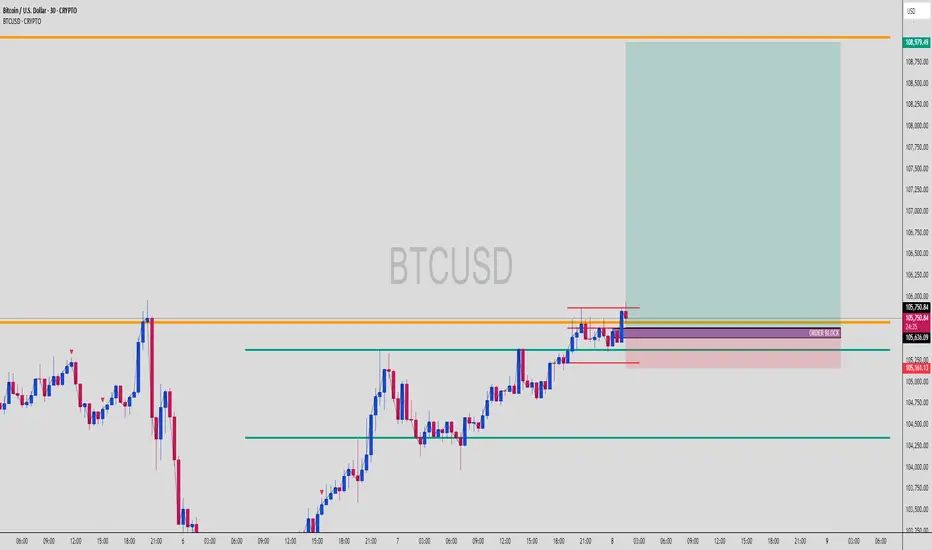
BTC Long Triggered from OB, Smart Money Played This Perfectly!BTCUSD | 30-Min Chart – Long Setup Execution
Bitcoin has just activated a clean long entry from a well-defined bullish Order Block at a key structural level. This move follows textbook Smart Money Concepts (SMC) — the kind of play institutional traders thrive on.
🔍 Setup Breakdown:
🔹 Order Block (OB):
Identified near 105,636 — aligned with previous support
Precise reaction zone after consolidation, showing institutional interest
OB respected after fakeout below short-term liquidity
🔸 Liquidity Sweep:
Quick wick below 105,250 acted as a stop hunt for early shorts
Price reclaimed the OB immediately after → classic Smart Money trap
🟩 Entry Zone (OB Zone):
105,636–105,250 range
Confluence with minor bullish imbalance and structure support
Price barely tapped the zone before launching higher
📈 Upside Target:
TP marked at 108,979 — prior liquidity pocket and untested highs
Large green zone shows ideal RR (approx. 1:6)
First obstacle: minor resistance at 106,750, but momentum looks strong
🟥 SL Placement:
Safely below OB at ~105,161
Below liquidity sweep zone = strong invalidation
🧠 Why This Setup Works:
✔ Price moved impulsively into the OB
✔ OB lines up with previous structure support
✔ Rejection + strong bullish candle = confirmation
✔ No significant resistance until higher liquidity zones (108K+)
This is classic SMC execution: trap, sweep, OB tap, and send. Let retail panic — we follow footprints.
💬 Ninja Wisdom:
"Smart Money doesn’t chase price — it traps and collects."
This was a clean confirmation of a bullish continuation after reclaiming control from liquidity grabs.
📍 Save this chart – this setup could explode into a full bullish swing
💬 Drop your thoughts: Are we headed to 109K or pausing at resistance?
👣 Follow @ChartNinjas88 for more sniper-level BTC/ETH/Gold plays
Btcbreakout
BTC REBOUND? 〉$140,000 NEXTAs illustrated, I'm visualizing what the next impulsive wave could look like.
Price has broken out of a major daily trend line.
It makes sense for the week to have started trading lower to find it's low and potentially bounce with strength sometime this coming up week and into the next.
The next pivot area is between the $82,000 - $80,000 range based on previous week's lows and daily low levels.
An interesting buy opportunity is forming and the potential entry is illustrated as the "pivot area" marked in yellow.
Then we have a major pivot range near the $100,000 psychological price.
.
This could be a price where some short term traders get out "in case it's just a pull back before a collapse" type of decision.
We can't ignore how much price consolidated between 100,000 and 96,000; and so that is the next stepping stone for BTC before breaking to ATH's of at least $120,000.
My personal target is set at the 161.8% extension level as illustrated.
--
GOOD LUCK!
Persa

BTC/USD Trading Analysis – Double Bottom & Rising Wedge BreakoutThis BTC/USD 4-hour chart showcases a potential bullish breakout setup based on technical patterns, key support and resistance levels, and price action analysis. The chart suggests a trend reversal following a downtrend, with signs of bullish momentum building up.
Let's break down the full technical analysis, covering the chart structure, key levels, price patterns, and trading strategy.
1. Market Structure & Identified Patterns
A. Double Bottom Reversal – Strong Bullish Signal
A double bottom pattern has formed, which is a bullish reversal signal that indicates the end of a downtrend.
This pattern consists of two significant low points (Bottom 1 and Bottom 2) near the $80,000 - $81,000 support zone.
The pattern confirms strong buying interest at this level, preventing further price drops.
A breakout above the resistance level would confirm the pattern’s validity, signaling a move toward higher targets.
B. Rising Wedge Formation – Potential Bullish Breakout
The price action is consolidating in a rising wedge, forming higher highs and higher lows within a narrowing range.
A rising wedge often suggests a potential breakout.
Since this wedge forms after a double bottom, the breakout is expected to be bullish, rather than a bearish breakdown.
If the price breaks above the wedge’s upper trendline, it will confirm a strong upward momentum.
2. Key Support & Resistance Levels
Support Levels:
Major Support Zone (80,000 – 81,000):
This level has been tested twice, confirming buyer strength.
It serves as the foundation for the double bottom pattern.
Stop Loss Level (72,921):
If the price drops below this level, it would invalidate the bullish setup.
This level is strategically placed to manage risk and protect against potential downturns.
Resistance Levels:
First Resistance Zone (95,000 – 100,000):
This is a critical level, as the price has faced multiple rejections here.
A breakout above this zone would confirm a strong bullish trend continuation.
Take Profit Targets:
TP1 (108,481): The first take-profit target aligns with previous highs and is a logical point for partial profit booking.
TP2 (114,372): This is the second profit target, calculated based on Fibonacci extensions and historical price movements.
3. Trading Strategy & Execution Plan
A. Entry Strategy
To execute a successful trade, we need to wait for confirmation of the breakout.
Ideal Entry: After a strong breakout above 95,000 – 100,000, indicating bullish momentum.
Confirmation Factors:
Increased trading volume → Signals strong buying interest.
Candle close above resistance → Confirms breakout.
Retest of broken resistance as support → Strengthens bullish continuation.
B. Risk Management
Stop Loss Placement: Below 72,921, ensuring limited downside risk.
Risk-to-Reward Ratio: The trade setup aims for a 1:3 or better risk-to-reward ratio.
C. Potential Scenarios
✅ Bullish Breakout:
If BTC breaks and holds above 95,000 – 100,000, we can expect a rally toward 108,481 (TP1) and 114,372 (TP2).
❌ Bearish Rejection:
If BTC fails to break resistance, it could retest 80,000 or drop lower, invalidating the bullish setup.
4. Final Thoughts – What to Expect?
This BTC/USD 4-hour chart analysis provides a high-probability bullish trade setup, supported by:
✅ Double Bottom Formation → Strong Reversal Signal
✅ Rising Wedge Breakout Potential → Momentum Building
✅ Key Resistance Breakout Levels Identified
📌 Conclusion:
If Bitcoin breaks above 95,000 – 100,000, expect a major bullish move toward 108,481 and beyond. However, if resistance holds, we might see a retest of lower support levels. Risk management is essential for a successful trade execution. 🚀

Bitcoin Breakout: Potential Rally Towards $110K!"Key Observations:
Descending Channel: The price has been moving downward within a channel, showing lower highs and lower lows.
Support Level: Marked near $79,912.83, where the price recently bounced.
Breakout Scenario: BTC appears to be breaking out of the channel, suggesting a potential bullish trend.
Target: The projected target is $110,146.67, indicating a significant upward move.
Stop Loss: Positioned below the support level to manage risk in case of a price reversal.
Trading Idea:
A long trade setup is suggested, with entry upon confirmation of the breakout.
Stop-loss below the recent low ($79,912.83) to minimize risk.
Profit target near $110,146.67, aligning with previous resistance levels.
This setup follows a classic breakout and retest strategy, expecting bullish momentum if Bitcoin sustains above the resistance zone.

Bitcoin (BTCUSD) - Bullish Breakout from Strong Falling WedgeBitcoin is currently showing signs of a potential breakout from a strong falling wedge pattern on the 4H chart, which is a classic bullish reversal signal.
🔍 Technical Highlights:
The falling wedge has been forming since late January, creating a series of lower highs and lower lows.
Price action is now consolidating near the wedge resistance, indicating an impending breakout.
A previous bullish leg saw a price rally of 25,428.16 (+30.29%), suggesting strong historical momentum.
If BTC breaks out cleanly, we could see a similar or stronger move—projecting a potential rally of 28,086.24 (+31.12%).
📈 Expected Target : ~$118,141, aligning with the measured move from the wedge breakout.
🧠 Trading Insigh t: Watch for a confirmed breakout with strong volume above the wedge resistance zone. Retests of the breakout area can offer ideal entries for continuation trades.

Accumulation to Breakout: BTC’s Next Target RevealedBitcoin Analysis
After a 47% surge from the first accumulation zone, the price entered a consolidation phase.
Breaking out of the next accumulation zone, Bitcoin rallied by 61%, showcasing strong bullish momentum.
Currently, the price is consolidating again, with a potential 40% upside if the bullish trend continues.
Previous breakout levels now act as key support for any pullbacks.

Is BTC Preparing for a Bearish Move?Look at the 1H chart and i see bearish flag and pole pattern... what you think?

#BTC 72800 $ Confirmed. ..#BTC 72800 $ Confirmed. ..
Watch My Previous Analysis For #BTC..
And All ALTS Exit Pump Series..

Bitcoin Didn't Break OutBTCUSD has broken out of the range it has been stuck in for over 7 months. BTCUSD/WM1NS, Bitcoin adjusted for the supply of the US Dollar, did not. It perfectly retested the resistance it has been stuck under for 7 months and was cleanly and precisely rejected.

BTC Short Term Swing Short into Bullmarket Long. (56k)In this video, I break down a strategic short-term swing trade that could be catalyzed by the upcoming speech from Federal Reserve Chair Jerome Powell. Such events are known to introduce significant market volatility, offering a prime setup for a potential trade.
We'll analyze key levels that could signal a strong entry point, with a particular focus on a long trade that may pave the way for a broader bullish trend. This analysis aims to position us ahead of market movements, enabling us to capitalize on any emerging opportunities.
Stay tuned as I detail how to approach this setup with precision. If you're looking to enhance your trading strategy and stay ahead of market shifts, this is a must-watch.
Don't forget to follow this channel and enable notifications to stay updated on critical market insights and trading opportunities.

BTCUSD 15Min-TIMEFRAME BITCOIN ANALYSIS💥BTCUSD 15Min-TIMEFRAME ANALYSIS
💗Hello ladies and gentlemen
This is my new idea for 💥BTC Bitcoin
I hope my idea is clear
Please support me by like and sharing thank you
Stay Safe💯💲💲💲
Good luck💰😍

Amazing Unseen BTC Short Setup / Fake Breakout of WedgeThis Chart makes a lot more sense on the daily because the breakout on daily 1 candle
Daily Chart Here:
However the rejection and inability to clearly breakout of 41,639 made me want to post this as it could possibly be a fake breakout from the rising wedge on the daily chart.
I was positive if it hit 41.6K it sky rocket... but it doesn't look to be that way, but time will tell
Resistance 41.6K
Old Resistance - Wedge Line 39K ish follow the cahrt
Older Resistance - 37.9K

BTC Weekly Analysis - Will the price fall to $25,000?BTC has made contact with the top of the Weekly Bull Channel and has come up against some resistance. In my previous 4HR analysis, I showed the potential for a measured move from the 4HR Bull Channel to the Weekly Bull Channel Resistance, we have reached that price of about $38,000. Where do we go from here?
Key Points
1. Bull Channel means we should always be Long.
2. Bitcoin has touched Weekly Channel Resistance
3. Wait for the weekly candle to close below the channel top
4. There is a gap between the current price and 30EMA/200EMA
5. RSI is overbought. A weak indicator on its own but supports #2-#4.
Before trading this chart, the weekly candle needs to close tomorrow to confirm whether or not we are breaking out of the bull channel. I remain neutral until we see that result; however, I am slightly more bearish on the price given #2-#5 of the key points. Also refer to my BTC lifetime analysis where I argue that before every new all-time high, BTC touches lifetime support. We have not yet made contact with lifetime support and believe we have one more fall to $20,000-$25,000 before new all-time highs.
As always, trade at your own risk, you are responsible for your trades. I hope this analysis was insightful and useful.
Trade wisely and let us know what you think in the comment section below!

BTC Continuation upwards it seemsBitcoin broke above 31k and went straight to 35k as we said could happen over three months ago. We are now looking for continuation up to ultimately 42k.
At the 42 k level we will most likely sell most of our holdings that we acquired when we first broke out at 25k. This will claim us great profits and allow us to enter the altcoin markets that are shaping up greatly right now.
The current pattern displays accumulation. We are making higher lows and buying up the wicks on lower timeframes. Watch out for impulse moves, we will not trade this one with leverage for now.

BTC TRIANGLE BREAKOUT WILL IT CONTINUE?Last week, I published my idea about the next massive move of BTC as it enters the crucial stage of the triangle in this chart of BITSTAMP:BTCUSD
At 8 AM ET, we saw a price breakout of BTC from the near 2-year-long diagonal resistance. This leap happened upon the "breaking" news of SEC approval of the iShares Bitcoin Spot ETF application. The coin reached its price of nearly $30,000 before it was deemed to be false.
That causes it to go pump-and-dump and notice that the price movement is still above the resistance as it stabilizes after that hype, which shows the demand from the market as well as respecting the trendline that could potentially be the new diagonal support line of BTC from a technical perspective.
But be mindful that ETF approval news could happen anytime this week and, let's be aware with our trading positions at this time, set areas for stop profits and stop loss because although we're in a slightly bullish trend, we are embracing the world of cryptocurrency, volatilities is observed at any given time, thus invalidating our technical analysis. Take something with a grain of salt.
My next strategy would be a potential bounce play of the coin on the trendline at the $28,000 range. I'm optimistic that the SEC won't deny the Bitcoin ETF applications and consider the false information and the latest market manipulation as their excuse. If denied, we could expect a breakdown from the diagonal line.
Happy trading :)

Bitcoin PicksUp On Momentum To UpsideBitcoin found support around 29.4.will that be the last dump or 29.2 is comin?Momentum is building up as we accumulating here.
Thanks for watching

BITCOIN : The BIG Breakout has just Happened 💹💰💰31070 is now support and this is now the BIG breakout that i have been 'screaming for'
Is Crypto Winter coming to an end? 🐬💰💰
BITCOIN : Big Chart - Big Levels 💹
BITCOIN's Huge LEVEL: 1, 2 3 GO? 🚀
Perfect time to buy, thank you SEC:
'FED Up' for a 'SEC' .... 🤡 They Buy their Own Dips!! 😂🚀
One Love,
The FXPROFESSOR 🎯🤝💰😎

BTCUSD breakout trading for beginnersBTC has a lovely range to trade.
Pending orders have been set.
Trade safe, use SL.
this is not a financial advice.

#BTCUSD What's next, rally or crash?Hi guys, This is CryptoMojo, One of the most active trading view authors and fastest-growing communities.
Consider following me for the latest updates and Long /Short calls on almost every exchange.
I post short mid and long-term trade setups too.
Let’s get to the chart!
I have tried my best to bring the best possible outcome to this chart, Do not consider financial advice.
#BTC
BTC again attempted to break the horizontal resistance of the rectangular channel but couldn't close the candle above it and ended up as a fake out.
Now it is again trading below the horizontal resistance. Further consolidation could be expected inside the rectangular channel until a solid breakout or breakdown will happen.
This chart is likely to help you make better trade decisions if it does consider upvoting it.
I would also love to know your charts and views in the comment section.
Thank you

BTC ANALYSIS#BTC UPATE.
#BTC is now trading in accumulation range where red box then the black line is the resistance.Since we got rejection from the red box area on daily is is most likely that we might see pullback again in btc ,however if btc closes above the red box resistance we are likely to see some upside move from here.

BTC bullish but wait 200ema s1 btc is bullish but wait for good enteri
break line is very hard r1 so be car full and 200ema s1

btc long news btc going 23500$BTC BUY THE DIP, if yr not love these nice dips and buying them, then what are you doing in crypto??? A bunch of monkey trollers who believed in high is yr BTC haters, period! Lower the better, could be so lucky ,///////////btc long 19500

BTC Hourly Possible BreakoutA new channel appears to have broken out within the larger triangle pattern, and it converges with my upper trendline on the hourly, and to me looks like a potential spot from which BTC may breakout to the upside. That's what I see anyway.
