#BTC/USDT Bitcoin Recovers Above 108,000 $#BTC
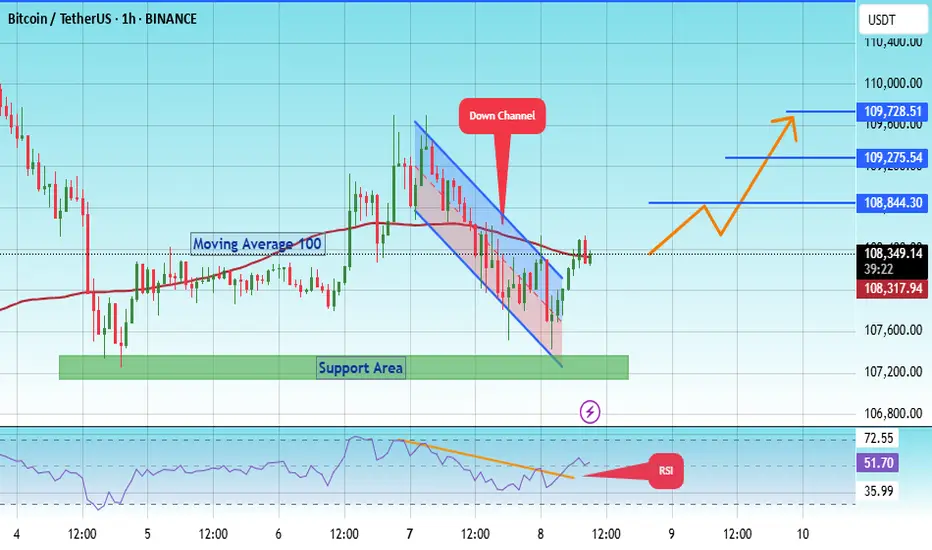
The price is moving within a descending channel on the 1-hour frame, adhering well to it, and is on its way to breaking it strongly upwards and retesting it.
We are seeing a bounce from the lower boundary of the descending channel. This support is at 107600.
We have a downtrend on the RSI indicator that is about to break and retest, supporting the upside.
There is a major support area in green at 107217, which represents a strong basis for the upside.
Don't forget a simple thing: ease and capital.
When you reach the first target, save some money and then change your stop-loss order to an entry order.
For inquiries, please leave a comment.
We are looking to hold above the Moving Average 100.
Entry price: 108337.
First target: 108844.
Second target: 109275.
Third target: 109728.
Don't forget a simple thing: ease and capital.
When you reach the first target, save some money and then change your stop-loss order to an entry order.
For inquiries, please leave a comment.
Thank you.
Btcbtc
#BTC/USDT#BTC
The price is moving within a descending channel on the 1-hour frame, adhering well to it, and is on its way to breaking it strongly upwards and retesting it.
We are seeing a rebound from the lower boundary of the descending channel, which is support at 104090.
We have a downtrend on the RSI indicator that is about to break and retest, supporting the upward trend.
We are looking for stability above the 100 moving average.
Entry price: 104619
First target: 105128
Second target: 106128
Third target: 107091

#BTC/USDT#BTC
The price is moving within a descending channel on the 1-hour frame, adhering well to it, and is heading for a strong breakout and retest.
We are experiencing a rebound from the lower boundary of the descending channel, which is support at 103200.
We are experiencing a downtrend on the RSI indicator, which is about to break and retest, supporting the upward trend.
We are looking for stability above the 100 moving average.
Entry price: 103708
First target: 104152
Second target: 104900
Third target: 105900

#BTC/USDT#BTC
The price is moving in a descending channel on the 1-hour frame upwards and is expected to continue
We have a trend to stabilize above the moving average 100 again
We have a downtrend on the RSI indicator that supports the rise by breaking it upwards
We have a support area at the lower limit of the channel at a price of
96000
Entry price 96500
First target 97270
Second target 98691
Third target 100000

#BTC/USDT#BTC
The price is moving in a descending channel on the 1-hour frame and sticking to it well
We have a bounce from the lower limit of the descending channel, this support is at 66900
We have a downtrend, the RSI indicator is about to break, which supports the rise
We have a trend to stabilize above the moving average 100
Entry price 68800
First target 69764
Second target 71385
Third target 73266

#BTC/USDT#BTC
We have a downtrend pattern on the 12-hour frame, the price is moving within it and adhering to its boundaries well
We have a support area in green at a price of 55,000 after the price touched it and rebounded from it
We have a trend to stabilize above the moving average of 100
We have a downtrend on the RSI indicator that supports the price upwards
Entry price 64,000
First target 67,600
Second target 70,587
Third target 73,670

BTC/USDT short💎BTC/USDT
🔴short
🛑max lev 20
💵 HKEX:2 % OF CAPITAL
🟩enter1:29260
🟩enter2:29430
🟥stop : 29600
🔮target's
🪙28920
💶28478
💷28036
💴27560
💵27220
R/R = 6
RISK meduim

#BTC $BTC This is our Technical Analysis on #Bitcoin Weekly!
In Weekly TF BTC is on Ranging/Flat Market
Give attention to strong levels when price reach there!

BTC/USDT 2HOUR UPDATE BY CRYPTOSANDERSWelcome to this quick BTC /USDT analysis.
I have tried my best to bring the best possible outcome in this chart.
Hello friends
As I mentioned in the previous chart, BTC may reverse from here
BTC has bounced to 21ma which can only come once for 21ma retest and BTC retest confirms Done thanks
This is not a piece of financial advice.
Sorry for my English it is not my native language.
Do hit the like button if you like it and share your charts in the comments section.
thank you.

BTC/USDTThere are two scenarios in this area. The first scenario is that we will be supported in the same area and our movement will end with the three channel phases and the ascending trend will start. The second scenario will lose support now and the five channel phase will be completed and down to the range of 38500.

bitcoinif breakout occurs in this channel than we will decide what will happen in the market. so just wait and watch the show.
peace out traders.

BTC RESULTWell, in the previous analysis I drew two major support zones and I expected that the price will react to one of them.
so it did.
check the link below to see the result.

bullish flag in btc 1 hour time frame wait for the breakout the we can long btc again
I m bullish this time
btc going to touch important resistance
so keep eye on the chart

BTCUSDThis is a different analysis. This market is not unpredictable, we just need to know what algorithm the market makers use. The more open our minds are, the better we make decisions. But remember, these scenarios do not happen without the purchase volume, so be aware of the input volumes. When we were at $ 64,000, the market was $ 2.5 trillion.
Be profitable friends

BTCUSDHello dear friends, I hope this analysis can help you in your analysis. I will be happy for you to write your comments for me and help me improve my analysis
Thanks

BTCUSDDue to the weak input volume, we will most likely go down to the bottom of the channel, which is the ceiling of the previous trend line, which is $ 37,500, and then look for higher targets, which are $ 42,000, $ 47,000, Fibonacci, respectively, and if we cross the ceiling. ,. Which is 51 thousand dollars and after that Is the main downward trendwe are going to correct 24 thousand or 19 thousand and ... which I will update later. Be profitable


BTCUSDSometimes patterns change meanings and sometimes they have different meanings in different places. In my opinion, the triangle is a run button to continue the process. If it is formed in an ascending trend, it will continue the trend from all sides after the defeat, and in the same way if it is formed in a descending trend.
On the other hand, you should pay attention to why whales are still watching the market and have not yet entered the market ?!
Do not forget that this market is unpredictable and sometimes we have to wait for valid confirmations to continue the trends.
Good luck and be profitable friends.


BTCUSDUp or Down ?!
I think we should move down because the stock of exchanges is more than the stock of whales and people, and therefore the possibility of increasing the rate by exchange offices will have a lower credit rating.


BTC - Precise as a Swiss watch
Big drop in BTC, exactly meeting the SHS target, now what's next?
MANAGE YOUR RISK! The loss you take in case of failure should NEVER be more than 2% of your total capital. NEVER. You invited to share your vision in the comments. Thank you

BCD - Continue 20K - 26K stsBuy now
Target 1: 0.00020 sts
Target 2: 0.00026 sts
Target 3: Feedom
Fllow Twitter: @NguyenDinhHuo10
