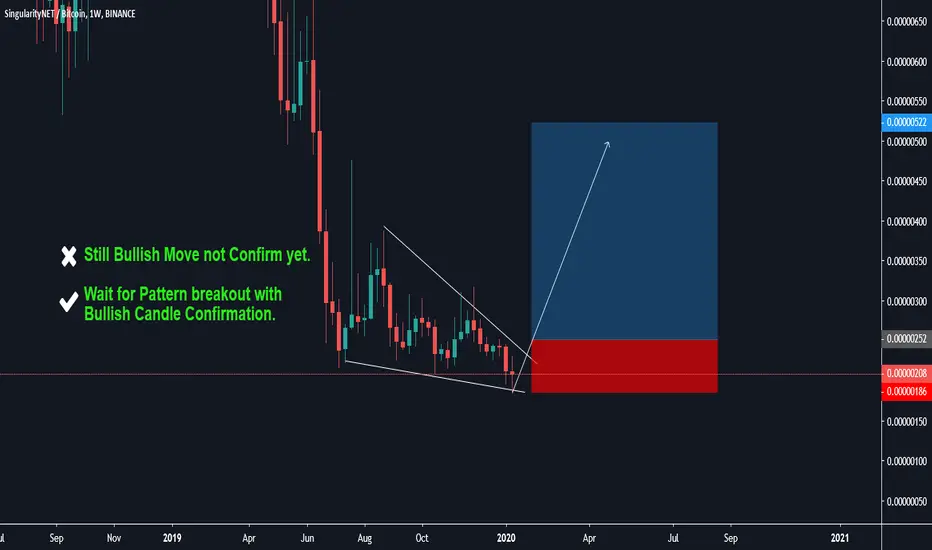
AGIBTC : Buy After Pattern Breakout.AGIBTC : Buy After Pattern Breakout.
Note: This is only for Educational Purpose this is not Investment advice.
Thanks
Adil Khan.
Btcbullish
bitcoin to $27000 if this level Holds!!hello everyone, glad to have you here today! so according to fib extensions $27000 is the next relevant target for bitcoin, we recently successfully bounced off of the 0.618 fib level and if we hold that level I believe $27K is the next on the cards as a first target for the next bull cycle! also according to Elliot wave theory there is a very high probability that we've just finished second wave and the third one is about to start which is usually the longest one which means that we basically will reach the %100 level on fib extensions which is at the $27K! so guys let me know if you agree or disagree with my Analysis one the comments below! cheers guys have a nice day.
DISCLAIMER:
information presented one my posts are for education purposes only. not a financial advice because I am not a Financial adviser!!!

$BTC 2020 - #BITCOIN IS A FALLING WEDGE AND IH&SWell... BTC channel may have been a bit shortsighted of me. After looking at the break out more Im now leaning towards this being a full on falling wedge and we just got an iH&S to break it out.
Big longs now imo.


BTC/USD LONG (SNIPER ENTRY TO THE MOON)BTC/USD LONG
Entry 1 6,515
ENTRY 3 6,358
Sl 6,000
Tp.1 7250
Tp.2 8000
Tp.3 8,600
Tp.4 9,400

BTC a Contrarian?Hi,
I believe anyone who has spend 6 months in the crypto market can say BTC is a contrarian asset, anyways I have sought out a short term bullish scenario if it helps.
1. IF and ONLY if we manage to close above 21 EMA on the daily and with it the weekly close also happens by Sunday, I believe we could see a short term relief rally.
2. Do not be fooled if this move reaches $8500 level. Why? Longs are largely leveraged right now. Guide yourself to Bitfinex's long and short chart.
3. Currently we are in a NO trade zone. Watch MacD closely.
4. Breaking into red box can generate a short opportunity AND closing above 21 EMA can open a long opportunity.
5. THE MOST IMPORTANT POINT OF ALL IS THAT IT SEEMS LIKE FUTURES MARKET FOR BTC IS CURRENTLY THE CONTROLLING FACTOR SO WITH THE WEEKEND APPROACHING WE MAY HAVE A CHANCE IN THE SPOT MARKET ONCE THE SELLING PRESSURE IS TAKEN OFF.
Trade SAFE!
**** THIS IS ONLY FOR EDUCATIONAL PURPOSES ****

QUICK SETUPQuick Setup :
BUY : Open above the green line and put an SL on the red line
SHORT : Open on the red line and put an SL on the green line

BTC/USD This is hard to believe but here we are.Good morning everybody,
I did this chart yesterday and published it but forgot to take the lock feature off, so nobody got to see this at all. So here we go again.
Here is a shocker for you! everybody is thinking down but that is what "they" want you to think. As you can see on this chart, we have a very complex wave count, the tough part was the last part in my count, it was the bizarre spike that we had seen with BTC not to long ago, which had me baffled for a period of time but anyways, since we had hit this bottom, the best I could come up with is called an expanded flat; very common, mind the spike.
The good news for the bulls is that we have hit bottom, providing that this is truly an expanded flat. That means that we are now heading for higher highs in the coming months and naturally surpassing the all time high. Why? because this is just the beginning of wave 3 from the all time high. If you look at the chart, this is the second big wave for BTC .
Why will BTC go up? That is a good question, I will answer that with a question. Is there any other coin that competes with BTC?
Cheers!

BEARISH MARKET ALMOST DONE ?Bitcoin has entered the Reload Zone (green square) yesterday , and as we all know , it broke the trendline a few weeks ago. We can see on this chart that bitcoin has bounced of the trendline. We can expect a retracement on the 0.382 or in reload zone of the last wave (red square).
We could have a Shark Setup if it goes back in the reload zone (red one) .

$BTC : THE BEARISH MARKET KEEP GOINGWe expect BTC to reach the reload zone OR retest the previous V-bottom.
Bitcoin has done a counter trend rally so institutionnals can short . We can ecpect it to go to the reload zone (green zone) and we'll see what happen next.
DO NOT SHORT AT THE MOMENT, THIS IS A NO TRADE ZONE FOR ME.

BTC/USD LONG (SNIPER ENTRY TO THE MOON)BTC/USD BUY LIMIT
ENTRY 1 8,250 LOW LOT ENTRY (1/3 OF ACTUAL POSITION)
ENTRY 2 8,098 (2/3 OF ACTUAL POSITION)
ENTRY 3 7,986 (SNIPER ENTRY) TO THE MOON
SL 7636
TP.1 8700
TP.2 9150
TP.3 9,800
TP.4 10,240 (IMPORTANT AREA)
IF PRICE BREAKS 10K WE WILL
TRAIL POSITION TO 12K THEN POSSIBLY 15K
TP.6 12,250
TP.5 13,680
14K- 15K
MavRich CRYPTO GOD SIGNAL

BTC/USD LONG (SNIPER ENTRY TO THE MOON)ENTRY 1 8,386 LOW LOT ENTRY (1/3 OF ACTUAL POSITION)
ENTRY 2 8,250 (2/3 OF ACTUAL POSITION)
ENTRY 3 8,098 (SNIPER ENTRY)
SL 7719
TP.1 8730
TP.2 9100
TP.3 9600
TP.4 10,240
IF PRICE BREAKS 10K WE WILL TRAIL POSITION TO 12K THEN POSSIBLY 15K
TP.5 11,500
TP.6 12,380
TP.5 13,680
14K- 15K
CRYPTO GOD SIGNAL

BTC ROAD to 11k : Start of a 3rd Wave Looking to me that we are nearing a completion of a 2nd wave consolidation. Squirreling away BTC......

$BTC: PROPABILITIES OF GOING UP ARE 80%Hello, today we can see that $BTC has formed a "W" Pattern. This scenario is valid because :
-it didn't retrace more than 50% of Fibonnaci
- The 2nd low isn't lower or as low as the first one (didn't break the neck line or made a double bottom)
-We have a divergeance on the RSI
This scenario will be valid when it will break the highest point of the last rise. The probabilities of going up are 80% (AB=CD Pattern)
This scenario will be invalidated if be break the neck line

BITCOIN IS STILL BULLISH (11900 PUMP SOON)As we can see on the 4H chart, we got several elements that show us that Bitcoin is still bullish:
-EMA9 is superior to EMA18 : Bullish
-RSI Divergeance : Bullish
-"W" bottom pattern : Bullish
-80 % of chances to go up through the AB=CD Pattern = Bullish
Don't forget, the main target is 11950.

$BTC TO 12.4K SOON$BTC is now forming a triangle as we can see on this chart, the breakout may happen tommorow. As we can see on the chart we got 2 main
targets and a very optimistic target. $BTC reached the 50 % of Fibonnaci a couple days ago (7300 to 10500), we expect a rise to 61.3 % of Fibonnaci, which represents 11300 (first target), or , a rise to 78.6 % of Fibonnaci which represent 12400. Finally we got the 123 % of Fibonnaci (15443) which is a very optimistic target .
The next rise will be the 3rd wave out of 5 waves.
We got a BIG Bullish Divergeance on the RSI which make me very optimistic about the situation, post your ideas down below !

$BTC 1st WAVE DONE ?Hello everyone, we can see that $BTC made a new high during in the last hours. It stopp right on the 50 of Fibonnaci (from 13800 to 7200). The first wave may be done, the 2nd wave which is a correctionnal wave has the potential to correct 100 % of the 1st wave. Here I place a Fibonnaci and we can see that it already corrected 38.1 % of the 1st wave. It could keep rising right now but it could also reach the 50 or 61.8 % of Fibonnaci.

$BTC HAS TO BREAK 8800 TO BEGIN A NEW TRENDAs we can see on the chart $BTC has reached a new high today and it reached the top of the falling wedge, I expect it to break this level and the 50 and 200 MA's so it can begin a new trend. The next target is 15600 ~ We aslo see that there is a divergeance on the RSI.

$BTC has reached the 61.8 % of Fibonnaci, the correction is DONEAs we can see, today $BTC has reached 7250 ~ which was the buy target and the 61.8 % of Fibonnaci . The main target now is 123 % of the Fibonnaci as we enter a bullish market.

$BITCOIN IS TARGETING 9800 $As we can see on this chart; if we consider that bitcoin is forming a falling wedge ( watch my previous idea), it may reach 9800 $ in a few days or weeks. It has more chances to hit 61.8 % of Fibonnaci which represents 9363 $. If it goes higher, it will hit 9808 $ according to the Fibonnaci (78.6 % of Fibonnaci.

$BITCOIN is forming a FALLING WEDGEAs we can see on the chart $BTC is forming a huge falling wedge , which may, potentially end when it hits 61.8 % of Fibonnaci (7200 $ )

The Truth About Bitcoin...As we can see on the chart BTC has formed a falling wedge which may potentially end when it hits 61.8 % of Fibonnaci. We can also see that BTC is forming a huge triangle which will end in 2021, this will be the biggest BullRun that we've ever seen in the crypto history.

Good time to acquire BitcoinsBTC WXY (3-3-5) correction is over. It is a good time to buy Bitcoins. Expect new highs.
