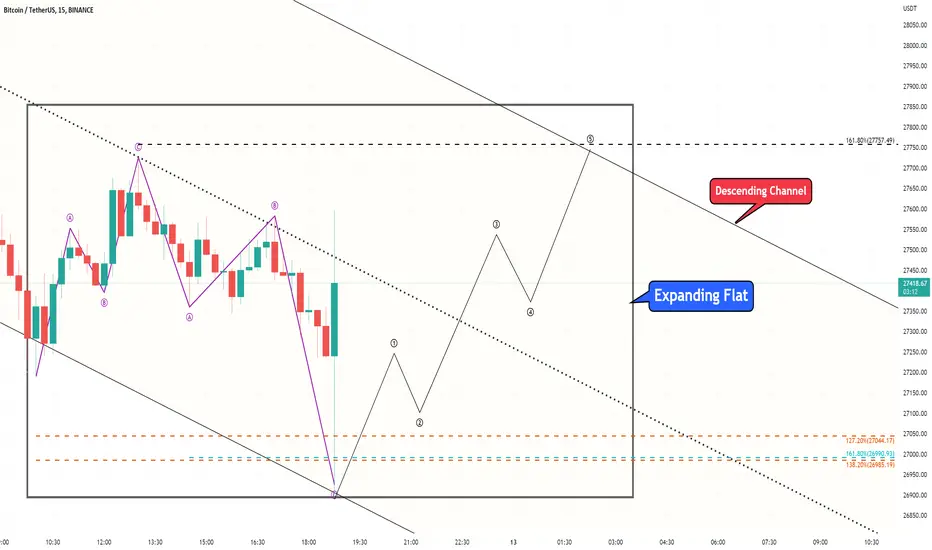
Bitcoin Analyze (Short Term, Expanding Flat)!!!✅Bitcoin is running in Expanding Flat correction these hours, and I expect it Will grow up at least to the upper line of Descending Channel.
Bitcoin was able to move as I expected in my last post about Bitcoin analysis.👇
Bitcoin Analyze ( BTCUSDT ) Timeframe 15min⏰
Do not forget to put Stop loss for your positions (For every position you want to open).
Please follow your strategy, this is just my idea, and I will be glad to see your ideas in this post.
Please do not forget the ✅' like'✅ button 🙏😊 & Share it with your friends; thanks, and Trade safe.
BTCBUSD
BTCUSD monthly, looking at possible repetition of 2017A chart to show comparible drops in BTC price, over similar timeframes to the December 2017 crash.
Bring us at 11k, below the mining cost. Be weary my friends... we may not see 'sunshine, lollipops and rainbows' for some time

Bitcoin Global $30k > $24k > $32k > $20k > $75k > $65k > $230k+Found a very interesting pattern. Below I will describe the opinion on why the price is pumping and dumping, and how this is related to Halving.
Thoughts will come together at the end of the reading.
First. Important. Everything has a pattern, even chaos theory. We see that Bitcoin is moving at clear levels, even on small timeframes.
The level of 0.618 is always the level of the transition of the market into a Bullish trend.
Level 1.618 - the level was twice known as a growth stop point, with a transition to a local Bearish trend. In 2013 there was a correction of ~75%, but now the predicted bottom of $20,000 fits into this model, also ~75%.
Level 2.3 is the ATH of the market, where the global super-growth cycle ends.
Second. Opinion. “Miners regularly sell some bitcoin to cover production costs. While maintaining the scale of production, these costs don't change, that is, the market is ~steady sales pressure. Halving puts miners in front of the fact that now they will receive half as much bitcoins while maintaining their capacities and mining complexity.
Thus, due to the dictated outlook, before the halving, they are forced to accumulate bitcoins in order to smooth out the stress of reducing the reward in the future and survive it. That is, before the halving, the supply decreases and demand begins to prevail, which causes the price to rise. Further, after the halving, they are spending even more than before to survive the cataclysm without reducing production and the pressure is even more intense than before, which causes a post-halving correction. Well, then there is an adaptation of the psyche of market participants to new realities, in which they receive less, that is, they adjust to the new order and either increase capacity, oro reduce their appetites and the market grows organically due to the mechanical decrease in supply and emission.
My predication: $30k > $24k > $32k > $20k > $75k > $65k > $230k+
Still I'm waiting for signal from my Global indicator, based on on-chain data.
Local view (1D)

Bitcoin GLOBAL +6241% and +1686%. Need next signal?👨🏻💻 I read the news and see another agenda for the global long...
Don’t read the ****** who, for the sake of hype, always talk about global long.
On the chart, my indicator on time 1 Month. GMP Market Status -2 (Bottom Soon). We have to wait for the GMP status -3 (Buy the Dip) to start entering BTC global long positions. Probably closer to $20k. It perfectly defines Bottom and Top, based on 14 on-chain data + Ai analysis.
Waiting for the DIP!

Bitcoin 18500$ and 8250$hello dear friends. While we are experiencing the early stages of the bear market, I would like to share with you that there may be revenues in the coming days.

facebook and bitcoin In the weekly time, a pattern has been formed in Bitcoin, which in my analysis, I have shown, this pattern was formed in 2013 on Facebook.
Even the dropout rate of this template is the same on facebook and bitcoin
So this pattern can be considered true in Bitcoin
Bitcoin has a significant resistance in the range of $ 38,000. If a weekly candelabra stabilizes above this range, we can see a tremendous market in the next 5 months.

BTC way to 12.5k , but Over 10 times I've spended reanalyzing this #BTCUSDT #BTCBUSD #BTCUSDC charts.
Filtering lot's of noisy and useless OBs , Gaps , ... .
Annnd that's it. I don't know what else I should do or see or dive to reach to better chart and setup.
Hope you DYOR .
Love your feedbacks

BTC is about to breakHello traders! Welcome back to another episode with Aadil1000x.
Today, pairs are looking excited and they are at the edge to fly.
Same with BTC, Bitcoin is hovering at the edge of the trendline and it can fly from here.
The tricky part is it has formed a channel before breaking towards the upside and it's a tricky move because it can fall from here towards the True reversal point or it will jump from here and later it will give a dip towards the actual reversal point or it can fly without touching true reversal point.
Thanks to the true reversal point strategy we know there is a strong reversal point that will not let it move down so we are strong bullish now.
The TR point is at 29189.
Don't forget to hit the like button and follow to stay connected.

Btc update As you can see btc again making rising wedge flag. 1st it followed same path and went to down. And now its same condition, its making rising wedge again so it can go below 2900 within few hours. So avoid long position.
For confirmation of rising wedge ypu can see the pattern in 30, 1 and 4 hours chart.


BTC - 38K COMES FIRSTThe first target I can see for BTC is around 38k, I mean at least 38k. Also we might even hit 28k or so again but 38k will come anyway. So from here 30k, there can be 25% up for BTC and around 40% up (or more) for Alts.
I am also still buliish for the long term.

BTC - DO WE TOUCH 20K?BTC hold 30k in monthly time frame which is very important but one of the reason the market is slow growing is that the market is still in fear and most folks probably waiting for 20k or so to buy and the volume is quite low but my conclusion is that it is very unlikely we touch 20k.
From this point, 31k, we can go lower or range like 28 or maybe 26k but I dont think 20k would happen.

BTC Trend Reversal Coming Or Not? BTC vs USDT.D
USDT.D Bullish = BTC Bearish / USDT.D Bearish = BTC Bullish
I don't think I have to explain much, All eyes on USDT.D Weekly close looking for Bearish Engulfing

BTC/USDTwe are trying again for Last time longing on Bitcoin . entry : 26000 $ , SL : 24000 $ , Target : 36280 $ , Lev : 2x....5x , just 10% of your asset . cross margin .

BTC - NO MOON NO ZEROWe never go either to the moon or going to zero but we can use this as a very great signal for buying / selling. Now we can feel the massive nagative feeling around the crypto market so ....
This world belongs to brave people.
Ehsan.F


Bitcoin. Save it to trade next 4 years. Order on $20500!Bitcoin. Save it to trade next 4 years. More in my profile. There is more local analysis.
I'm waiting for the GLOBAL BOTTOM on $20500. There is my order on spot. Write me any questions.

Bitcoin LEAD Global Idea. Personal.I don't want to talk a lot about this idea. Just save it and watch. I'm sure.


BTCUSDT: 28586 True reversal pointHello traders!
Previously I was expecting a rise after the 7th breakout but it looks like the market will break one more trendline before a rise.
The true reversal point is 28586 and I am expecting that market will reverse exactly from there.
I am expecting 11.5% rise. This rise will end at 31880 True reversal point.
Hope everything will work with pinpoint accuracy.
Don't forget to hit the like button and follow to stay connected.

BITCOIN UPDATE #4Welcome to our page BITCOIN100X
Here is the update for Bitcoin today on the lower time frame. Appreciate hitting the like button and leaving your personal opinion below on the comment section. Trading cryptocurrencies are highly risky and volatile which can lead to major losses.
The following chart interpretation is not a financial advice and following or investing based on the chart setups will be highly risky. Any future risks or losses incurred from any of these setups are not bared by BITCOIN100X.

Bitcoin: Bull vs bearThis chart is telling the main confluence point which is currently -> 100ema in 2h or 200ema in 1h
Bitcoin is also forming a triangle as you can see in the short term,.
1. If btc get's rejected again, i have marked the supports
1. Incase of a break above, Bitcoin will move to higher resistance levels.
Currently Bull power = Bear power, in macro, bears are in control. Let's see who will win.
I am just going to wait for trend confirmation and long/short accordingly
Cheers,
~Nav

Bitcoin Analyze (Short Term, Timeframe 15min)!!!Bitcoin Was able to Complete wave C By Ending Expanding Diagonal . My chart shows microwave 5 of wave C made in my TRZ (Time Reversal Zone) & PRZ (Price Reversal Zone). Also, We can see Regular Divergence ( RD- ) between MACD Indicator and Price .
As a result, I expect that when BTC breaks my Ascending Channel , it will go DOWN at least to 29650$ .
Bitcoin Analyze ( BTCUSDT ) Timeframe 15 Min⏰
Do not forget to put Stop loss for your positions (For every position you want to open).
Please follow your strategy , this is just my idea, and I will be glad to see your ideas in this post.
Please do not forget the ✅' like '✅ button 🙏😊 & Share it with your friends; thanks, and Trade safe.
