💡Signs of the FALL of Bitcoin(4-hour time frame)💡Bitcoin has NOT seen an upward or downward Sharpie movement for about 12 days and is moving in the form of a Range market ; this Range movement generally causes the formation of a Rectangle pattern .
Bitcoin is currently moving above the rectangle pattern and the 🔴 resistance zone($31,420-$31,220) 🔴.
💡 Signs 💡 of Bitcoin falling again from the resistance zone can be candlestick patterns: Hanging Man , Shooting Star , and Marubozu Candle .
Also, if we look at the RSI indicator , we can see that there is a strong Regular Divergence (RD-) between two consecutive peaks inside the rectangle pattern. In addition, the RSI indicator seems to be issuing one of the most reliable sell signals, the Bearish Failure Swing .👇
🔔I expect Bitcoin to fall to at least the 🟢 support zone($29,860-$29,420) 🟢 and the bottom of the rectangle pattern after breaking the uptrend line .
Bitcoin Analyze ( BTCUSDT ), 4-hour time frame ⏰.
Do not forget to put Stop loss for your positions (For every position you want to open).
Please follow your strategy, this is just my Idea, and I will be glad to see your ideas in this post.
Please do not forget the ✅' like '✅ button 🙏😊 & Share it with your friends; thanks, and Trade safe.
BTCBUSD

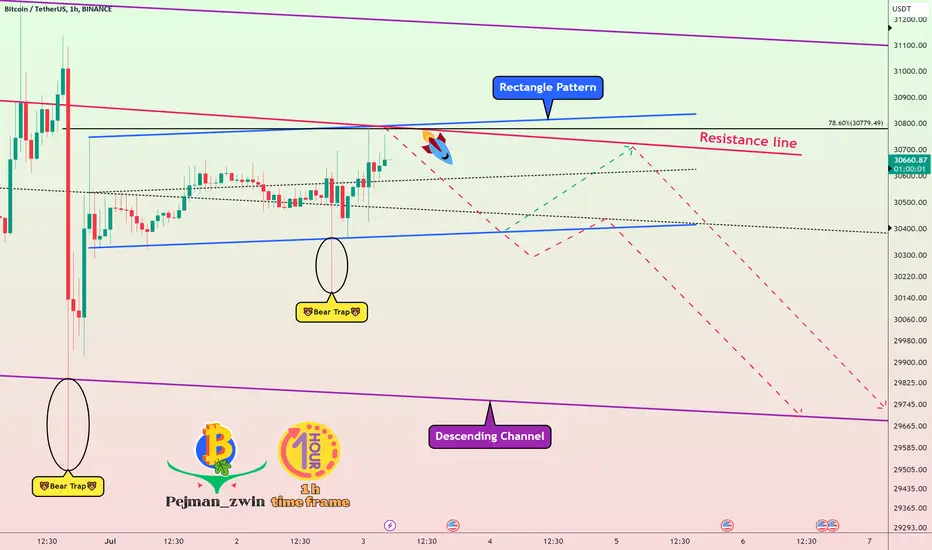
Bitcoin decline after completion of pullback(1-hour time frame)Hi everyone👋 (Reading time less than 2 minutes⏰).
First, I recommend you look at the 4-hour Bitcoin chart I shared yesterday.👇
Bitcoin started to decline after contacting the upper line of the rectangle pattern ; the first support in front of Bitcoin was the uptrend line .
Bitcoin managed to break the uptrend line (as I expected in yesterday's post) and started to go down and managed to break the 🟢 support zone($30,700-$30,560) 🟢 a few hours ago.
Bitcoin is currently completing a pullback to the broken 🟢 support zone($30,700-$30,560) 🟢.
Also, the 20 Simple Moving Average (20-SMA) went below the 60-SMA , which is a sell signal , and the resistance in front of the Bitcoin are 20-SMA and downtrend line , which has reacted well to this extreme move in the previous two minor pivots .
🔔I expect Bitcoin to fall to at least the 🟢 support zone($29,860-$29,420) 🟢 and the bottom of the rectangle pattern.
Bitcoin Analyze ( BTCUSDT ), 1-hour time frame ⏰.
Do not forget to put Stop loss for your positions (For every position you want to open).
Please follow your strategy, this is just my Idea, and I will be glad to see your ideas in this post.
Please do not forget the ✅' like '✅ button 🙏😊 & Share it with your friends; thanks, and Trade safe.

Massive Bearish Signal - Expect a big move to the downside! The present circumstances clearly indicate that the closing price has descended below the 20-week simple moving average (WSMA), a historical signifier of notable bearish market trends. While it is acknowledged that the 20 WSMA is not an infallible indicator, observing its historical behavior reveals a consistent pattern of significant downward movements in price. Consequently, it is logical to anticipate a substantial downward shift based on this historical precedent.
The bear market probability index is currently at an all-time high, which suggests that the ongoing rally could be considered the biggest bull trap ever witnessed in the history of Bitcoin. While relying on a solitary model is insufficient for drawing definitive conclusions, numerous indicators suggest a downward price trend in this case.
The US interest rate has reached the same level as it was during the onset of the 2008 Financial Crisis market decline. This should be taken into consideration. Despite this, on Twitter, someone claims almost every other day that BTC will reach 100k soon. However, in my opinion, this is complete nonsense. Given the current state of the financial market, it's not ready for a sustained uptrend.
Lastly, the market is experiencing a notable increase in fear, likely due to multiple factors simultaneously impacting the market. Based on historical precedent, it is reasonable to anticipate significant downward market movements should prior trends repeat themselves.
With regards to DXY
The current market analysis indicates a significant double-bottom reversal in the DXY index, with expectations of reaching a minimum index level of 105 soon. Moreover, should resistance zone 1 be surpassed, a subsequent movement towards resistance zone 3 is expected!
It is crucial to note that if the DXY index maintains its upward momentum, it may exert considerable downward pressure on both the stock and cryptocurrency markets. Consequently, it is advisable to closely monitor the movements of the DXY index, particularly for those involved in stock or cryptocurrency investments.

🚨Bitcoin Falls to the bottom of the Descending Channel🚨Bitcoin managed to form a Rectangle Pattern on Saturdays and Sundays when the trading volume was low.
I expect Bitcoin to react to the upper line of the rectangle pattern and the resistance line as the week begins and Bitcoin to fall to the bottom of the descending channel.
Bitcoin Analyze ( BTCUSDT ), 1-hour time frame ⏰.
Do not forget to put Stop loss for your positions (For every position you want to open).
Please follow your strategy, this is just my Idea, and I will be glad to see your ideas in this post.
Please do not forget the ✅' like '✅ button 🙏😊 & Share it with your friends; thanks, and Trade safe.

Bitcoin will go UP by 💎Diamond Pattern💎(15-min)Bitcoin followed the Downtrend line in the recent decline.
Also, Bitcoin succeeded in forming a 💎 Diamond Pattern 💎, which can be a sign of the failure of the downtrend line to the top.
I expect Bitcoin will go UP to at least the previous top and even a bit more.
Bitcoin Analyze ( BTCUSDT ), 15-minute time frame ⏰.
Do not forget to put Stop loss for your positions (For every position you want to open).
Please follow your strategy, this is just my Idea, and I will be glad to see your ideas in this post.
Please do not forget the ✅' like '✅ button 🙏😊 & Share it with your friends; thanks, and Trade safe.

Bitcoin Analyze (Road Map, 06/23/2023)!!!🗺️(15-min)Bitcoin confirmed the end of the main wave 4 after the Sharpie move today.
Bitcoin is currently completing main wave 5.
It seems that wave 4 of the main wave 5 will have a zigzag(ABC/5-3-5) structure so that the end of wave C can end in the 🟡 Price Reversal Zones(PRZ) 🟡.
🔔So, confirming the end of microwave 4 from the main wave 5, I expect Bitcoin to rise at least to the 🟡 yellow area 🟡 I marked on the chart.
❗️ Note ❗️:❌Below $30,256 , the scenario will change❌
Bitcoin Analyze ( BTCUSDT ), 15-minute time frame ⏰.
Do not forget to put Stop loss for your positions (For every position you want to open).
Please follow your strategy, this is just my Idea, and I will be glad to see your ideas in this post.
Please do not forget the ✅' like'✅ button 🙏😊 & Share it with your friends; thanks, and Trade safe.

See the forest clearly!A- When bad news is a good thing.
2023 banking crisis,
SEC Files 13 Charges Against Binance,
What happened next? $ 31000 ! why?
Because
B- The market has a nature!
a fully complete correction (characteristics):
1- Quite deep! (In plain English).
2- Should be recognizable (almost everyone realizes).
as a result, the bear market is officially over.
C- Wave XX depends on wave X (Target = Fib 0.618 (Fib (0.5)).
D- Technical Section (Lesser degree):
Wave 3 is less than 161.8% of wave 1 (I am Fibonacci biased).
Good luck.

This relative strength is really something! chart says it all
Advanced Level (Extended Wave 5)
Wave 5 has two different relationships:
1- If wave 3 is less than 161.8% of wave 1 -----> the 5th Wave overextends itself.
2- If Wave 3 is greater than 161.8% of wave 1 -----> Wave 5 = 100% , 161.8% or 262% of wave 1
As shown on this chart, wave 3 is less than 161.8% of wave 1
So
Extended Wave 5 =
either 61.8% x length (beginning of Wave 1 to top of Wave 3)
or
= 100% length of (beginning of Wave 1 to top of Wave 3)
or
= 161.8% x length of (beginning of Wave 1 to top of Wave 3)
Target = $ 39650

BTC LONG TERM Hello,
Today, we want to provide you with an analysis of the current Bitcoin chart, highlighting the significant levels to watch and potential trading strategies.
Bitcoin is currently hovering around a historically crucial resistance level. While it may not be the ideal time to enter a long position, there could be opportunities to take short positions with manageable risks.
The region we are currently in started to be regarded as a resistance level after losing it on July 12, 2022. Bitcoin attempted to reclaim this level on April 10, 2023, but experienced a retracement within approximately one week, falling back to around $24,000.
Now, we find ourselves back in this level. Bitcoin, which has been accumulating for a prolonged period and facing negative news sentiment, seems poised to surpass this level.
If Bitcoin manages to break above the S/R Flip level and the levels we anticipate (as indicated by the red lines on the chart), it would signal a bullish momentum shift.
However, in case of a retracement, we will closely monitor the lower boundary of the ascending channel within which the price is currently moving.
As the price action unfolds, we will continue updating the chart accordingly.
Wishing you profitable trades!
Best regards,
CryptoSignalAPP

Bitcoin Analyze (Master Candle in 1-hour time frame)!!!📚 What is the Master Candle❗️❓📚
First of all, I am going to describe what is a Master Candle. Basically, these are the candle with big bodies and wicks (the sticks over and under the body of the candle) marking a new high or a new low and whose extension or range covers the following 4 or more candles.
Usually, if we observe the formation of a master candle, we can determine a range between the maximum and minimum of that candle which will be stronger the more candles are within the range. It is therefore expected that in the event of rupture, the prince will make a fairly strong movement in the direction in which the breakout occurs. For this reason, it is recommended to apply this trading strategy in instruments and assets that are sufficiently volatile in order to capture a strong movement.
🔔It seems that Bitcoin was able to create a Master Candle in the 1-hour time frame; it is expected that the lowest price of the master candle will be broken in the next 3️⃣ to 5️⃣ candles .
🔔The minimum amount of drop can be equal to the distance between the highest and lowest price of Master Candle .
🔔Also, Bitcoin was able to make a rising wedge near the downtrend line in a 15-minute time frame .
Bitcoin Analyze ( BTCUSDT ), 1-hour time frame ⏰.
Do not forget to put Stop loss for your positions (For every position you want to open).
Please follow your strategy, this is just my Idea, and I will be glad to see your ideas in this post.
Please do not forget the ✅' like '✅ button 🙏😊 & Share it with your friends; thanks, and Trade safe.

IMHO On Mar 15, I suggested that (Target 2 = $ 30328):
It did.
There are two possible scenarios since then:
1- Scenario No 1: The trend is up (Bitcoin is trading in an uptrend channel) and there is no denying that right now (Impulsive rally).
2- Scenario No 2: a normal corrective rally (once bitten twice shy!)
Good Luck.

Bitcoin Analyze (Road Map, 05/01/2023)!!!🗺️Hi everyone👋.
As mentioned in previous posts, Bitcoin failed to break the 🔴 heavy resistance zone($ 32,420-$ 28,900) 🔴 in the first⚔️ attack⚔️.
According to the theory of Elliott waves, Bitcoin completed the 5th wave at $ 31,000 and is currently in a corrective phase. It takes time to recognize the structure of the corrective phase, but we can expect Bitcoin to fall into the 🟡 Price Reversal Zone(PRZ) 🟡 or 🟢 support zone($ 25,300-$ 23,940) 🟢 after breaking the support line.
💡 Signs of the end of wave 5 :
There is a Regular Divergence(RD-) between the end of wave 3 and the end of wave 5 in the RSI indicator (Bitcoin's growth last week was a pullback to the neckline of the Double Top pattern)👇.
There is a Regular Divergence(RD-) between the end of wave 3 and the end of wave 5 in the Volume indicator .
Crossing 50-EMA below 50-SMA (interesting to know that the first buy signal confirmed the start of wave 3 - the first sell signal confirmed the start of corrective wave 4 - the second buy signal confirmed the start of wave 5 - the second sell signal can start to confirm the corrective phase).
Bitcoin Analyze ( OKX:BTCUSDT ), Daily time frame ⏰.
Do not forget to put Stop loss for your positions (For every position you want to open).
Please follow your strategy, this is just my Idea, and I will be glad to see your ideas in this post.
Please do not forget the ✅' like '✅ button 🙏😊 & Share it with your friends; thanks, and Trade safe.

This sounds like a good beginning
Hoping for a retracement may not be a good experience!
Technical Section:

Bitcoin will go DOWN by Ascending Broadening Wedge Pattern-30minBitcoin was able to make an Ascending Broadening Wedge Pattern .
Bitcoin also managed to break the lower line of the Ascending Broadening Wedge Pattern.
I expect Bitcoin to drop DOWN to the 🟢 support zone($ 26,160-$ 26,030) 🟢.
Bitcoin Analyze ( BTCUSDT ), 30-minute time frame ⏰.
Do not forget to put Stop loss for your positions (For every position you want to open).
Please follow your strategy, this is just my Idea, and I will be glad to see your ideas in this post.
Please do not forget the ✅' like '✅ button 🙏😊 & Share it with your friends; thanks, and Trade safe.

Bitcoin will go UP by Three Rising Valleys Pattern🚀Bitcoin managed to break the downtrend line in the 15-minute time frame by breakout candle .
Bitcoin has also succeeded in forming a Three Rising Valleys pattern .
I expect Bitcoin to attack the 🔴 resistance zone($ 26,820-$ 26,720) 🔴 again after breaking Peak 2 .
Bitcoin Analyze ( BTCUSDT ), 15-minute time frame ⏰.
Do not forget to put Stop loss for your positions (For every position you want to open).
Please follow your strategy, this is just my Idea, and I will be glad to see your ideas in this post.
Please do not forget the ✅' like '✅ button 🙏😊 & Share it with your friends; thanks, and Trade safe.

Bitcoin falling again from the 🔴Resistance zone🔴Bitcoin was able to go up to the 🔴 resistance zone($ 25,760-$ 25,600) 🔴 after breaking the resistance line.
The wave structure in the 15-minute time frame appears to be Expanding Flat(ABC/3-3-5) , which is one of the most common corrective structures.
I expect Bitcoin to fall again from the 🔴resistance zone🔴 (there is also a possibility of a 🐮 bull trap 🐮).
Bitcoin Analyze ( BTCUSDT ), 15-minute time frame ⏰.
Do not forget to put Stop loss for your positions (For every position you want to open).
Please follow your strategy, this is just my Idea, and I will be glad to see your ideas in this post.
Please do not forget the ✅' like '✅ button 🙏😊 & Share it with your friends; thanks, and Trade safe.

Bitcoin is forming a Head and Shoulders Pattern(15-min)⏰It seems that Bitcoin is forming a Head and Shoulders pattern after failing to break the 🔴 resistance zone($ 26,150-$ 26,040) 🔴 so that the peak of the right shoulder of the pattern can be in the 🟡 Price Reversal Zone(PRZ) 🟡.
I expect Bitcoin to go down to at least the 🎯 target 🎯 I specified in the chart after breaking the neckline .
Bitcoin Analyze ( BTCUSDT ), 15-minute time frame ⏰.
Do not forget to put Stop loss for your positions (For every position you want to open).
Please follow your strategy, this is just my Idea, and I will be glad to see your ideas in this post.
Please do not forget the ✅' like '✅ button 🙏😊 & Share it with your friends; thanks, and Trade safe.

Bitcoin will go down by Ending Diagonal Pattern❗️❗️❗️Bitcoin seems to have completed its 4th wave with the common Expanding Flat(ABC/3-3-5) structure, so that the microwave C structure is Ending Diagonal .
I expect Bitcoin to move towards a 🟢 heavy support zone($ 26,400-$ 25,800) 🟢 after breaking the lower Ending Diagonal line.
Bitcoin Analyze ( BTCUSDT ), 1-hour time frame ⏰.
Do not forget to put Stop loss for your positions (For every position you want to open).
Please follow your strategy, this is just my Idea, and I will be glad to see your ideas in this post.
Please do not forget the ✅' like' ✅ button 🙏😊 & Share it with your friends; thanks, and Trade safe.

Bitcoin will go DOWN again (Short term)❗️❗️❗️In these few days, Bitcoin managed to move from its 🟢 heavy support zone($ 26,400-$ 25,800) 🟢 to the top of the descending channel and the 🔴 resistance zone ($ 28,000-$ 27,660) 🔴.
In this increase in Bitcoin, we can see the Regular Divergence(RD-) between volume and price, as well as the Hidden Divergence(HD-) between price and oscillator.
I expect Bitcoin to decline again from the top of the descending channel and 🟡 Price Reversal Zone(PRZ) 🟡; this decline can follow the Fibonacci levels .
Bitcoin Analyze ( BTCUSDT ), 4-hour time frame ⏰.
Do not forget to put Stop loss for your positions (For every position you want to open).
Please follow your strategy, this is just my Idea, and I will be glad to see your ideas in this post.
Please do not forget the ✅' like '✅ button 🙏😊 & Share it with your friends; thanks, and Trade safe.

Bitcoin Road Map(15-Min)🗺️!!!Bitcoin started to grow again as I expected; the structure of impulse waves of Bitcoin is such that wave 3 is extended, and wave 5 finished in the resistance zone.
I tried to show the road map of BTC in a 15-minute time frame.
Bitcoin Analyze ( BTCUSDT ), 15-minute time frame ⏰.
Do not forget to put Stop loss for your positions (For every position you want to open).
Please follow your strategy, this is just my Idea, and I will be glad to see your ideas in this post.
Please do not forget the ✅' like '✅ button 🙏😊 & Share it with your friends; thanks, and Trade safe.

Bitcoin's rise to Middle line of Descending Channel(15-Min)🚀Bitcoin seems to have broken the heavy support zone, but to continue the downward trend, it is likely to create a pullback to the middle line of the descending channel and the 🟢 heavy support zone($ 26,400-$ 25,800) 🟢.
Also, we can see Regular Divergence(RD+) between two consecutive valleys.
I expect Bitcoin to go up to the middle line of the descending channel after breaking the downtrend line.
Bitcoin Analyze ( BTCUSDT ), 15-minute time frame ⏰.
Do not forget to put Stop loss for your positions (For every position you want to open).
Please follow your strategy, this is just my Idea, and I will be glad to see your ideas in this post.
Please do not forget the ✅' like '✅ button 🙏😊 & Share it with your friends; thanks, and Trade safe.

Bitcoin will go DOWN by 🦇Bearish Bat Harmonic Pattern🦇(15-Min)Bitcoin is moving in ascending channel for a few hours⏰.
Also, Bitcoin created the 🦇 Bearish Bat Harmonic Pattern 🦇 near the 🔴resistance zone($ 27,350-$ 27,260)🔴; the confirmation sign of the D point of the pattern can be the creation of the Shooting Star candlestick pattern above the ascending channel and near the resistance zone.
I expect Bitcoin to start its downward trend again in the coming hours after breaking the lower line of ascending channel.
Bitcoin Analyze ( BTCUSDT ), 15-minute time frame ⏰.
Do not forget to put Stop loss for your positions (For every position you want to open).
Please follow your strategy, this is just my Idea, and I will be glad to see your ideas in this post.
Please do not forget the ✅' like '✅ button 🙏😊 & Share it with your friends; thanks, and Trade safe.
