BTC Buy / Long SetupWait for the entry till London Session, and Hold the trade, Must use SL with proper risk management.
Btcbuy

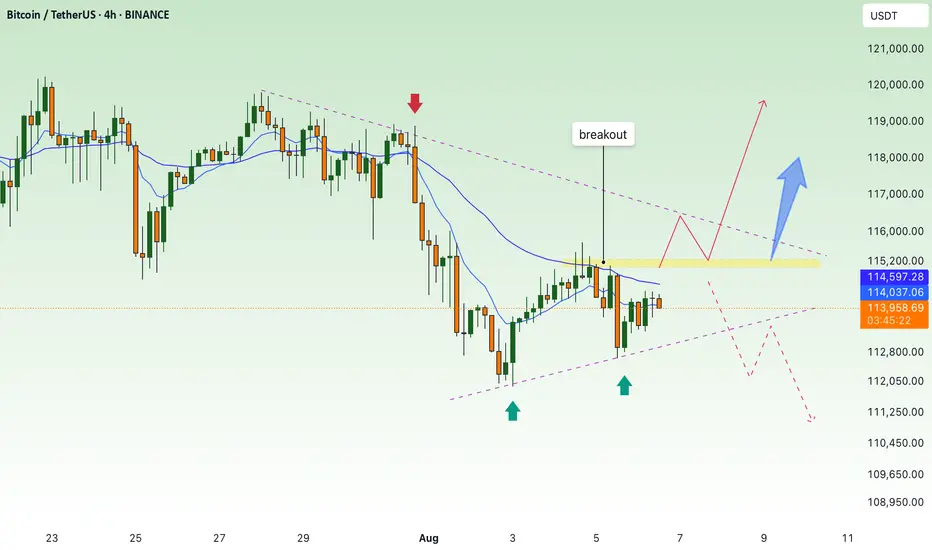
BTC continues to accumulate, waiting for breakout to go up💎 MID-WEEK BTC PLAN UPDATE (06/08)
Brief BTC Analysis – 4H Timeframe:
• Main Trend: Price is consolidating within a descending channel (green diagonal lines).
• Support: The 112,500–113,000 zone has been tested twice and bounced (green arrows).
• Resistance: The 114,800–115,200 zone (purple area) – this is the key level that will determine the next trend.
⸻
Two main scenarios:
🔺 Bullish Scenario (Preferred):
• Price breaks above the 115,200 resistance zone → confirms a breakout from the descending channel.
• Next targets: 116,500 → 119,000.
🔻 Bearish Scenario:
• Price gets rejected at around 115,000 and breaks below the 113,000 support → likely to revisit 110,000.
📌 Key Signals to Watch:
• A clear breakout above 115,200 with volume is a strong buy signal.
• If the price fails to break this zone, consider selling once there is a clear bearish reaction.
Accumulate waiting for btc price increase💎 BTC PLAN UPDATE – End of July (31/07)
📊 BTC Technical Analysis (4H Timeframe – End of July)
✅ Positive Signals:
• BTC has broken out of the consolidation triangle pattern (blue diagonal line), indicating a potential strong uptrend.
• The current price is retesting the breakout support zone around 117,800–118,000 → showing a good reaction and creating upward momentum.
• MA50 and MA200 are starting to slope upwards → confirming increasing buying strength.
📈 Bullish Scenario:
• If BTC holds above 118,000, it is likely to move toward the nearest resistance zone at 119,900.
• After breaking 119,900, the next targets are:
→ 122,792 (Fibonacci 1.618)
→ Further target: 127,900 (Fibonacci 2.618)
🛑 Risk Note:
• If the price drops below 117,000, it’s important to monitor again, as it may retest a deeper support zone around 114,500.

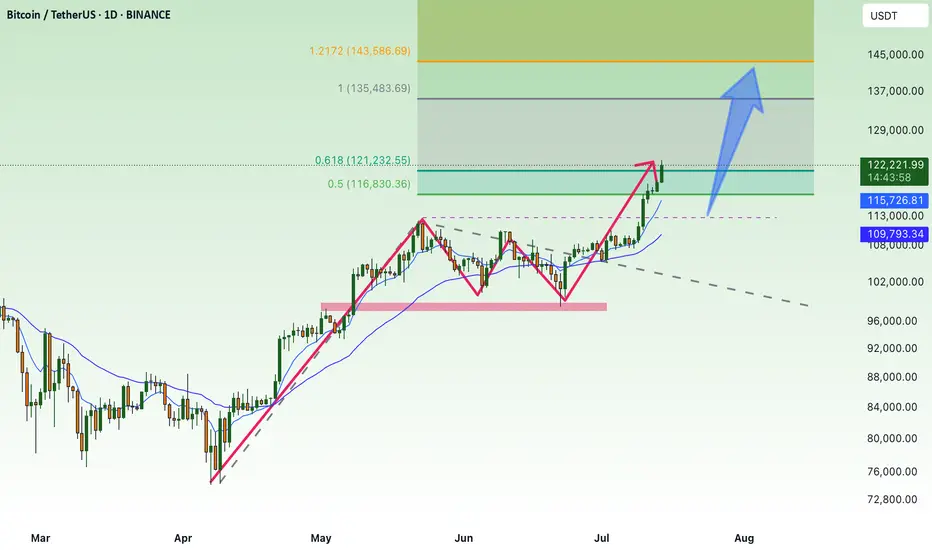
BTC Era, continue to create new ATH💎 BTC WEEKLY PLAN UPDATE (14 July )
NOTABLE NEWS ABOUT BTC
Bitcoin (BTC) broke above a key milestone on Friday, setting a new all-time high of $119,999 with no signs of slowing down. The technical outlook supports further gains as momentum indicators remain strong and price action is solidly in price discovery mode, with the next potential target at $135.000
Bitcoin’s Next Stop: $135.000
Bitcoin entered price discovery on July 9, and since then, the king of cryptocurrencies has surged toward the $120,000 target—a key psychological level for traders. Early Monday during the Asian session, BTC climbed to a peak of $119,999, marking a new all-time high and the closest the asset has come to this milestone.
TECHNICAL ANALYSIS PERSPECTIVE
Two key momentum indicators on the daily timeframe signal underlying bullish momentum in Bitcoin, suggesting a potential for further upside. The Relative Strength Index (RSI) reads 76, and the Moving Average Convergence Divergence (MACD) is flashing green histogram bars above the neutral line.
However, if BTC undergoes a correction, it may extend its pullback to find support near the lower boundary of the Fair Value Gap (FVG) around $115,222.
Derivatives market data shows that $76 million was liquidated over the past 24 hours as BTC surged toward its new high. The long/short ratio, which is considered an indicator of bullish or bearish trader sentiment, is above 1—indicating that more derivative traders are optimistic about Bitcoin and are expecting further gains in the king of cryptocurrencies.
Stay tuned to the channel for updates.
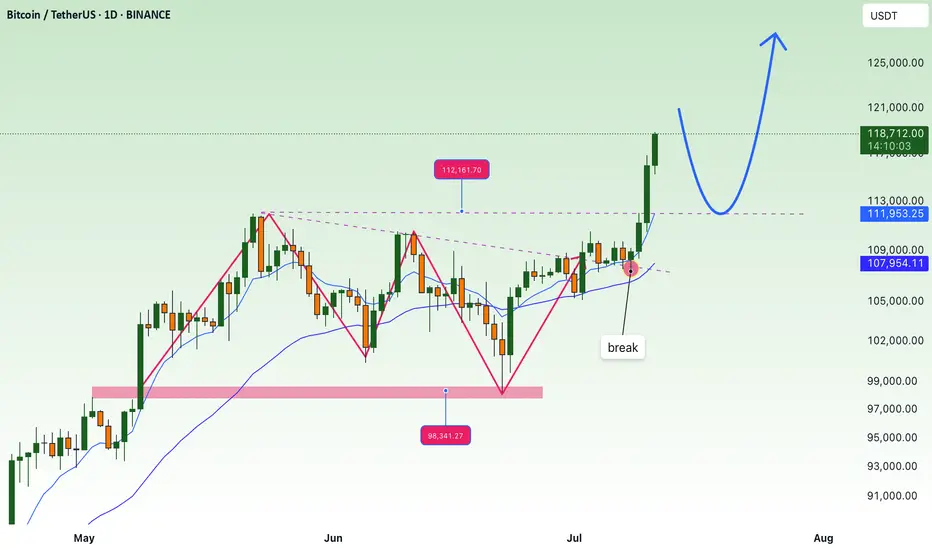
FOMO price increase, create new ATH💎 Update Plan BTC weekend (July 11)
Continuously creating a new ATH, preparing to have a short sale?
The reinforcement of Bitcoin price around the upper boundary of the previous consolidation area was broken at $ 108,355, which ended on Wednesday. The price has soared to the highest level of the new time of $ 116,868 on Thursday. At the time of writing on Friday, the price is fluctuating above $ 116,600.
When BTC entered the price exploration regime and if the trend of increasing continues, the price can expand the momentum to an important psychological level of $ 120,000.
Technical analysis angle
Our community has continuously chose the trend of increasing as the mainstream for all previous transactions and currently preparing to welcome 120k as forecast.
The relative power index (RSI) on the daily chart reaches 71, higher than the excess buying 70, showing a sharp increase. However, traders should be cautious because the ability to adjust the decrease is very high due to over -purchase. Meanwhile, the average divergence dynamic indicator (MACD) has shown a price intersection at the end of June. The indicator also shows that green histograms are increasing on neutral zero, showing that the rising momentum is being strengthened and continues to increase.
However, if BTC must be adjusted, the price may extend the decline to search and support around the upper boundary of the unified area that has been broken earlier at $ 108,355.
Plan has been constantly accurate in the past 2 months, which is the positive signal of the channel that brings value to the community.
Please follow the channel to receive accurate scenarios about gold and BTC
==> Comments for trend reference. Wishing investors successfully trading
BTC up following H1 trend linePlan BTC today: 07 July 2025
Related Information:!!!
Bitcoin (BTC) trades slightly below $109,000 at the time of writing on Monday, following its highest weekly close on record. Institutional and corporate demand continues to serve as a key catalyst, with Metaplanet acquiring an additional 2,205 BTC on Monday, while US-listed spot Bitcoin Exchange Traded Funds (ETFs) saw over $769 million in net inflows last week.
As market participants assess the latest bullish indicators, focus now shifts to broader macroeconomic developments, including new trade-related headlines and reports suggesting that the administration of US President Donald Trump may extend the current tariff pause until August 1.
personal opinion:!!!
BTC moves sideways in the trend line, trend line support 108,300
Important price zone to consider :!!!
support zone : 108.300
Sustainable trading to beat the market

waiting for new ATH this week , btc💎 BTC PLAN UPDATE FOR THE BEGINNING OF THE WEEK (07/07)
NOTABLE BITCOIN NEWS: Focus on 4 key points today
1. Elon Musk – “America Party” to Support Bitcoin
Elon Musk has confirmed that his newly formed political party, the “America Party,” will support Bitcoin, stating that “fiat is hopeless.”
2. Cup-and-Handle Pattern Analysis: Targeting $230K
According to technical analysis by Cointelegraph, BTC is forming a “cup and handle” pattern on the monthly chart, which could lead to a target peak of $230,000 if a breakout continues.
3. BTC Price Holds Steady Around $109K Amid “Crypto Week” and Trade Tensions
Bitcoin is currently trading around $109,000, influenced by “Crypto Week” and concerns over U.S. tariffs.
4. Institutional Inflows Increase, But Market Demand Weakens
According to CoinDesk, institutional investors are still buying BTC, but not enough to offset declining demand in the spot market, negatively affecting short-term market sentiment.
⸻
TECHNICAL ANALYSIS PERSPECTIVE
The short-term trend remains bullish. However, the steep slope of the trend indicates buying pressure is still being contested and unstable.
BTC remains stuck at Fibonacci levels—pay close attention to the resistance zones at 112K and 115K. If these two resistance levels are broken, investors may get the answer to whether BTC can approach the 120K level.
In the short term, both gold and BTC are moving sideways, indicating that market liquidity and investor capital are unstable and being divided across multiple portfolios.
==> This analysis is for reference only. Wishing all investors successful trading!

BTC Scalp Long / Buy SetupWait for the entry first, BTC must sweep the liquidation levels below side first then it should start pumping towards the tp, if it takes 2nd tp first then trade is not valid, if it takes first tp and then come back at entry level trade is still valid. if 4hr candle closing below the Bullish OB then close the position otherwise wick doesn't matter.

BTC continues to accumulate above 103,500Plan BTC today: 19 June 2025
Related Information:!!!
Bitcoin (BTC) price edges slightly higher, trading near $104,700 at the time of writing on Thursday, after stabilizing above a key level — the 50-day Exponential Moving Average (EMA) at $103,100. A breach below this level could trigger a sharp fall in BTC. Risk aversion could intensify, as reports indicate that US officials are preparing for a strike on Iran in the coming days. Despite this risk-off sentiment in global markets, institutional demand remains strong, with US spot Bitcoin Exchange Traded Funds (ETFs) seeing positive inflows for eight consecutive days
personal opinion:!!!
btc continues to accumulate above 103,500, the market is no longer sensitive to interest rate information yesterday
Important price zone to consider :!!!
support zone : 103.500 \ 101.000
Sustainable trading to beat the market

BTC accumulates above 104,300 zonePlan BTC today: 17 June 2025
Related Information:!!!
Bitcoin (BTC) price falls to around $106,000 at the time of writing on Tuesday following a mild recovery the previous day. The decline comes as investors continue to digest the escalation of the Iran-Israel conflict and after US President Donald Trump highlighted concerns and asked his security advisors to meet in the Situation Room. While institutional interest in Bitcoin remains robust, any further escalation in the Middle East could impact global risk assets.
The US steps in to resolve the Iran-Israel war
Bitcoin price action remained broadly resilient on Monday despite escalating tensions in the Middle East. The four-day-old war between Israel and Iran, which began on Friday, has so far failed to trigger a sharp correction. The largest cryptocurrency by market capitalization held above its key psychological threshold of 100,000 despite the initial shock — a contrast to April last year, when BTC fell more than 8% amid similar Iran-Israel turmoil.
The New York Times reported on Monday that US President Donald Trump has encouraged Vice President JD Vance and his Middle East envoy, Steve Witkoff, to offer to meet with the Iranians this week.
personal opinion:!!!
Gold price continues sideways and accumulates in 2 trend lines, support 104,300
Important price zone to consider :!!!
support zone : 104.300 - 104.100
Sustainable trading to beat the market

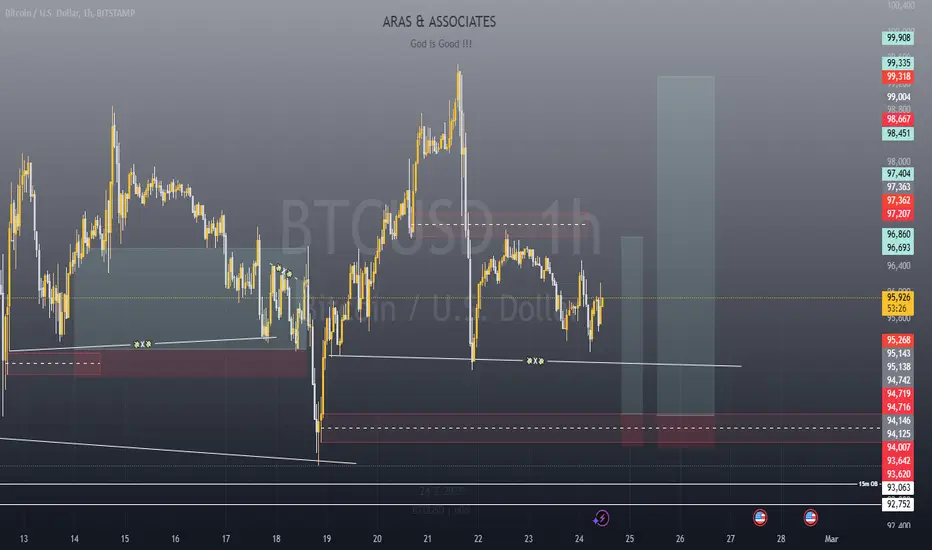
BTCUSD: Decoding the Price Action Through "Tape Reading"🚀 BTCUSD: Decoding the Price Action Through "Tape Reading" 🚀
Hey Traders,
Let's dive into a "tape reading" analysis of BTCUSD, breaking down the recent price movements and looking ahead. We've seen some fascinating patterns emerge, and understanding them could be key to our next moves.
🔍 A Look Back: The Bullish Flag Formations 🔍
Our journey begins on April 7th, 2025, with the establishment of a strong "Flag Pole" at $74,489.00. This was supported by a robust double bottom, setting the stage for what was to come.
First "Flag" Confirmation: We saw the first "Flag" form, confirmed by a powerful "Hammer" candle on April 20th, 2025. This Hammer, with its unique "bottom-less Marubozu" body, signaled significant underlying strength.
Second "Flag" Confirmation: Another "Flag" emerged, solidified by strong multi-day bottom support around $94,791.00. This resilience suggested continued upward momentum.
The Breakout: On May 8th, 2025, BTCUSD surged, breaking out of its previous patterns and entering a new "flag pole" formation.
Third "Flag" & All-Time High: May 15th, 2025, brought the third "Flag" formation, again supported by a "Hammer" and a bullish Marubozu. This momentum culminated in a breach of the $105,770.00 multi-month price level on May 20th, 2025, breaking the previous all-time high from December 17th, 2024! We then rocketed to a new all-time high of $112,000.
📉 Recent Developments: The Downtrend and Key Levels 📉
Since the all-time high, we've started to experience a shift:
Downtrend Begins: A downtrend initiated around May 22nd, 2025.
High-Low Formations: We observed a second high-low formation on May 27th, 2025, followed by another on June 9th, 2025.
Double Top & Hanging Man: A clear double top formation emerged, further supported by a "Hanging Man" candle on June 10th, 2025.
🔮 What's Next? The Critical Close 🔮
Today's candle close is absolutely paramount! As of now, the candle is still forming, but my current read suggests a potential move to fill the wick of the June 13th, 2025, "Hammer" candle.
The direction BTCUSD takes – North or South – will largely be dictated by how today's candle closes. This will be our prime dominant signal.
Monthly Candle Perspective:
Interestingly, the Monthly candle is showing similar "Flag" patterns. Check out the chart here for a broader perspective:
Let me know your thoughts in the comments below! Are you seeing the same patterns?
Trade safe!
_________________________________________________________________________________
⚠️ Disclaimer: This post is educational content and does not constitute investment advice, financial advice, or trading recommendations. The views expressed here are based on technical analysis and are shared solely for informational purposes. The stock market is subject to risks, including capital loss, and readers should exercise due diligence before investing. We do not take responsibility for decisions made based on this content. Consult a certified financial advisor for personalized guidance.

Accumulate waiting for the next new ATH, BTC 💎 Update Plan BTC (May 26)
Notable news about BTC:
Bitcoin (BTC) is trading above $109,000 as of Monday, staging a solid rebound after Friday’s sharp pullback. The recovery has been largely driven by renewed optimism following US President Donald Trump’s decision to postpone the implementation of a 50% tariff on European Union imports. This move helped calm market jitters and reignited investor appetite for risk assets, including digital currencies.
Institutional interest in Bitcoin also appears to be gaining momentum, with the latest data showing the strongest weekly inflows since late April—an encouraging sign that confidence in the asset remains resilient despite recent volatility.
Trump’s tariff delay spurs BTC bounce
In a post on his Truth Social platform, President Trump announced an extension of the EU tariff deadline to July 9, backing away from the previously scheduled June 1 hike. This announcement came just days after he criticized the lack of progress in negotiations with Brussels, which had rattled markets and led to a 3.9% drop in BTC on Friday. The policy reversal helped restore calm and provided a tailwind for Bitcoin’s upward move to start the week.
Technical analysis angle
The question that investors most interested now is when BTC will have 120k?
Congratulations to the investors. BTC goes on our analysis. Although the price is sideways, we still earn 3000 prices from this coin.
Note that the 113k region can be an important price area for adjustment before 120k and even higher
🔥BTC 4H is currently in the adjustment phase, this time will cause a lot of traders, Future - Margin to lose money, this rhythm will last long
At this time, whether new or old, should spend more time to practice, load more knowledge about the PTKT, as well as find knowledge posts at the channel ..., to strengthen the solid foundation, as well as avoid losing money at this time offline
==> Comments for trend reference. Wishing investors successfully trading

waiting for ATH BTC, the inevitable will come💎 Update Plan BTC (May 20)
Notable news about BTC:
After briefly surging to 107k, Bitcoin (BTC) has retreated into consolidation, hovering within the familiar 102k–105k range that has defined the past 10 days. Market focus remains fixated on the 109.5k level and the potential for fresh all-time highs.
Mounting concerns over U.S. fiscal stability have bolstered BTC’s recovery to 105k, following Moody’s decision to downgrade the U.S. sovereign credit rating—making it the third major agency to do so. The downgrade, which cut the rating from Aaa to Aa1, highlights growing risks associated with U.S. government debt, now exceeding $36 trillion, and casts doubt on the long-held perception of U.S. Treasuries as the ultimate safe-haven asset.
Adding to fiscal worries, former President Trump’s proposed “big and beautiful” tax legislation—if passed—could further inflate the national debt. The bill, recently advanced by a congressional committee, has sparked fears of significantly widening the federal deficit, with estimates projecting trillions in additional debt over the coming decade. While the White House maintains that the bill will spur growth without increasing the deficit, rising long-term borrowing costs suggest markets remain unconvinced.
Technical analysis angle
The question that investors most interested now is when BTC will have 120k?
Looking at TF H4 will see the repetition of the trend (accumulating => increase)
In the coming time, pay attention to 107k and 110k obstacles, these will be two milestones before the price reaches 120k
Canh Long around the 103k price in the near future
🔥BTC 4H is currently in the adjustment phase, this time will cause a lot of traders, Future - Margin to lose money, this beat will last until 21-22/5
==> Comments for trend reference. Wishing investors successfully trading

Can BTC reach new high?Notable news about BTC:
A sudden sell-off in cryptocurrency markets late Monday wiped out earlier gains, with over $500 million in long positions liquidated as Bitcoin (BTC) retreated from weekend highs. The downturn followed easing U.S.-China trade tensions, which appeared to shift investor sentiment away from risk assets.
According to Coinglass, more than $530 million in leveraged long positions were liquidated over the past 24 hours. Bitcoin-related futures accounted for nearly $200 million of that total, while Ether (ETH) products saw around $170 million in liquidations.
Liquidations occur when an exchange forcefully closes a trader’s leveraged position due to a drop in collateral value, typically triggered by sharp market moves. This mechanism kicks in when traders can no longer meet the required margin to sustain their open positions.
Technical analysis angle
As analyzed earlier after the price of BTC breaking the 96k landmark has returned to the period over 100k
Currently, the BTC price is still passing in the 105k resistance stage and the important trend of the trend of increasing at 98k
About 98k continues to consume the trend of this currency
With the current news and price lines, it will still be supporting the increase in the trend
==> Comments for trend reference. Wishing investors successfully trading

Btc Future Scalp setupEnter at cmp 104200 2nd entry 103k, Sl 1hr closes below 102920 on binance future chart. Tp 106k this is a touch n go zone so put limit 105.8k. until unless we don't closes below 102920 at least 2hrs candle chances are high for new ath.

Waiting for a big boost for the market, over 90K BTC💎 BTC PLAN UPDATE (April 16)
First of all, congratulations to the investors. Everything went according to our trading plan and we had very good comments. Specifically, yesterday the price fell from the 86k area straight to 83k. We had more than 3000 prices together. Today's BTC trading plan did not change much.
NOTABLE NEWS ABOUT BTC:
According to Bloomberg, Bitcoin (BTC) mining hardware manufacturer Bitdeer is preparing to launch its own mining operation in the United States (US). The company intends to speed up the shipment of equipment following President Donald Trump's announcement of a 90-day tariff suspension. In addition, the pressure from tariffs has led to a decrease in Bitcoin mining hashrate among miners in the United States over the past month.
TECHNICAL VIEW
Bitcoin has faced multiple rejections around the 200-day exponential moving average (EMA) at $85,000 since Sunday. On Tuesday, BTC attempted to break above this level but was rejected and fell 1.12%. At the time of writing on Wednesday, the price was hovering around $83,500.
If BTC closes above $85,000 on a daily basis, it could extend its rally to the psychologically important $90,000 level. A successful close above this level could extend the rally to test the March 2 high of $95,000.
Please continue to pay attention to the 84.2k resistance zone, this is an important resistance zone before we DCA to higher and more important areas
==> Comments are for reference only. Wish investors successful trading

Bitcoin following 2013-2017 Fractal UPDATE - have we left it ?This chart remains unchanged from the last time I posted it except for the addition of that yellow Dashed Arrow
As we can see, PA fell below the Fractal in Late February and ever since, we have ranged further away from it.
Does this mean we have left the fractal we have been on since November 2021 ?
Not really.
PA fell below it in 2022 due to pressures from Interest rates making companies collapse and sentiment being negative.
We have fallen below it this time purely because PA was so overbought, it needed to recover.
This can be very clearly seen on the Weekly MACD, where in 2024, we ranged for months because of the same reason.
See how on the weekly MACD, how once we reached near Neutral, we bounced back up to a New ATH and, ever since, BTC PA has ranged while waiting for the MACD to cool off..
And now we are there. MACD is in the bounce zone and has shown some strength in the last few days.
So, The Fractal
For PA to get back above that Fractal, we need PA to make a very strong push higher. and as you can see from the Bold Arrow, this is achievable by end of May if PA rises Strong and continually
form here.
I am not to sure this will happen.
We have so many Macro events destabilising the markets...
I am more inclined to think PA will hit that circle , and we will likely follow the Dashed Arrow to a cycle ATH of near 300K, by the end of the year at the latest.
This is the Path of safety.
Things can always change for the better or for the worse and so we have to be ready for all occasions.
But BULLISH is the word - BUT BITCOIN ON SPOT, HOLD IT AND RELAX

BITCOIN weekly and 50 SMA - has VERY good newsAs you can easily See, despite all the unsettled News and events in recent days, the current Week candle has returned to GREEN having hit that 50 SMA.
To remind you, we began the week with a RED candle BELOW that 50 SMA.
This is Very important for sentiment. We bounced off that 50 back in 2024 and went to ATH.
To remind you, we have hit the 50 at the same time as the weekly MACD has entered a Bounce Zone, very near Neutral.
The MACD chart above shows you that the Histogram bar has also returned to White, showing a possible turn of favour from Bearish to Bullish.
BITCOIN IS SO READY TO GO
We just need the investors that are pouring money into the Snail called GOLD, to realise the Future is BITCOIN
We wait

Analysis of Bitcoin’s Price MovementsI. Technical Analysis
(1) Support and Resistance Levels
BTC has formed a strong support level at $80,000. Judging from past market performances, this price level has successfully withstood selling pressure multiple times, demonstrating the market's recognition of its value at this price. When the price dropped to $82,000, a certain degree of rebound occurred, indicating the presence of buying support below. This also indirectly confirms the effectiveness of the $80,000 support level. As a resistance level, $87,000 restricts the upward movement of BTC. The failure of this attempt to break through $89,000 indicates that selling pressure is relatively strong above this price level.
(2) Moving Average System
Although the short - term moving averages of BTC have turned downward to some extent due to price declines, the long - term moving averages still maintain an upward trend. This indicates that, in the long run, the upward trend of BTC has not been completely disrupted. Short - term price fluctuations may just be normal market adjustments. When the short - term moving averages gradually recover and cross above the long - term moving averages again, a golden cross is expected to form, providing technical support for the upward movement of BTC.
(3) Technical Indicators
The Relative Strength Index (RSI) shows that BTC is currently in the oversold zone, which means there may be excessive selling in the market. Once market sentiment recovers, the price of BTC is expected to rebound. In addition, although the MACD indicator shows a bearish signal, the bearish momentum is gradually weakening, suggesting that the market may be on the verge of a reversal.
💎💎💎 BTC 💎💎💎
🎁 Buy@80500 - 81000
🎁 TP 83000 84000 85000
The market has been extremely volatile lately. If you can't figure out the market's direction, you'll only be a cash dispenser for others. If you also want to succeed,Follow the link below to get my daily strategy updates

BITCOIN IDEA
After retest price FVG and level 70 of FIBO and liqudity taken of 2 previous weekly low we will see a reversal to taken liqudity buyside at 109312

Rinse & Repeat !!!Hello everyone, a happy new trading week to you all !.
This setup is particularly a short-term buy for those looking to take advantage of BTC's range that has been refusing to take a side.
A good RRR trade that's sure to make you a bit of money. Use proper risk and money management (risk what you're willing to not get bothered by) and most especially, do your own analysis for extra confluence !.
Bitcoin 30 minutes possible buy Bitcoin has been in a range for a while and it's looking like there is a possible buy currently

BTC back below 100kSo btc is flagging hard... is this a bull flag? on the faster time frames yes... slower time frames we are forming a bear flag.... which way do we go....if its down....buy buy buy!
if its up....memecoin it up and be your best degen...
Put Crypto into NFTart.... share the love
