BTCUSD LongHello guys.
This pair has now completed the falling flag pattern. I now anticipate that the price will retest the zone, before building a bullish momentum! With that, the entry price and stop loss will change, but the target is still 30100.
Btcbuy

BTCUSDT Price PredictionAs BTC on 4h timeframe has broken back above a key level of structure (highlighted as green) and is currently retesting it as support, a rally to the next supply zone around 30000 mark (highlighted in red) could be expected.

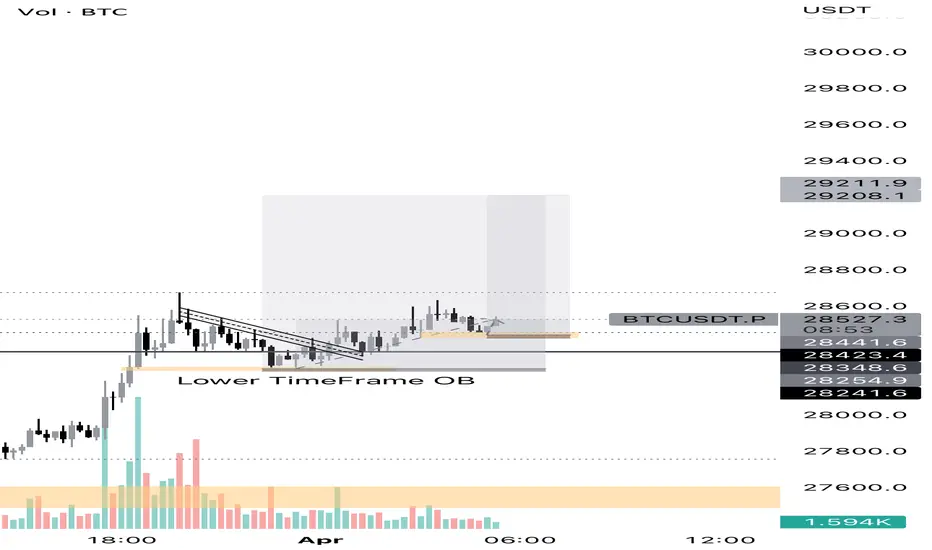
BTC can see a bounce from this OB before further lossesThe 1-hour bullish order block (cyan) at $27,750 could see a minor bounce in prices.
However the 4-hour and daily timeframe structures were bearish and showed that the trend pointed downward
The RSI and OBV noted declines to reflect selling pressure in recent hours
A session close below bullish hourly OB will invalidate the idea
Entry: $27,917
Exit: $28,750 (next LTF resistance)
Stop-loss: $27,620 (below OB)
R:R- 2.8

Symmetrical triangle in BTCUSD with bullish biasH4 chart of BTCUSD making symmetrical triangle which means it can go in either direction however, there is bullish bias as there was Bullish divergence at the last LLs and the last LL was broken and new HH was printed at the level of 30150. So now 2 levels are important to determine direction of market if the last HL (27350) is broken trend will go bearish and if the last HH (30160) is broken then trend will go bullish. Most probably, market will go in up direction after breaking 30150 level so we should plan our buy stop entry at the break of 30150 and sell entry at the break of 27350.

BITCOIN is BULLISHThe Bitcoin index is setting up for another bullish run. We are looking at BTC making a support at price ranges 26622.06 - 24583.32 before beginning an upward trend. Prepare to take your positions at price action.
Monitor for updates...

Bitcoin broke the resistance above into April #EasterBullRun !!!I have been following bitcoin for the past 3 months trying to catch the bottom and top of this rally, It's not an easy task so I urge you to take my word as an Easter gift because #BTC just broke the line resistance line above 28K. #EasterBullRun #EasterBullish
As usual, We all know it's not possible to catch the top or bottom of any market but 80-90% accuracy is enough to make you win big !!
Just buy $BTC and hold till 100k !!

Btc Giving another long 1:40 RR TradeThis is a continuation of my previous trade where we bought BTC at 28255 and will hold till 29200 having our stooss at 28235. So we know the current trend is bullish, price created an imbalance between 28420-28450 we trader that and will hold till 29200
BTC Long 1:37 RR RatioBTC making bullish flag and matigated the nearest lower timeframe orderblock it very likely to head toward 29000. Try to hold your positions till 29800 atleast.

XAUUSDbuy final hack MatrixV Tomorrow I have a NPC school exam, but I don't care because I control the Matrix/Stockmarket/Cashflow, and one day I will cause that my teachers, which gave me bad grades, will lose all their money, when I say them they should buy XAUUSD at this point, where the banks will knock out all retail traders ("HeY DiD yOu HeAr ThAt GoLd Is VeRy PrOfItAbLe? I tHiNk I wILl BuY gOld NoW aT 3.500")
Explanation of the chart:
Last resistance zone made a divergence in the MACD
Price is now on the previous level with a lower MACD rate and soon it will have a crossover and also perfectly touched my fibonacci zones
In the 5min chart we have a consolidation perfect for sniper entrys wait for breakout/retest or use imbalance
TP 1: 2000
TP 2: 2500
TP 3: 3500
GG Ez MatrixV

BTC Moving Very Good Last Days , Any Long Setups Valid ?This Is An Educational + Analytic Content That Will Teach Why And How To Enter A Trade
Make Sure You Watch The Price Action Closely In Each Analysis As This Is A Very Important Part Of Our Method
Disclaimer : This Analysis Can Change At Anytime Without Notice And It Is Only For The Purpose Of Assisting Traders To Make Independent Investments Decisions.

BTC/USD BUY?Bitcoin flipping is another breakout.
Before 30k, tp is about $29,500
I think 30,000 beats $30,000, but there will definitely be a drop after that.

Bitcoin up we gohello everyone i am back again . i have drawn all the important fib levels to predict next btc move and up we go now

XAUUSD Bullrun TP 2500 MatrixVUSDJPY died last year after I had am important call with one of my partners.
XAUUSDbuy Hack was born and will continue
GG Ez MatrixV

btcusdt buy signalbtcusdt buy signal
Buying opportunity in the support range
Profit limit and loss limit are specified.

BTC LONGPrice might get to the support zone for bullish movement to the 18k zone, the is also imbalance at the spot left to fill before the bullish move

Very Strong Buy Indicator for BitcoinBitcoin seems very bullish today especially if the 1 day candle will close with a big green candle and small wicks.
1. We can see that the bitcoin price breaks out from its falling wedge in 4 hour timeframe. (Some will see the pattern as a descending triangle.)
2. The price crosses upward in the 200 SMA in the 1 hour timeframe. As long as it stays there, we are bullish.
3. DMI looks very bullish but we can see small pullbacks later on this day. As long as the ADX has positive slope its fine and the ADX has not been on above 50 level yet.
I'm looking forward for reversal of the bitcoin price but we still need more confirmation. I'm looking to hold my trade for a long time.

Bitcoin Buy on 1 Hour TimeframeHere are the list of why I'm buying based on 1 hour timeframe:
1. +Di is above the ADX and -DI.
2. As of now, we can see that the -DI will go below ADX which is very bullish indicator.
3. The slope of ADX also counts. The slope of ADX is preparing to go higher.
4. The 25 SMA and 100 SMA will cross.
It is very short term and the trend can quickly reversed because it's only 1 hour chart. the trade will last for 1-3 days.
My take profit indicator is when my +DI go below the ADX just like on my previous trade. (see link to related ideas)

Profit taking and Potential RallyThe -DI crosses below the ADX. That means profit taking for me and I'm looking for opportunities in 1 hour and 4 hour timeframe if it comes.
From now on, I am gonna wait for potential buying opportunity.
Check my related ideas. Sorry for hyping a 14k bitcoin haha.

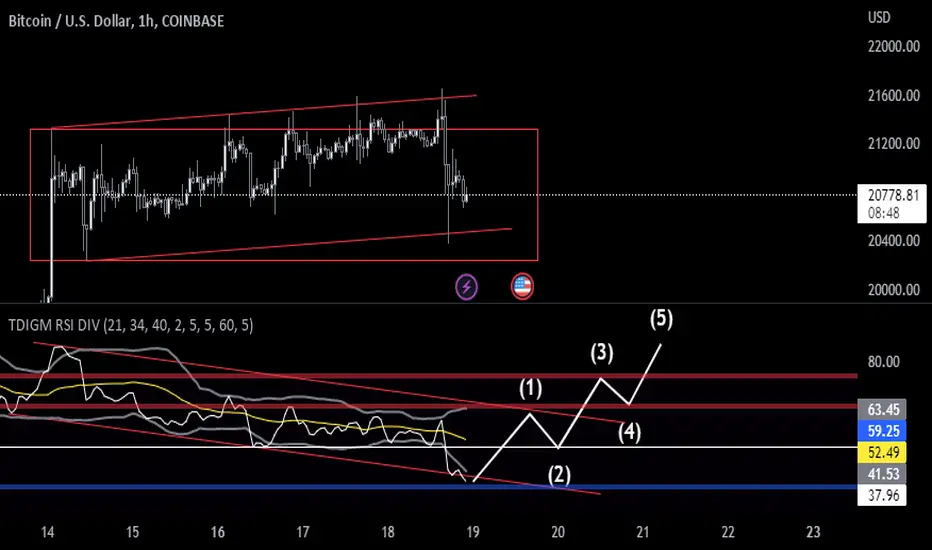
Now is the best time to buy BitcoinIn terms of Elliott wave counting rules and regulations
Wave 1 is over and now we are in the fall of wave 2
If we predict correctly and maintain the bottom level of wave 1, we can enter wave 3 and move upwards with strength.
The validity of this analysis is until the level of 17,660 is not broken down

BTCUSD-1H Analysis Hello traders,
Hope you are having a spectacular weekend.
Above is our analysis on BTCUSD. We are overall still bearish as we continue to believe that there is one more massive impulsive wave to the downside given that certain trading conditions and parameters are met.
From 24.5k-26k we would be looking to short, that would be a risky entry since there would be no prior confirmation other than structural points .
Hope our analysis helps you towards profitability
God bless,
ETGL TEAM <3

Bitcoin BuyI’m currently more inclined to go upward because we break the horizontal channel with a strong bullish candle and it just pull back.
I add more position to my long position.

Bitcoin BuyI might take some profits in 26,500.
If we break above the recent high, we will confirm the breakout.
DMI still looks good.
