BTCCNY
Ignore the manipulation, play the Chinese Trump card on BTCAll explained in detail on the graph but the simplification of the economic dynamic:
Major world market index over the last 12 Months have been highly correlated with BTC (exceptions do take place).
On Friday the 3rd August 2018 Chinese stocks ceded their ranking as the second-largest equity market in the world amid an elevation in trade tensions after the Trump administration said it was considering increasing the initial proposed tariff. Given China and Asian markets are major contributors to the value that BTC holds, BTC has taken a tumble despite US equity markets being on the rise.
Chinese markets will open in a few hours. One would hope considering they are at almost a one year low and under a temporary trade war that a knee jerk reaction will cause an influx of capital across the markets (US markets could be an exception).
In my opinion an exponential recovery of Bitcoin is imminent. The suppression of BTCUSD is from a number of temporary factors. I would consider this another buy opportunity.
Ignore manipulation, "buy when there's blood on the streets"It was looking so good for a bull run (it still is BTW) and then out of the blue on a Saturday the market has an immediate unpredictable crash. You could panic sell but in all likelihood this is a market manipulation caused so that you do exactly that. Indicators are still in place the an exponential rise so dont make the mistake of selling the dip.
Rothschild made a fortune buying in the panic "the time to buy is when there's blood in the streets."
Bitcoin Halving and ChartingBitcoin Halving :
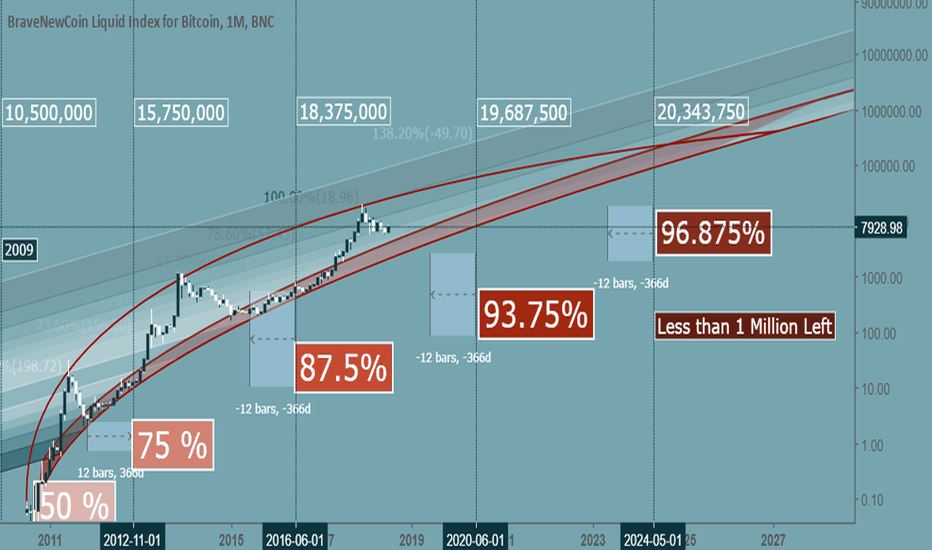
New bitcoins are issued by the Bitcoin network every 10 minutes. For the first four years of Bitcoin's existence, the amount of new bitcoins issued every 10 minutes was 50. Every four years, this number is cut in half. The day the reward halves is called a "halving".
In 2012, the amount of new bitcoins issued every 10 minutes dropped from 50 bitcoins to 25. In 2016, it dropped from 25 to 12.5. Now, in the 2020 halving, it will drop from 12.5 to 6.25. *1
This pattern will continue from now until the 64th halving (if (halvings >= 64) return 0;) but in practical terms it means that by 2140 there will be no block subsidy at all
that's gives us from 2024 to 2140 mining less than 1 million bitcoin price will sky rocket. *2
Total Bitcoin Right now 17,174,788
Next Halving mid 2020 and percentage will be 93.75% Mined leaving us with 1,312,500 BTC
So Join The New World Order
Happy Trading
A Fortnight in the SunCoinbase forming a PAC (Political Action Committee), Blackrock taking a deeper look at the market, Sherman's comments on Bitcoin, FATF (Financial Action Task Force) being asked to clarify KYC and AML procedures and regulations for crypto assets, the SEC's decision on a Bitcooin ETF (which, by the way, will probably be on, or after, August 16th: cryptodisrupt.com).... where's it all going?
I expect, with the help of my overlays and indicators, that Bitcoin will continue it's upward movement for the next two-three weeks before consolidating.
God Edition pinpointed an excellent buy opportunity a couple of weeks ago.
This has since been substantiated, in the yellow ellipse, by the 'Plot' (yellow line) crossing above the 'Swingbeat' (white line) in the CMO. This signals a current of bullish activity.
Not only this, but on the bottom of the screen we can see the 'Plot' (purple line) bracing, and preparing to cross, the 'Swingbeat' (white line) in the Longs vs Shorts indicator. We can also see that the 'Short' (red line) is beginning to converge with the 'Long' (green line) after a sudden divergence. This could be interpreted as a loss of bullish momentum, but I think it's better described as a consolidation of momentum after the recent surge in activity.
In lieu of the huge anticipation of a Bitcoin ETF, I expect that after the announcement (which I imagine, as many others do, will be a good one) we'll see some profit-taking.
The Pitchfork Top Call & Where Fractals Could Lead Us. Experimental Chart.
Due to lack of movment in the crypto market, I have been experimenting will less common tools to aid in technical analysis. The chart above shows a fully extended pitchfork that just about perfectly calls the top.
Not only that but each additional level below that acted as support or resistance at one time or another, meaning this pattern will likely continue.
Here is a chart showing how the original pitchfork was drawn:
I then added an two inside pitchforks to the previous tops. One at 20000 and the other at 1400 to see if there were any similarities in the pattern.
If we were to continue following the 2014 cycle we should have 1-2 additional legs down. I am very curious as to how accurate this ends up being.
I want to note that his analysis also supports a previous study done in March.
History is here to aid with predictions, but it rarely tells the future.
DISCLAIMER:
Please note I am only providing my own trading information for your benefit and insight to my trading techniques, you should do your own due diligence and not take this information as a trade signal.
Bitcoin Volume Study - Futures vs. SpotOver the course of the last 6 months Bitcoins spot volume has been plummeting while future volume has been rocketing on the backburner.
The two custom indicators above are a perfect display of this. The BTC World Volume displays the total traded Bitcoin Volume over the top 17 Bitcoin Exchanges and currency pairs. It then separates the futures market from the spot traded currency pairs.
Spot volume is shown in green.
Future Volume is shown in red.
The BTC Future Dominance indicator displays the percent value of the dominance of traded futures throughout the entire market.
Notice that the futures have remained dominate for the last 5 months, just after this ever-lasting bear trend started. Currently over 70% of the total volume in the market is futures alone.
Without separating the futures market from the BTC World Volume, it just appears that the total traded volume has increased dramatically. In many markets this is a very good sign, unfortunately that is not the case here at all. People trading futures are only trading mere contracts of Bitcoin and no actual transactions of Bitcoin are taking place. All in turn, meaning that the future traded volume does not affect the price of bitcoin.
What does affect the price of Bitcoin is the spot market. This is the buying and selling of actual Bitcoin; not contracts. The BTC World Volume indicator above shows how spot volume (green) has been plummeting since the all time high late last year. Just about the same time the futures market started its takeover.
Based on this analysis, I believe the spot market must redeem itself before there is any solid reversal for Bitcoin. However, at this time there is very little reason to trade actual Bitcoin over the futures market.
Here are just a few of those reasons:
Volatility is dying, which is likely due to the futures market anyways. As it takes volume from the spot market that actually affects the price.
Fees are significantly lower in the futures market. Market Makers are even paid for limit orders. This significantly beats the hefty percentage-based fees on traditional exchanges.
High leverage. Some futures exchanges offer up 100x leverage on some currency pairs. Most traditional crypto exchanges don’t even offer 2x on the spot market.
Bitcoin has been in a clear downtrend for over 6 months. There is no reason for people to buy and HODL at the moment.
There is no solid news for Bitcoin. I believe a catalyst such as an ETF announcement may be necessary for Bitcoin to make a full reversal.
If spot volume ever does make a return, I believe Bitcoin may have a fighting chance. However based on this data alone I believe BTC has found itself in quite the rut. We are in desperate need of some solid news and volume.
Then again, futures are used to stabilize traditional markets, why should Bitcoin be any different?
I hope you all found this analysis helpful and interesting!
I wish you all the best of luck!
BTCUS Trade OpportunityDetails:
Primary Pattern (Blue): Falling Wedge
Secondary Pattern(Orange): Descending Channel
Key Level(s): Red box
Buy break-out of local swing-high
TA: Bullish
Risk:Reward = 4
fundamental analysis: general is bearish (buy blood)
sentimental analysis: near-capitulation based on emotional market cycles
Red ChannelBack to (Red Channel) the longer term channel
RED Channel is seriously amazing one
First cycle before first halving in 2012 to second halving in 2016 it was touched 9 times everyone was a reversal point
Second cycle from Halving 2016 till now
it touched the trend channel 8 times
while middle one 9 times
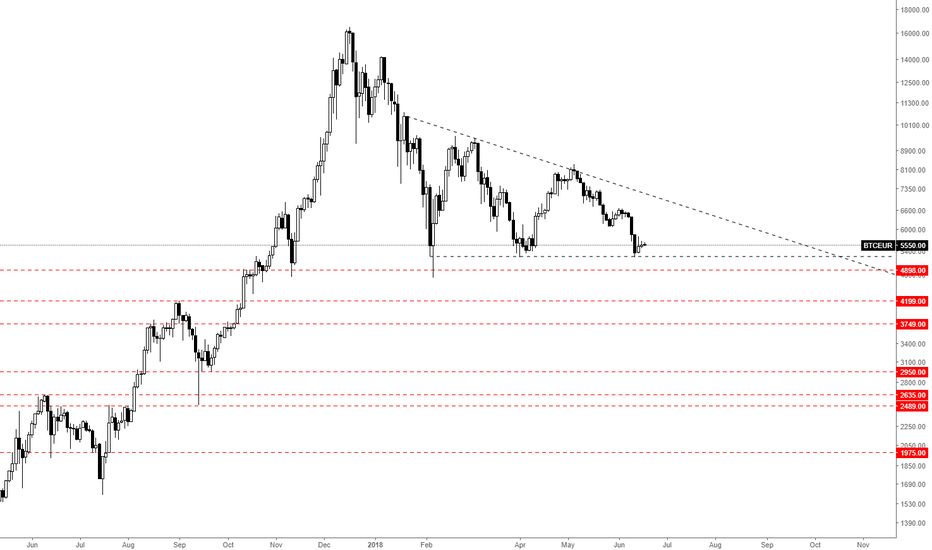
buying zone around 3000-5000 in purple boxes
Not financial idea just comparing fractals
Bull Trap let it goBuying zone in the red area
best buy opportunity for the next 4 years is coming
buying zone around 3000-5000 area
time around from now to 2 weeks
Not trading idea at all just anticipation and comparing fractals of 2014
here is your trading channel in red channel for next 2 years parabolic rise will occur after halving 6/2020


