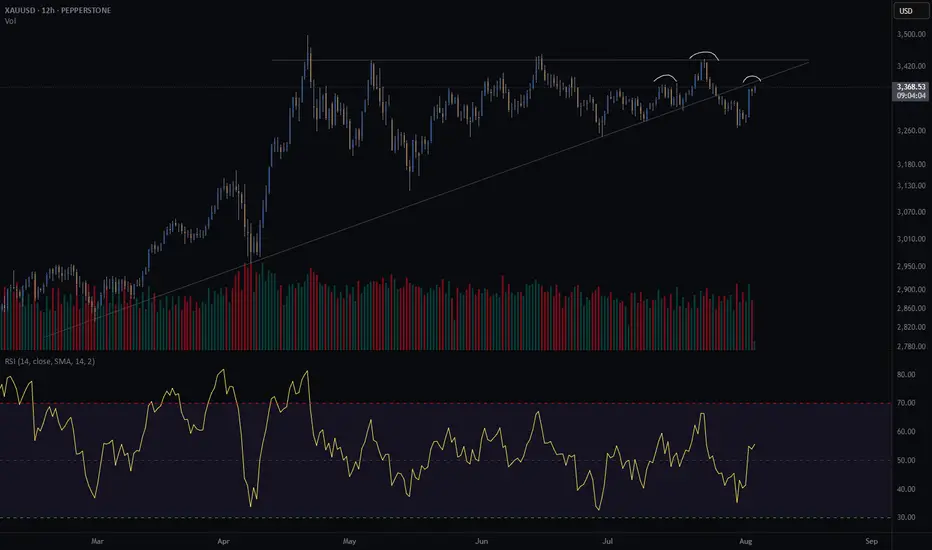
Gold crash (SHORT) - head and shouldersGold is at an interesting crossroad.
It broke through its diagonal support on Friday the 25th of July.
Price is retesting previous support. Does it turn into resistance?
Further confluence is a head and shoulders of the H8 and H12, with the right shoulder coinciding with the retest of the diagonal.
Since I am long gold with my investments, I am hesitant to short gold through my trading business. However, if my pattern is available, I take the trade. This will be a very short term trade - a few days at most if the trade goes in my favour.
Risk/reward = 12.6
Entry price = 3382.5
Stop loss price = 3396.2
Take profit level 1 (50%) = 3230
Take profit level 2 (50%) = 3181
The risk reward is exceptionally high. However, I have taken a more conservative approach with my entry because of my apprehension to short gold. For this trade I will enter at the extreme end of the range in which I will look for entries. This is the reason for such a high RR. It might result in me missing an entry.
Btccrash
BTC Distribution towards 65k / 50k - ExplanationIn this video, I break down why Bitcoin's market structure is shifting bearish.
I explain the distribution phase, the key signs to watch for, and why I believe price is likely to trade lower. To give you a clearer picture, I also show a real example for comparison.
🚀 Topics Covered:
BTC structure switching bearish 📉
Understanding the distribution phase
Why I expect price to drop 🔻
A real example for comparison
If you find this analysis helpful, like & subscribe for more insights!
Let me know your thoughts in the comments.

BTC DOWNTREND FOLLOWSThe cryptomarket is facing a sell-off pressure as Bitcoin, the world’s largest cryptocurrency, has fallen below the $85,000 mark to trade at $83,740 on Thursday during intra-day, which is over 20 per cent down from its January peak of $109,350. This is the largest sell-off in 2025. Experts said ETF outflows and US President Donald Trump’s EU tariff threats have pressured the market, and Bitcoin (BTC) might experience a potential drop to $74,000.
As of 10:38, the live price of Bitcoin stood at $84,916.18 per (BTC/USD) with a current market cap of $1,683.86B. The 24-hour trading volume is $67.37 billion. Bitcoin declined by 4.61 per cent in the last 24 hours with a circulating supply of 19.83 million, according to binance.com.
EXPECT TO 78,000 AND BELLOW

FAKE/EXIT Rally Is About To Come. After That......The fake rally is about to arrive. After that, whatever happens will make you forget about trading.
1210 billion will be wiped out from the market.
TRADING IS NOT SAFU..

BTC/USDT Pullback to Key SupportThe chart highlights Bitcoin's breakout from a symmetrical triangle formation, followed by a pullback to a critical support level. This price action indicates a period of consolidation before the next significant move.
Key Observations
1. The breakout from the symmetrical triangle has propelled the price upward, signaling bullish momentum.
2. The area around $97,100 is a crucial support level where buyers may step in.
3. A breakdown below $97,100 could lead to further downside, indicating a continuation of the pullback.
4. If the price holds above this support, a strong bounce and continuation of the uptrend are expected.
Strategic Implications
Monitor the $97,100 level closely. A strong defense of this support could provide an opportunity for long positions, targeting the next resistance levels.
Conversely, a confirmed break below $97,100 would warrant caution, as it may signal further downside.
Patience and careful observation are essential to capitalize on the next move effectively.

BTC to 41k - Crash Incoming.**Trade Setup for BTC/USDT (1D, Binance)**
- **Trade Type:** Short
- **Entry Zone:** $60,300 - $65,300 (Supply Zone)
- **Target:** $41,860 (Liquidity Area)
- **Stop Loss:** Above $65,300
**Rationale:**
- The price is approaching a key supply zone where a reversal due to selling pressure is expected.
- Price action is in a bearish structure, with the potential to make a lower low targeting the liquidity area below $42,000.
- There’s a liquidity pool at $41,860, which could be the final target after trapping long positions.
- Stop-loss is placed above the supply zone to limit risk in case the price breaks higher.

Bitcoin 2020 vs. 2024 - Lows and the Anticipated Bull MarketThis chart draws a parallel between Bitcoin's price action in 2020 (left) and the current trajectory in 2024 (right). On the left, we observe the pivotal lows formed around the $6,000 - $7,000 range in 2020, which set the stage for the subsequent bull market.
A similar pattern is emerging in 2024, with the price consolidating and finding support around the $50,000 - $60,000 range.
In 2020, Bitcoin broke out of a consolidation phase, igniting a powerful bull run that saw prices surge past $20,000. This breakout is mirrored in the 2024 chart, where a similar breakout seems imminent, suggesting a strong upward movement could follow.
The similarities between the two periods are striking, with both showing a strong accumulation phase (highlighted in grey) followed by a breakout above key resistance levels (marked by blue lines). If history repeats itself, we expect a significant bull market to start in 2025, potentially leading to new all-time highs.
Investors should keep a close eye on the $70,000 resistance. A breakout above this level could confirm the beginning of the next bull cycle, echoing the powerful rally we saw in 2020.

BTC might dump to 41k (Black Swan)Market Maker Sell Model Analysis | Potential Short Targets
Description:
In this video, I dive deep into the Market Maker Sell Model and discuss potential short targets. We'll explore how Market Makers build their positions during a downward move and how you can effectively capitalize on these movements to trade profitably.
Watch the video and let me know your thoughts or any questions you may have in the comments!

BTC SHORT BLACK SWAN 41k per BTCMarket Maker Sell Model with Potential Black Swan Event
This trade represents a classic Market Maker Sell Model (MMSM), where the smart money appears to have engineered a sell-off after accumulating positions at higher price levels.
- Initial Setup: The price action shows a significant liquidity grab at the top, leading to a sharp decline, indicating the possible distribution phase by market makers. The sell-off from the "SMR" level confirms the beginning of the MMSM.
- Entry Point: After the final push-up to the "SMR" level, where the market takes out liquidity, I entered short once the price confirmed rejection and began its downward trajectory.
- Targets:
- TP1: Set at the first significant support level.
- TP2: Set at a lower support level, which aligns with the overall downward trend.
- Market Context: The sharp decline hints at broader market instability. This pattern, combined with macroeconomic indicators, suggests the possibility of an incoming Black Swan event, which could exacerbate the sell-off and lead to a further drop in BTC price.
- Risk Management: Stop-loss was placed slightly above the "SMR" level to protect against potential false breakdowns. However, considering the potential Black Swan scenario, additional caution is warranted.
Conclusion: The price action strongly indicates that market makers have distributed their positions, and the sharp decline aligns with the Market Maker Sell Model. Given the possibility of an unforeseen market shock, this trade could be a precursor to a more significant market downturn.

BTC After Crash. Buy or not? 49k is KeyI am sharing you my thoughts after the recent dump and my outlook for the week combined with trade ideas.
Bottom might not be in, yet. I explain why.
49k is Key.

BTC Swing Short Liquidity Zones:
Sellside Liquidity: Two key levels are identified:
- Near-term sellside liquidity around the support zone (approximately $53,423.59).
- Mid-level sellside liquidity marked above the current price.
Gap Analysis:
- CME Gap: Indicated within the blue shaded area, suggesting a potential drop to fill the gap left by CME futures.
Current Setup:
- The chart shows a potential bearish scenario where the price might drop to fill the CME gap and tap into the identified sellside liquidity areas.

BITCOIN Short Term relief possbile - Still BEARISHIn this Video I am talking about the High Time Frame and Lower Timeframe view.
I explain what potential trades we are currently looking for.

The bleeding continues to get worse in Bitcoin!Bitcoin has been bleeding out like a deer on the opening day of the hunt, and there's no sign of it stopping, in fact, it's going to continue to get worse in the coming weeks.
Just like that old Motley Crue song from Dr. Feelgood (and this won't feel good for sh@tcoin, I mean Bitcoin holders at all), 'She goes down, she goes down, she goes down, down, down, down... all night long!
Bitcoin is heading to 35K.

BTCUSDT By HesamUNTAs you know, I haven't been taking the time to share ideas lately
But now the market is at a critical point and I think it is time to provide an update
As you can see, I have entered a sell position
See and read additional information in the chart
wish u all the best :x

BTC LONGDeviation is done to the downside , we have LOADS of liquidity not in the downside no more but to the upside . This will be a trade for the books , to remember Forget the news , Fugasi etc and look at your only friend , the charts .
My last bet was to 22k but closed at 21 and shorted to 17,100
This time I think it'll go way longer to 29k or a tap of 30k

Bitcoin Dump Signs On Chart Is Insane! Is Today The Crash Day??BTC/4H doing Another Rising Broadening wedge
We made 3 top and each were lower than previous one. the last pump that happen was a liquidity grab.Also On Daily Bitcoin looks very dumpy,H&S could be in play too (mentioned in video)
Keep In mind after the touch we did at 28954 it dumped heavily and then regained it back with a lower high. and the consolidation is inside that red candle and It Formed a BIG Pennant. showing a possibility of a strong dumpage.
There is some Bullish Sign That Ive talked about in video too that could play out and we could visit 31K ( I doubt it though) but worth mentioning it
Thanks for all your support

MUST WATCH!! NEXT #BITCOIN STOP
what I need you to know!
1, we are going to 11k/10k range
2, bitcoin can't go lower than this two-price tag
3, this price tags could possibly be the golden bottom ever .
no long story if you have been following my previous BTC IDEAS if you haven't watched my previous bitcoin ideas go and do so now to understand my price tags and movements.
so, my next stop where I'll be expecting bitcoin is at price ($11,620.45 ---- 10,086.26) at this range do not expect bitcoin to go lower meanwhile this could possibly be the golden button ever!!!! BINANCE:BTCUSDT

BTSUSDT - is btc going to crash again??We can expect dump again on BTC as you can see a Decending Triangle formation on 1D interval. The support zone of this pattern is around at 18200 to 18500.
in my POV if btc don't managed to hold this support and unfortunately broked than we can easily expect 12500 levels. Don't jump blindly on this trade wait for breaking of support and after plan your trades accordingly.
Note: if BTC managed to hold this support zone of 18200 to 18500 for atleast 14 days than ignore this setup.

BTC for the Downtrend BTC looking for a blood bath ?
9.15 am ( 5.30 + UTC ) BINANCE:BTCUSDT looks like for huge downtrend momentum with large volume portfolio. It s seems to gone around 18,500 - 19,000 range. Here is the one more confirmation thing to say ; 0.236 Fib Level available in around 18,500 - 18,900
*Let's see what will happen*

DONT PANIC WITH THIS BTC CRASHBTC has crashed pretty much in last few days but for me its just clearance of the long postions. BTC will retreace into 23k zone soon. Sentiment turned bearish last time and people are shorting right now soo it is good setup for liquidation of the short positions. also as we look into 1min chart we can see huge sells in 1min candles wchich are confirmation that market is now unhealthy and under controll of big players.


btc may fall from 23k level btc may fall from 23k level
Im bullish upto 23k level and thn drop from there and if price dips today or tomorow you can see the supports in the charts wost case 20k
Not a financial advice

bitcoin short or long 📉📈i think BTC down to 19850 $ , there are two ways after going down to 19850 $ .
First way 📉 ( plan A 70 % ) break the support and go to the red areas.
Second way 📈 ( plan B 30 % ) Rebound from the support to the green areas.
Plan A ( 70 % ) 📉 :
T1 : BTC ==> 19850$
T2 : BTC ==> 18850$
T3 : BTC ==> 17850$
Plan B ( 30 % ) 📈 :
T1 : BTC ==> 22850$
T2 : BTC ==> 24850$
