Expect to see #Bitcoin Dominance %58#btcd has been pumping for al long time. Expecting impulsive move will reach #btcdom to %58 the ATH of the channel , then dump. Not financial advice.
Btcd

(TOTAL2) Alt coin market cap!!!!!Alt coins are bloody, the market moves based on Demand and Supply
If we go back to our chart, we can see here that there is not much demand in that area, between 600B to 680B.
In our previous data, in that area there was a good upward impulse movement, but now the sellers are more aware.
We can go back to the 400B range of the Alts marketcap, and we can still feel the price drop in some of our altcoins across the market.
be careful when positioning trades on different alt coins. Don't over trade too much. Relax and enjoy different things first to avoid big losses in the market.
PS: 400B support + Moving average 200 ; massive buying zone.
Happy trading!!

BTC Dominance, what could be next?Touched that 48% level that was predicted, in order to retest previous resistance.
Personally hoping for a double top and BTC D consolidating between 54 48 levels until bullrun arrives. But I also see 54% and even 57% as a possible final level (black swan).
Alt bags are ready for bullrun. Could definitely wait more for lower levels but many alts are at an insane discount already, its too risky not to be buying.

Still #Bitcoin season #BTC.D to push onto 50% plus#BTC taking the lead
as in past #crypto recoveries
Measured move to tag previous resistance.
#ALTS will lag but still give smaller gains.

🔥 Bitcoin Dominance Rising: Watch Your Alts! 🚨Last month I made an analysis on the BTC dominance (BTC.D) where I discussed an incredibly bullish pattern. The falling wedge played out as expected and the previous resistance is now retested as support.
In my view, the BTC.D will continue to rise for the next months. I'm looking at a value somewhere between 55%-60%, potentially higher if we get a big crash.
While BTC.D goes up, most alts will lose value against BTC. Yes, some alts will perform better, but those are outliers.
In the long-term, this will make alts relatively cheap, and a better long-term investment. However, we're not there yet
Do you think that BTC.D will rise in the near future? Which alts do you think will outperform? Share your thoughts in the comments 🙏

Bitcoin' s DOMINANCE is looking Bullish BTC is now retesting the bullish breakout and if succeed, btc dominance will continue moving upwards. If same time , btc pumps, this is a good sign for bulls. If same time, btc price plunges, this will be doom for bulls. And both cases, altcoins' prices will suffer if BTC dominance goes up. Due to increasing volatility, be careful hold on guard and use stops.
NOT FINANCIAL ADVICE.

BTC.D to 60%Looks like btc is ready to make a big move.
RSI is at a common turning point in the lot to mid 30s.
BTC.D falling onto major rising support.
If this trend holds, BTC could make a big move and take a larger share of the crypto market.
NFA
Do your own DD.
Keep an eye on this crucial level.

BTC.DIn the future, with the growth of Bitcoin dominance, we will witness further declines in altcoins; we are still in a BEAR MARKET.

BTCDOMINANCE FREE FALL INCOMIN ??BTC dominance is currently in the extreme overbought zone in lower tf as shown by the indicators.
In my opinion and according to my analysis, a short term recovery is coming soon as it is being rejected by the golden pocket..
and double top is on 15 min chart..
NFA

BTC Dominance Crumbling, hit 52% targetHere we are now, 52% was resistance as predicted.
Now dropping below 51%...
Its not too late to load some alts anon, dont be left underexposed. The risk reward is great at the moment.
I been saying this all year.
BTC D high BUY ALTS

Bitcoin Dominance (#BTC.D) Hits HH: What It Means for Altcoins🌴 Paradisers, let's discuss the recent developments in the Bitcoin dominance (#BTCD) and its potential impact on the cryptocurrency market. 🌴
💎 The Bitcoin dominance recently reached a new higher high, hitting the 49.66% mark. This is an important milestone, as it signifies the breakthrough of a long-term resistance level. This breakthrough opens up the possibility for #BTCD to climb even higher, showcasing its strength in the market. 💎
💎 However, it's worth noting that the price of #BTCD has encountered resistance at the 261.8% Fibonacci level, suggesting a potential pullback in the near future. This correction could lead #BTCD to retrace back to the 48% area, allowing room for the Altcoins to flourish.
💎 If #BTCD manages to stay within the ascending channel, it is highly likely that we may witness an Altcoin Bloodbath after the pullback. This indicates a period where Altcoins could experience significant drop in a relatively short timespan. On the other hand, if #BTCD breaks below the 48% support and subsequently 47%, it could signify a greater potential for the Altcoin season to emerge.
💎 In summary, the overall trend remains strongly bullish for #BTCD, but a healthy pullback would not be surprising. If the pullback occurs, #BTCD could resume its rally and potentially target the resistance level at 52%, which aligns with a double Fibonacci level.

Bitcoin Dominance & Total2Bitcoin Dominance Index (BTC.D) - calculated index that shows the ratio of bitcoin capitalization to the rest of the cryptocurrency market. CRYPTOCAP:BTC.D
It directly demonstrates inflow and outflow liquidity into the first cryptocurrency, due to which the investor gets the opportunity to predict a potential “altcoin season”
TOTAL2 - crypto market capitalization excluding bitcoin capitalization. An indicator showing the inflow of liquidity into altcoins.
Correlation
As a settlement index, bitcoin dominance is correlated indicator, and has a number of properties that can enable the investor to predict potential market changes:
Here is example of potential movements between this 3 charts
Hope you enjoyed the content I created, You can support with your likes and comments this idea so more people can watch!
✅Disclaimer: Please be aware of the risks involved in trading. This idea was made for educational purposes only not for financial Investment Purposes.
---
• Look at my ideas about interesting altcoins in the related section down below ↓
• For more ideas please hit "Like" and "Follow"!

📈 Bitcoin Dominance Most Bullish Since Jan. 2018Bitcoin Dominance is about to go through the roof. The weekly RSI is at its highest level since September 2019.
The setup we are seeing now is something we haven't seen since early 2018.
We are also about to experience the "mirror image" of the phase that took place in Q1-Q2 2022. Mirror image as in reverse.
We should see massive growth across the Cryptocurrency market.
New people coming in, new money, new developments, new excitement... Growth and progress will flow from Bitcoin to the Altcoins and then back and forth.
The worst is already in the past, 2022... We are set to experience years of growth.
Namaste.

52% - 57% next targets for BTC. DBTC dominance broke 50% and there is minimal resistance until 52%.
If 52% breaks we could scam wick to 54% and down or continue to 57% and rekt the altcoinmarket.
most likely scenario seems to be 54% currently, but with big financial players entering BTC etf we might see higher.

When I see this, I can't think of an alt-season.Look at the size of the reversal pattern that has formed.
It looks like a year and a half long sloping channel.
I put a 3D Renko to remove all noise, and left only VFI LF.
That's the way it is.
Regular bullish divergence and very persistent.
I believe there can be no real (as we like 3-6 months, not these "2-3 day alt-seasons") alts pumps in 2023,
because imagine how long it would take to work your way out of that pattern? It's shaping up to be an assault
for 51% and then on to somewhere around 60%...
Well you know, every now and then bitcoin stomps all the coins so that it leaves them wet.
It's been too long since that happened. There was just a boring drop, but no real massacre.
Now it's coming.
P.S. I know there's plenty of bullish sentiment.
Guys, don't forget that a fall requires just as long a consolidation at the bottom before a rise.
So far we have a fall and no consolidation (weekly chart i mean).

BTC dominance ready for testing 44.40 %hello dear traders
this is advanced price action of bitcoin dominance
Where Will Quasimodo Generally Appear?
Quasimodo pattern appears at all time frames. It occurs always after a significant rally. Then the market is manipulated to create liquidity. Where the retail traders are captured, the profitable trading opportunity is created there. Quasimodo is very reliable if used properly and can be seen on every timeframe from daily down to 1 min charts.
What Should Be Remember To Trade QM Efficiently?
Always look for fresh Quasimodo Demand/Supply zones, which are not tested yet.
Make sure the distance between QML and MPL is not too high. If the distance is so high, risk will be increased and the Risk Reward Ratio will be poor. So, when the zone is small, the risk is also small and the expected reward is big.
Never ignore level over level.
QM is more powerful when an authentic opposite zone is engulfed.
You can enhance your day trading strategies using this price action pattern.
good luck


Similarities to Wyckoff AccumulationBitcoin dominance shows similarities to Wyckoff accumulation here, getting ready to enter into Phase E after SOS in Phase D.
This chart inspired by a comment from @averkie_skila on my previous Bitcoin Dominance chart here:

This Time is Not Like the OthersPrevious tops for Bitcoin Dominance in this range have behaved similarly, as has RSI. Each time we topped out, RSI moved higher and higher and then dropped hard. This time RSI has formed a falling wedge, and it looks indecisive.
It could be seen as a bearish divergence, as RSI moves down while price moves up or sideways. However, as RSI has already fallen significantly lower, it has room to spike upward along with price.
I think the likely scenario here, is a move up to 50-54% and then a strong move down. It could make a move down before doing so, but not back to the lower range.

BTC DominanceBITCOIN DOMINANCE,BTC.D upcoming move is small correction follow by pump which will definitely bad for alts

Trade Alert - Long EthereumTraders,
A wick down tagged our neckline precisely as expected. Now, we’ll probably incur a few more days of price action down in this area, but I’ll buy now to be safe. It’s only 50 dollar down to that neckline. Target will be 3,000. SL will be 1500 for now (to be adjusted as that 200 day ma moves up).
More trades to come.
Stew

Altcoin Strength Indicates Dominance Will Drop!Traders,
As outlined in this mornings video, altcoins remain relatively strong as compared to Bitcoin. This is a bullish indicator that alts may be gearing up for a bit of a run in the next few weeks/months.
Another chart to keep a close eye on, of course, is our BTC.D (Bitcoin Dominance) chart which is currently showing a bearish Head and Shoulders pattern.
Have this chart on your list for future observation. It is fair to become more aggressive alts once that neckline breaks.
Best,
Stew

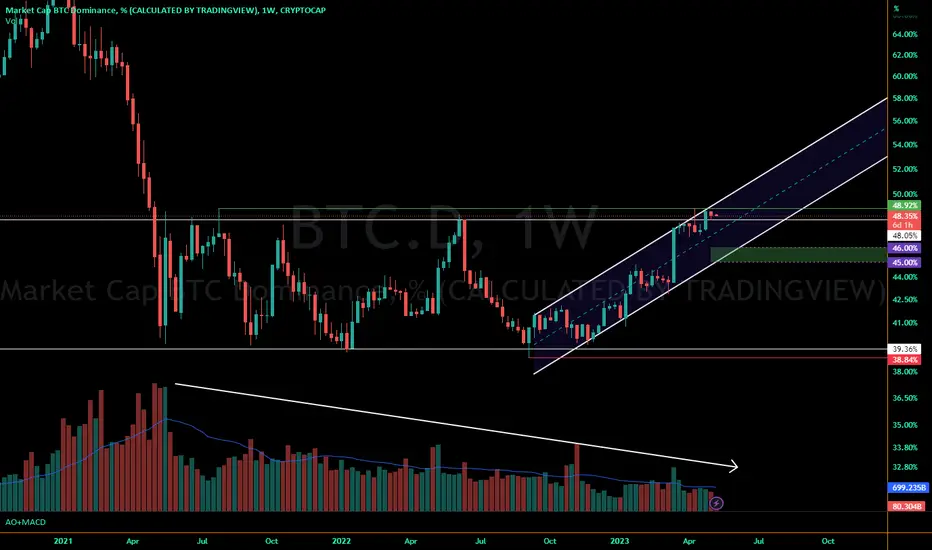
No Breakout Yet, No Massive Drop EitherBitcoin Dominance looks like it wants to head down to 45-46%. Why?
- We're moving up within a parallel channel on the weekly chart here, good chance we'll see the bottom of it again.
- Our highest weekly high did close above the previous one, but with no wick and not as high as our highest wick. Hard to call that a strong breakout
- Volume isn't here yet to bring it higher & MACD looks like it wants to turn down, while AO may cross soon as well
Conclusion:
- No altseason yet (a mini-recovery could occur though, but they could just as well drain more if BTC drops significantly with another dominance drop)
- No dominating bitcoin move yet