$BTC.D Triangle still valid and playing out. So here we have 2 paths I think this might follow...
Green path illustrates the main count with E already finished and assuming we will go up soon to make wave (2) and retrace quite a bit to create a bit of havoc on the market. This has the potential to play out within the next few weeks at the most, followed by an ALT season.
The red path on the other hand assumes that E is actually A (leading diagonal) of E, and that the current retrace is B of E and that we will go higher and above the triangle diagonal. This would cause the market to to go below expectations and would cause some real FOMO selling.
I'm about 60/40 in favor of E being finished.
Safe Trades, avoid shitcoins, and remember, wave 4 never retraces into wave 1. *wink wink.
Btcd

Bitcoin dominance : More blood for Alts?Bitcoin dominance Update / D1
BTC.D index is at its red downtrend Year long resistance zone. A breakout above the red resistance line will bring more Blood to the Altcoin market🩸

#BTC DOMINANCE WEEKLY UPDATE BY CRYPTOSANDERS!!Hello, welcome to this BTC.D chart update by CRYPTOSANDERS.
I have tried my best to bring the best possible outcome to this chart.
Show some support do hit the like button, follow and comment in the comment section. this motivates me to bring this kind of chart analysis on regular basis.
CHART ANALYSIS :
BTC .D still respecting the bear flag. If confirmed over the next few weeks we could see bitcoin dominance reach the very low 30 maybe even into the high 20%. Altcoins will explode if BTC .D loses 39%.
Do hit the like button if you like it and share your charts in the comments section.
THANK YOU...

Bitcoin Dominance To Go Lower Based On TA!BTC.D likely to continue lower...
We have a break below EMA50 today (yet to be confirmed).
The MACD has gone below zero (bearish).
The MACD has gone below 50 (bearish).
When Bitcoin Dominance drops, the Altcoins grow.
This is also a confirmation that this Bitcoin bullish wave is only a bounce before the resumption of the bearish trend that started in November 2021.
March 16 2022
Before $300,000 - $500,000 Bitcoin Hits $20,000 to $11,300...
March 26 2022
Bitcoin Monthly | RSI and MACD (Enjoy The Altcoins While We Can)
Thanks for the info, we will make a good use of it.
Namaste.


#BTC.DOMINANCE 8HOUR UPDATE BY SANDERS!Hello, welcome to this BTC.D 8hr chart update by CRYPTOSANDERS.
I have tried my best to bring the best possible outcome to this chart.
Show some support do hit the like button, follow and comment in the comment section. this motivates me to bring this kind of chart analysis on regular basis.
CHART ANALYSIS:-
In the above-mentioned chart, it is evident that BTC.D was moving inside the channel pattern on a support line and broke the channel and bounced.
In the current scenario, BTC.D got a rejection from the upper trend line resistance.
Now it can move down up to 41.40% which is the lower support zone
This is not a piece of financial advice.
Sorry for my English it is not my native language.
Do hit the like button if you like it and share your charts in the comments section.
thank you.

$BTCDOM/USDT 2D (#BinanceFutures) Ascending trendline retestBitcoin Dominance Index has been rejected with a Hanging man pattern and could resume the downtrend.
Current Price= 1275.5
Sell Entry= 1275.0 - 1305.0
Take Profit= 1196.9 | 1129.7 | 1063.1
Stop Loss= 1364.5
Risk/Reward= 1:1.25 | 1:2.15 | 1:3.05
Expected Profit= +21.66% | +37.29% | +52.77%
Possible Loss= -17.34%
Fib. Retracement= 0.382 | 0.559 | 0.786
Margin Leverage= 3x
Estimated Gain-time= 3-4 months
Tags: #BTCDOM #BTCDOMUSDT #BTCD #BitcoinDominance #Index #Futures #Derivatives #Dominance
www.binance.com


BTC.D continue rally#BTC.D
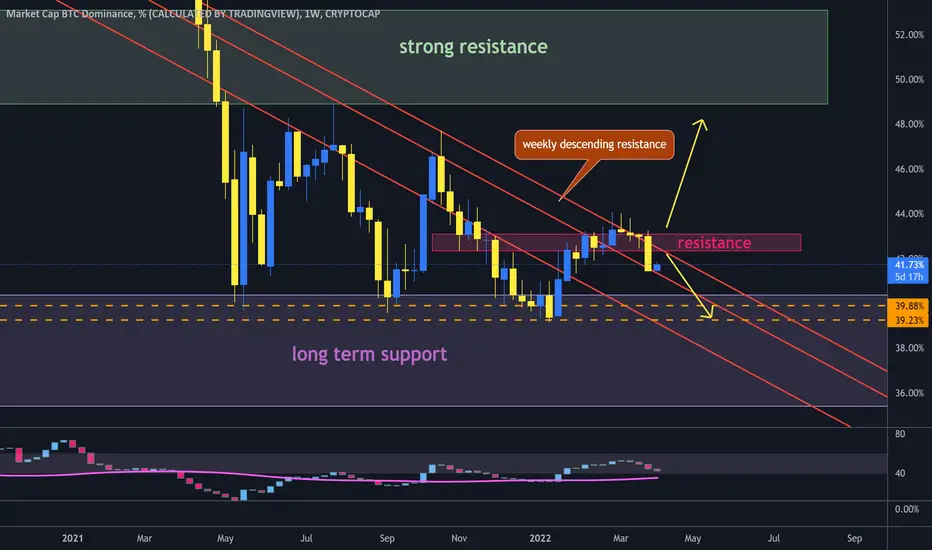
Bitcoin Dominance broke out from weekly descending resistance in daily time frame and reached resistance line.
it is high possible that continue its rally to 45% and even more to long term resistance above 50%.
so this scenario is the end of altseason.
but if current resistance reject the dominance and weekly candle close below support of 41.45% we may see another rally in altcoins.

#BTC Dominance Understand this level if you are holding ALTS!Reasons to Follow me?
*9 Years in Trading!
*7 years in Crypto
*Certified Technical Analyst
*Record Holder of Most liked Bitcoin Chart on Tradingview.
*Consistent updates on Markets and Trade Setups
*No Bias
*All-time Top Author on various assets and index charts globally.
*Very Active Community during both bull and Bear Market
ALT/BTC Pairs are likely to have some pullbacks.
Breakout and retest in LTF. But if you zoom out, the index is hitting the 200D MA.
Break above this level could result in more downside in Altcoins.
Less likely but possible.
For those who are trading with margin in BTC Pairs.
Be careful, even a -15% move could kill your position.
It's important to preserve what you have.
So 42.40% is the key level you must watch out for now.
We are witnessing an extended period in these ALT cycles.
A lot of new developments in the charts.
Conclusion:- Break above the 200MA will be bad for BTC Pairs, 2-3 Rejection candles and the index could go down from here.
Let me know your thoughts in the comment section.
Your likes are highly appreciated.
Thank you

#BTC.DOMINANCE 6HOUR UPDATE BY CRYPTOSANDERS Hello, welcome to this BTC.D chart update by CRYPTOSANDERS.
I have tried my best to bring the best possible outcome to this chart.
Show some support do hit the like button, follow and comment in the comment section. this motivates me to bring this kind of chart analysis on regular basis.
CHART ANALYSIS :
As we can see in the above-mentioned chart that BTC.D is trading inside the triangle pattern on a support level after a rejection from the red resistance zone, whenever BTC.D rejects from the red resistance zone it moves down towards the lower support zone which is 39.40%.
Here I am expecting that BTC.D will brake the green support and move down to the White ray support area which is 39.40%.
Sorry for my English it is not my native language.
Do hit the like button if you like it and share your charts in the comments section.
THANK YOU...

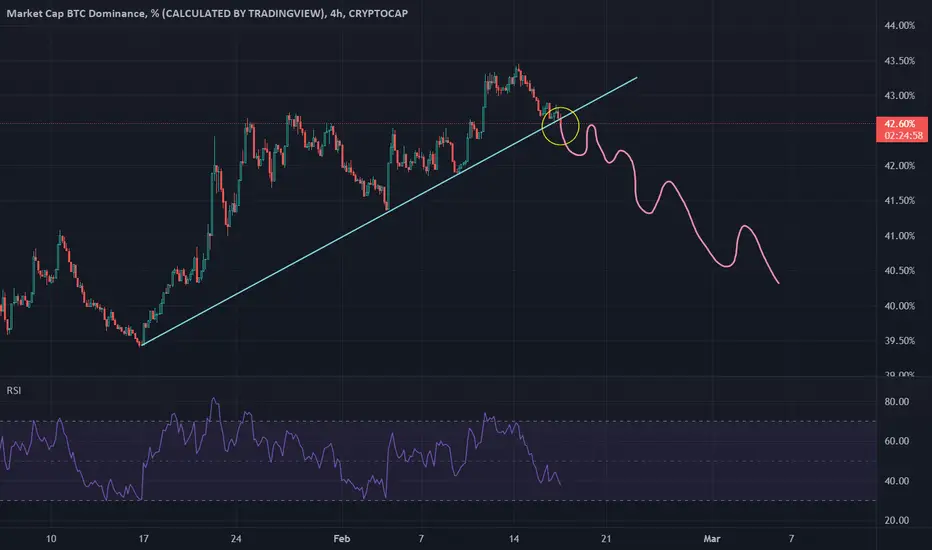
BTCD at support of 41.45#BTCD
Bitcoin Dominance struggle to break down from support of 41.45%.
🐻 breaking this support can drop BTC.D to 40% and lower that can cause more rally for ALTS and BTC.
🐮 holding this support will increase it to resistance of 42.8% , which is the end of rally of so many altcoins.

BTC.D - I'm calling it my treasure mapI heard the voice of Mr Klaws and that said it's time for a reasonablely noticabel market move. If you're not familiar with BTC.D, feel free to PM me or ask here and we'll explain. I call this the "treasure map". My strategy is BTC in the green channel, my fav alt probably coming into a buy zone or opportunity. Red zone should be printing profits. Green dash lines are market support for BTC. Red lines and box are where we would find massive supply (people selling cheap) of alts.
It is important in this time to keep focus on a longer trend and make some hay.
Or it mega bounces and my portfolio hurts....
invest wisely and with confidence or not at all.
AKKK AKKK AKKK AKKKK AKKKK AKKKKK

Bitcoin Dominance Potential Strong Drop AheadBTC.D trading below EMA10 holding one final support... If it breaks, we will witness a strong drop.
The RSI is very weak as you can see...
We have the SPX correlation and you can see my previous bearish BTC trade ideas which supports this chart.
We have bullish and bearish waves.
Bullish wave March.
Bearish wave April.
We can expect another bullish wave May.
Strong bearish wave June...
Namaste.

Bitcoin Dominance BTC.D - Alt season! Huge descending triangle!- I hope you are ready for the upcoming alt season in 2022!
- We have a descending triangle on the weekly time frame, which is definitely very bullish for altcoins.
- Bitcoin Dominance is going down and there is still no signs of trend reversal.
- ABCDE triangle should be completed and now we are waiting for the huge breakout!
- Previous swing low resistance (2018) is our next target, then here we can experience a bounce.

#BTC.DOMINANCE 4HOUR UPDATE BY CRYPTOSANDERS Hello members, welcome to the BTCDOMINANC Quick update by CRYPTOSANDERS.
I have tried my best to bring the best possible outcome in this chart.
In the current scenario, BTC.D broke the Chanel downside and retested the lower trend line.
We are expecting here that we will see some downfall which means that BTC will form some green candle because as we know that BTC and BTC.D both work inversely proportional.
Sorry for my English it is not my native language.
Do hit the like button if you like it and share your charts in the comments section.
THANK YOU...


BTC.D Dominancehere is support for Dominance so some pump for Dominance and some Dump for Alts Expected . Altseason is not over but some correction coming . be safe on your Alts

BTC.D Critical Territory AgainThe Bitcoin Dominance looks like it wants to make a local low here , compared to the previous one it would be a Higher low and potential massive reversal to the upside can happen from this point.
1st Scenario (higher probability) BTC.D will break above 43,40% and thus confirm the higher low , which will lead to Altcoins bleeding versus their bitcoin pairing as up to 55% on a macro scale.
2nd Scenario (lower probability) BTC.D will break the 41,30% and thus Invalidate the local low , which will lead to Altcoins gains versus their bitcoin pairing (Mini-Alt season) , further down we have the BIG support around 40% , if the bitcoin dominance were able to break the 40% support a really Massive Altcoin season will occur.
P.S. Would like to hear your toughs and opinions in the comment section, Thanks.


BTCD rejected from weekly resistance but still in critical zone#BTCD
Bitcoin Dominance rejected from weekly descending resistance, but still in this zone.
🐻 so if it hold the resistance zone, it can drop more to 40%, the alt season will continue and we can make more profit from BTC and ALTs.
🐮 but if dominance head up to break out resistance it will be the end of alt season.
❇️ so take your profits and wait for the rest. (more profit or closing positions)
BTC.D DOMINANCE OF BTCHold your Alts , Big Dump for Dominance of BTC or BTC.D coming , its mean Big pump for Alts coming . its not matter that BTC dumped . Just Hold . will see
BTC.D going down - alt season of 2022 should start next week?I still think that we are so close to real altseason, the huge one - 500%+ with random alts in April... as u can see we have beautiful red weekly candle...getting closer to the area of last alt season in the end of 2017. I would reccommend to add this chart on your watchlist!
