An Introduction Video By mr_willmedinaGood evening friends,
This is my very first video analysis.
I hope you enjoy and thank you for watching.
Trade thirsty!
Btcd

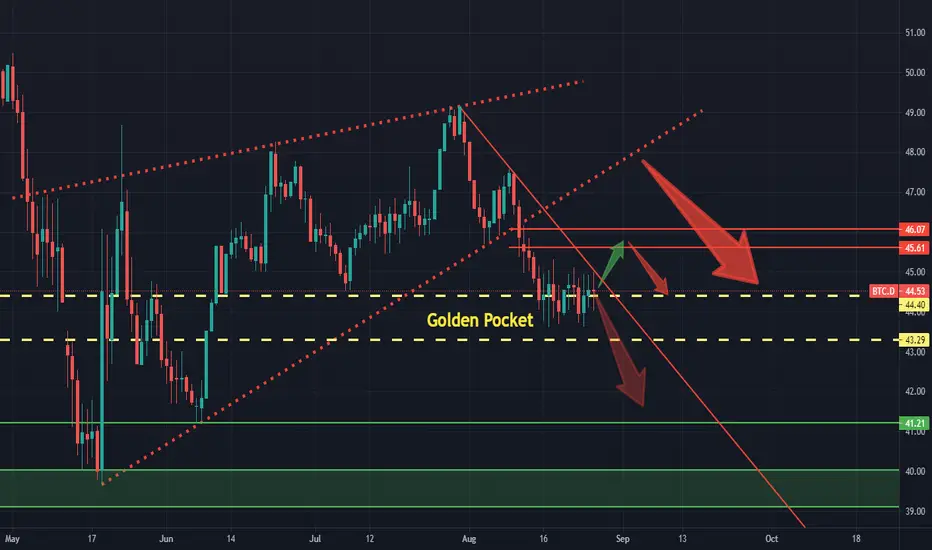
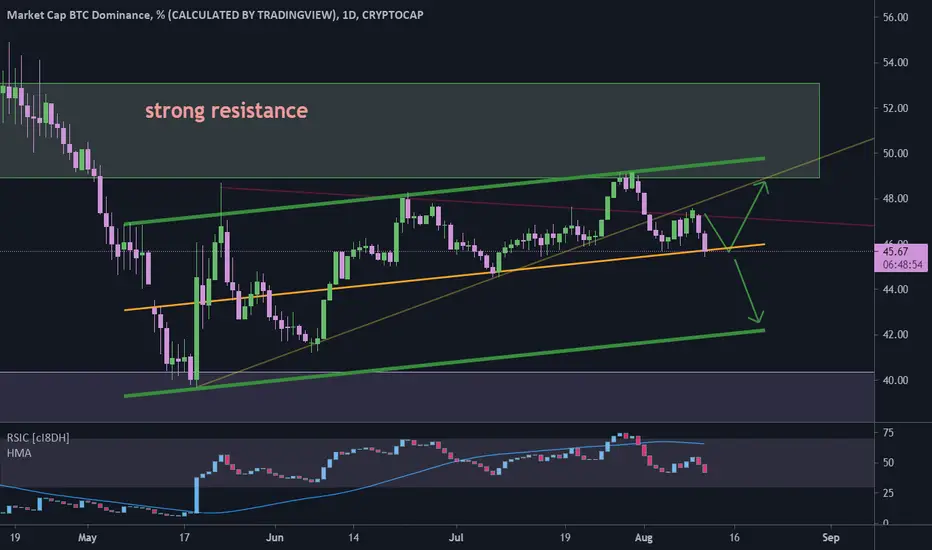
BTC.D currently at critical levelBitcoin Dominance has been consolidating around 0.5 fib. We are just about to test the trendline resistance. If the trendline is broken, we can see a 50% - 61.8% correction of the recent downward movement followed by downward trend continuation. Though there is also a possibility of retesting the previous support of galling wedge.
Depending upon how this plays out, I will be looking forward to pick some altcoins accordingly.
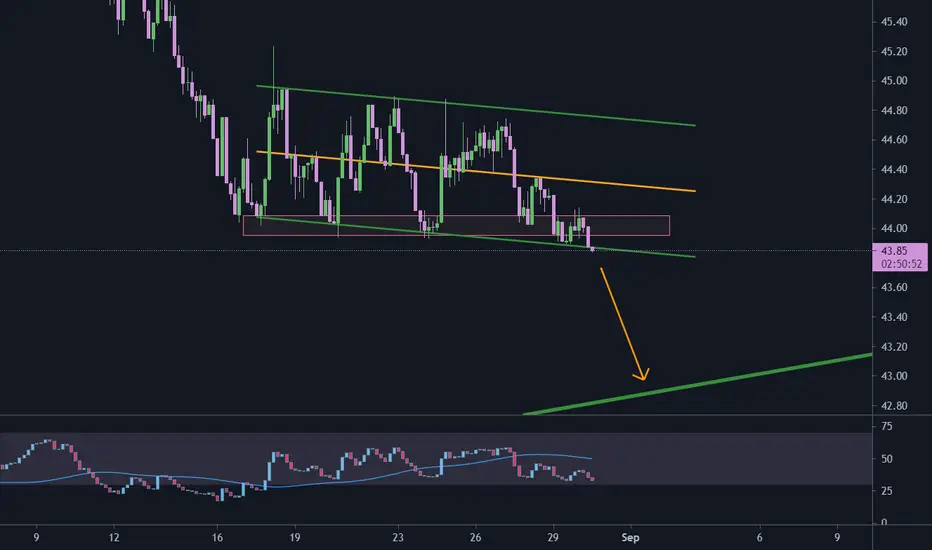
BTCD broke down from parallel channel#BTCDominance
bitcoin dominance almost broke the lower line of descending short term parallel channel, and I think it will drop to 43, which is a lower line of long term ascending parallel channel.
this drop will cause a pump in BTC and ALTs.
BTCD flag for continuation of down trend#BTCD
bitcoin dominance is near upper line of parallel channel, that I consider it as a flag for more down trend.
correction is healthy for trends.
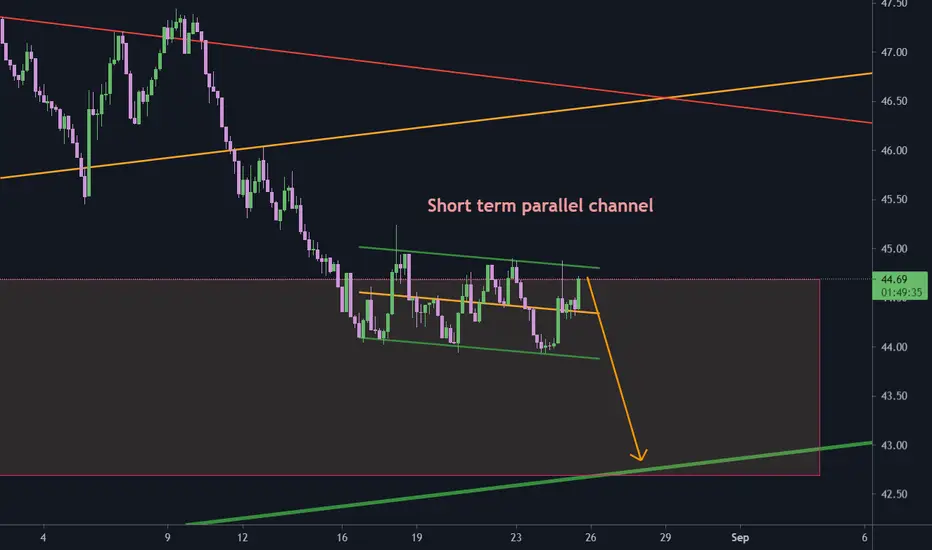
BTCD parallel channel#BTCDominance
BTC dominance is below the middle line of parallel channel and heading to lower line.
but here is a local support that struggle to go down.
If BTCD break down 42.5 which is the lower line of parallel channel, we will see more pump of ALTs.

BTCD UPAfter quite some time dipping, now dominance has reached to a major support and seems like at least the short term trend has changed, the chart is as clear as it gets, all details in!

$BTCD / AltSznStoch RSI crossovers have been very telling in the past for BTCD.
A bearish cross usually means alt-snz. The few times that it didn't, stoch rsi crossed back up.
Therefore, I believe that as long as STOCH RSI does NOT have a bullish cross over, alt szn will continue.

BTC.D How does Bitcoin work? Each Bitcoin is basically a computer file which is stored in a 'digital wallet' app on a smartphone or computer. People can send Bitcoins (or part of one) to your digital wallet, and you can send Bitcoins to other people. ... You can sell things and let people pay you with Bitcoins.

BTC.D DominanceDominance dump coming so Alts will be pump , its just becoz for pumping btc . Enjoy Altseason ..............................................................................................................................................................................................................................................................................................................................................................................................................................................................................................................................................................................................................................................................................................................................................................................................................................................................................................................................................................................................................................................................................

BTC.D Down to 23% by end of October End of October will be the End of this Bull Cycle
Not Financial Advice

BTC Dominance above the 7D SMA vs AltsToday BTC Dominance closed above its 7D SMA... this could be an indicator for two things:
1) BTC on a way for a parabolic pump
2) and Alts may bleed in their BTC pairs.
That is why it is always a good to thing to hold BTC along with ALTS to hedge in case of such moves.

Bitcoin Dominance (BTC.D) Heading Towards 2017 LowsQuick update on my previous Bitcoin Dominance chart from earlier this year, looking at the weekly time frame.
The start of 2021 we saw BTC.D topped out at 70.21% and consistently fell until the market crashed in April - May. The Dominance % bounced off 44% and slowly started creeping back up. A major key in analyzing this trend was seeing that the dominance didn't even reject or touch the 50% dominance level, signaling that the move upwards was a relief rally and the downtrend will resume.
Taking a look at the 2017 move we saw it come all the way down to 35% in one straight shot, then a quick downturn to the 40% level. This time around, i'm believing that we're going to see the opposite where the Dominance first hit 40% and then the 2nd time around it comes down to hit the 35% level where it is finished from there.
Most of the major cap coins have not touched their ATH in respect to the BTC ratio and they need to before the altcoin season is finished. The small capped coins have basically all created new all time highs and surpassed their respective BTC ratio.
This 2nd altcoin season cycle should occur close to the end of this year, Q4 2021 going into Q1 2022 paired along with a spike in the price of Bitcoin and the rest of the crypto market.
History doesn't repeat itself, but it often rhymes.

BTC.D Dominance Dominance dumping soon so pump for alts coming ....................................................................................................................................................................................................................................................................................................................................................................................................................................................................................................................................................................................................................................................................................................................................................................................................................................................................................................................................................................................................................................................................................................................................................................................................................................................................................................................................................................................................................................................................................................................................................................................................................................................................................................................................................................................................................................................................................................

Bitcoin Dominance - Daily Chart Update: Rising Wedge Breakdown Everything on the chart, see previous related longer-term ideas linked below

BTCD fractal 2017#BTCDominance
BTC dominance is on the way I predicted 👌🏻
and still I think it will follow the fractal from 2017.
so wait for more drop
and wait for more profits from BTC and ALTs 🚀🧘🏻♀️

BTC.D . who takes the crown? I look at this and I cannot imagine that BTC can stay on top of crypto when the main goal of BTC is reached - introduce mases with concept of digital money. Question stands whos gonna rule after next cycle? As that famous conversation in a tv show. "Jack,this was always the future, hard cash is fading (..)"

HBAR / BTC - BTC.D in Rising Wedge, Alts in Falling WedgeAt the moment, it looks like Bitcoin wants to rise against alts, and it may do so in the short term, but mid to long-term a rising wedge coming out of a downtrend is a bearish continuation pattern for bitcoin dominance, while a falling wedge coming out of a downtrend is a reversal pattern.
Hence, I think there's a good chance alts like HBAR and others are going to see some pretty nice gains against bitcoin. Preface this with the fact that patterns like this aren't always successful, especially in crypto, but they are "reliable" most of the time. Keep an eye on both and let's see if it does what it is supposed to do.
Related ideas linked below

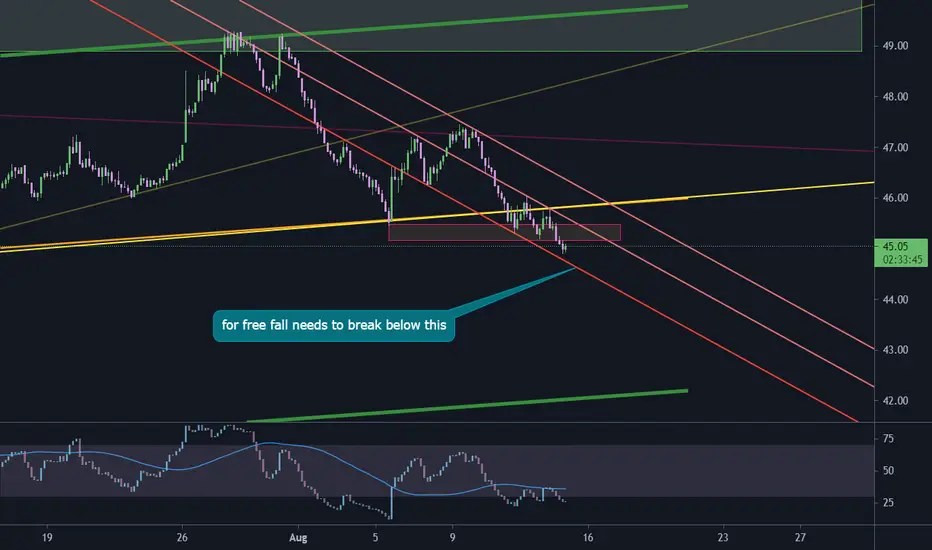
btcd still one more break needs to drop#BTCDominance
BTC dominance broke down from middle line of parallel channel, also broke the local support area.
but for more drop needs to break down the red line.
BTC.D DominanceAltseason is not over . moneyyyyyyyyyyyyyyy .........................................................................................................................................................................................................................................................................................................................................................................................................................................................................................................................................................................................................................................................................................................................................................................................................................................................................................................................................................................................................................................................................................................................................................................................................................................................................................................................................................................................................................................................................................................................................................................................................................................................................................................................................................................................................................................................................................v....

When would Altseason take place based on btc.d historic dataThere are many parallels displayed in a few alts like Bittorrent and ASD which got ahead of themselves. Some coins are way ahead compared to many others which have barely moved or met an all time high, it makes no sense to state bullrun is over or even that altseason has already happened. If we review the correlation many alts had to that of Bitcoin from the lowest price hit between 2013 and 2017, it's quite plausible to suggest this is an extended bullrun that will last until interest rates go up sometime in the summer of 2022, until then the party continues as follows. Some alts like Band have copied a very similar price action to that of Ethereum in the early days, others like Algo have been more similar to the early days of xrp from December 2014 peak till now. Will Btc dominance repeat an October 2020 fractal? December 2019 fractal? or perhaps an October 2016 fractal, only time will tell.

Was that it for BTC ... Good evening everyone!
Happy to be back this Thursday evening to give you an update, we dig a little deeper and we have a look at what the BTC.D chart can tell us about the alt market!
BTC is doing nothing on the 4H timeframe, but what subtle things can we tell from some of the price action ???
Let us know what happens next in the comments!

BTCD more drop#BTCDominance
as I predicted before BTC dominance dropped down and gave us great opportunity of take profits from altcoins.
still I can see more drop to 42 that will make amazing pumps on ALTs .
take your time and find best altcoins for more profits.
My Alts Season Agenda Historically, BTC.D takes over the market in ATH Q4 cycle; specifically starting in Sep. That said, I plan to exit all my Alts to BTC by the end of this month to optimize my gains.
In other words, the Alts season maybe short-lived till the end of this month. Then it’ll kick back in by November & December.
Of course this is a historic outlook… what rules in the end is the BTC.D & the retest of BTC to the 20W SMA. These will be my triggers as we get close to the end of August.
