TradeCityPro | Bitcoin Daily Analysis #49👋 Welcome to TradeCity Pro!
Let's dive into the analysis of Bitcoin and key crypto indices. As usual, I will review the futures session triggers for the New York market.
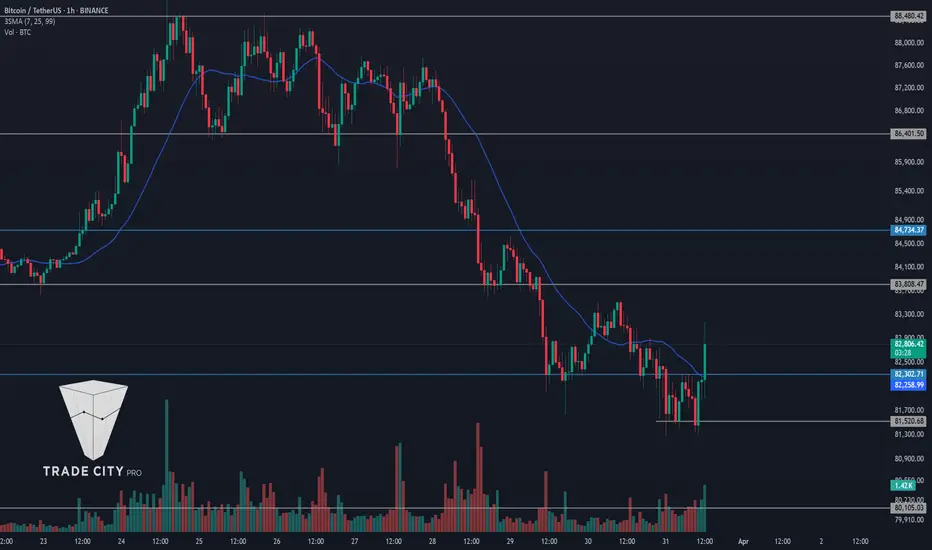
⌛️ 1-Hour Timeframe
In the 1-hour timeframe, as you can see, the downtrend continues, and yesterday the price dropped below 82,302, now reaching 81,520.
📊 Selling volume has increased in the market, and the SMA 25 has been tracking the price movement effectively in this cycle. Currently, as the price pulls back to 82,302, it is also testing the SMA 25, placing it in a critical zone.
🔽 For a short position, considering this pullback to the SMA 25, you can enter a trade if 81,520 breaks. The next support level in case of a further decline is 80,105.
📈 For a long position, we still need to wait for a proper trend reversal structure to form. There is no valid trigger for a long entry at this moment.
👑 BTC.D Analysis
Now, let’s analyze Bitcoin dominance. Yesterday, the ascending trendline was broken, but the trigger at 62.06 was not activated, leading to a bullish move instead.
⚡️ Currently, 62.30 has broken, and if this breakout holds, dominance could rise to 62.66.
💥 However, if the 62.30 breakout turns out to be a fakeout, a break below 62.06 would confirm a bearish trend reversal.
📅 Total2 Analysis
Moving on to Total2, yesterday the 0.984 support broke, but it now appears to be a fakeout, as the price is stabilizing back above this level.
💫 For a short position, confirmation will come if the price closes below 0.984. If that happens, the next downside target would be 0.953.
🔼 For a long position, a break above 1.01 would confirm the trend reversal, given the fakeout at 0.984.
📅 USDT.D Analysis
Now, let’s analyze USDT dominance. A range has formed between 5.41 and 5.56, and dominance has rejected from 5.41, now moving downward again.
✔️ If 5.41 breaks, it would be the first confirmation of a trend change.
✨ For a bullish continuation, a break above 5.56 would confirm the next bullish leg.
❌ Disclaimer ❌
Trading futures is highly risky and dangerous. If you're not an expert, these triggers may not be suitable for you. You should first learn risk and capital management. You can also use the educational content from this channel.
Finally, these triggers reflect my personal opinions on price action, and the market may move completely against this analysis. So, do your own research before opening any position.
Btcdominance
BTC.D at a Critical Juncture – Will Altcoins Take the Spotlight?CRYPTOCAP:BTC.D
The BTC Dominance (BTC.D) chart is at a critical juncture. Here's my analysis:
1️⃣ Key Resistance Area: The dominance has approached a significant resistance trendline. This zone is crucial, as it has historically acted as a turning point.
2️⃣ Potential Pullback: In my opinion, this could be the last pullback before BTC.D resumes its downtrend. If this scenario plays out, it could signal the start of the long-awaited altseason.
3️⃣ Break Confirmation: Keep an eye on the lower support level highlighted on the chart. A clean break below this level (more secure than the previous one) would confirm bearish momentum and strengthen the case for a further decline.
4️⃣ Targets: The first target is around 50.81%, with potential for deeper declines if momentum continues.
💡 Key Takeaway: This analysis suggests that BTC dominance is showing signs of weakening. If the support breaks, altcoins could gain significant market share. Watch these levels closely and prepare for opportunities in the altcoin market.
What do you think? Do you agree with this outlook, or do you see BTC.D holding its dominance longer? Feel free to share your thoughts below!
#Crypto #BTC.D #Altseason

TradeCityPro | Bitcoin Daily Analysis #48👋 Welcome to TradeCity Pro!
Let's dive into the analysis of Bitcoin and key crypto indices. As usual, in this analysis, I will review the futures session triggers for the New York market.
⌛️ 1-Hour Timeframe
In the 1-hour timeframe, as you can see, yesterday the price made a pullback and a correction, briefly moving above the SMA 25, but now it has dropped back below this level.
🔍 This correction has reinforced the 82,302 level as a stronger support, making a break below this area even more significant.
💫 If 82,302 breaks, I strongly recommend having a short position, as breaking this level could initiate the next bearish leg.
🔼 For a long position, our current trigger is 83,808, but this is a risky trigger, and I believe it's better to wait for the market to establish a new structure.
👑 BTC.D Analysis
Now, let’s analyze Bitcoin dominance. The dominance remains bullish and is currently stabilizing above 62.30.
✔️ If this level holds, the next resistance will be 62.66, and dominance could initiate another bullish leg toward this zone.
🔽 For a bearish move, we need to wait for the ascending trendline to break and then confirm the downtrend with Dow Theory before considering short positions.
📅 Total2 Analysis
Moving on to Total2, yesterday the price closed below 1.01, and now it has pulled back to retest this level. It seems ready to initiate the next bearish leg.
📉 For a short position, breaking 0.984 remains the key trigger. If this level breaks, you can enter a position.
🔼 For a long position, we need to wait until the strong bearish momentum fades and buyers start entering the market.
📅 USDT.D Analysis
Now, let’s analyze USDT dominance. As you can see, dominance has completed a bullish leg, followed by a slight correction, and now it has regained bullish momentum and is moving upward again.
💥 For further upside, breaking 5.49 is the key trigger to enter a long position.
⚡️ For a bearish move, we need to wait for a new bearish structure to form before considering short positions.
❌ Disclaimer ❌
Trading futures is highly risky and dangerous. If you're not an expert, these triggers may not be suitable for you. You should first learn risk and capital management. You can also use the educational content from this channel.
Finally, these triggers reflect my personal opinions on price action, and the market may move completely against this analysis. So, do your own research before opening any position.

BTC.D - POTENTIAL FOR REVERSE (ALTSEASON POTENTIAL) - FEB 2025BTC Dominance is at a strong resistance area (62%) right now. If this zone continues to hold, we could finally, I mean FINALLY see Altseason emerge. I know it’s been a long wait! 🚀🔥

Bitcoin Dominance Keeps Climbing Despite Bearish Divergence📉 Bitcoin Dominance Keeps Climbing Despite Bearish Divergence
🚨 Since January 29, 2025, a massive bearish divergence on Bitcoin dominance ( CRYPTOCAP:BTC.D ) has been forming... yet it never materialized!
🔍 Even worse—this divergence keeps growing, meaning CRYPTOCAP:BTC.D is overbought but still pushing higher, defying all technical indicators.
💡 The March 19, 2025 FOMC Pump:
Bitcoin jumped +6% from GETTEX:82K to $86K 📈
Altcoins barely moved—most stayed stable or had a minor push 📉
This was not an organic move—it was institutional & political manipulation
⚠️ The Consequences:
Altcoins are getting wrecked—again 😤
When Bitcoin corrects, altcoins will crash harder 🚨
Bitcoin maximalists (Saylor, politicians, whales) are pushing Bitcoin at the expense of the entire crypto industry
🎭 Reality Check:
Bitcoin maximalists don’t care about crypto—they care about their own bags 💰. Their goal? Kill altcoins & centralize wealth in Bitcoin.
⏳ Until the crypto industry wakes up to this war between Bitcoin maximalists & the rest of the market, nothing will change.
Another altseason cancelled, another liquidity funnel into Bitcoin to protect institutional & banking interests.
Hopefully this bearish divergeance will finally plays out and we will see this very welcome altseason. Until then, altcoins are struggling.
#Bitcoin #Crypto #Altcoins #BTC #BearishDivergence #CryptoManipulation #AltseasonCancelled #BTCMaximalists #CryptoNews #Saylor #InstitutionalManipulation

TradeCityPro | Bitcoin Daily Analysis #47👋 Welcome to TradeCity Pro!
Let's dive into the analysis of Bitcoin and key crypto indices. As usual, in this analysis, I will review the futures session triggers for the New York market.
⌛️ 1-Hour Timeframe
In the 1-hour timeframe, as you can see, yesterday the 83,808 trigger was activated, and the price moved down to the next support at 82,302.
⚡️ The 19.70 level in the RSI is a crucial area, as the price has reacted to this level in the last two bearish legs, leading to slight corrections.
✔️ Today, it might be a bit late to open new positions, as the price is slightly oversold, suggesting that the move has already extended sufficiently.
🔽 This situation means we should enter positions with lower risk today. The short trigger for today is 82,302, and if this level breaks, the price could decline even further.
📈 For a long position, we need to wait for confirmation of a trend reversal. First, the SMA 25 must reach the price, and then a Dow Theory confirmation should establish a new bullish trend.
👑 BTC.D Analysis
Now, let’s analyze Bitcoin dominance. As you can see, this index increased yesterday as the market dropped. It briefly faked out above 62.14 before reversing downward again.
🎲 At the moment, 62.14 remains a key trigger for bullish dominance, while the main support level is 61.81.
📅 Total2 Analysis
Moving on to Total2, this index is in bad shape. It has broken its key support at 1.01 and is now moving toward 0.984.
💥 I can't provide any specific trigger for this chart today because it has dropped significantly without any corrections. For now, we need to wait for a new structure to form.
📅 USDT.D Analysis
Now, let’s look at USDT dominance. Yesterday, dominance finally stabilized above 5.34, which triggered a market drop.
🔍 Currently, USDT dominance has reached the next resistance at 5.48 and has shown a reaction to this level. To confirm further upside, we need a break above 5.48. If a correction starts and we see more red candles, the price could retrace back down to 5.34.
❌ Disclaimer ❌
Trading futures is highly risky and dangerous. If you're not an expert, these triggers may not be suitable for you. You should first learn risk and capital management. You can also use the educational content from this channel.
Finally, these triggers reflect my personal opinions on price action, and the market may move completely against this analysis. So, do your own research before opening any position.

TradeCityPro | Bitcoin Daily Analysis #46👋 Welcome to TradeCity Pro!
Let's dive into the analysis of Bitcoin and key crypto indices. As usual, in this analysis, I will review the futures session triggers for the New York market.
⌛️ 1-Hour Timeframe
In the 1-hour timeframe, as you can see, yesterday the 86,401 trigger was activated, and the price moved downward. Since the price was making lower highs, I anticipated this move yesterday, and now the price is near 83,808, approaching this support level.
✔️ At this point, I believe the price has declined sufficiently, and it may start forming a base around 83,808. However, for a short position, this same 83,808 level is key, and we can enter a position if it breaks below this area.
🔼 For a long position, we need to wait until at least the SMA 25 reaches the price and the price stabilizes above this zone. Once the trend turns bullish, we can consider opening a long position.
👑 BTC.D Analysis
Moving on to Bitcoin dominance, as the market declined and Bitcoin broke support, dominance increased. This helped Bitcoin hold up better than other coins, which experienced heavier losses.
📊 Currently, dominance has reached 62.14 and faced a strong rejection from this level. If a corrective phase begins, the key support area for price is 61.81, and the price could retrace to this level.
✨ For a bullish move in dominance, a break above 62.14 is required, with the next resistance at 62.30.
📅 Total2 Analysis
Now let’s analyze Total2. As I mentioned, altcoins have experienced a much sharper decline than Bitcoin, and after breaking 1.06, Total2 started a strong downtrend, even breaking through 1.04.
🎲 Currently, the price is fluctuating between 1.01 and 1.04, and it seems that the trend is showing signs of weakness, indicating that this bearish leg may be ending. If a correction begins, the price could move up to 1.04. However, for the next short position, the trigger level to watch is 1.01.
📅 USDT.D Analysis
Now let’s analyze USDT dominance. This index broke through the key 5.19 level and has risen to 5.34.
🌩 If a candle closes above this level, the next major resistance is at 5.45. In case of a pullback, the key support to watch is 5.25.
❌ Disclaimer ❌
Trading futures is highly risky and dangerous. If you're not an expert, these triggers may not be suitable for you. You should first learn risk and capital management. You can also use the educational content from this channel.
Finally, these triggers reflect my personal opinions on price action, and the market may move completely against this analysis. So, do your own research before opening any position.

WARNING! Sell Your Altcoins, They Will Go To Zero!Hello, Skyrexians!
We had some doubts in this scenario, but now price action clarified it. CRYPTOCAP:BTC.D has finally decided to pump in the wave 5 and this wave can be even extended. Altcoins Will lose 70% of their value and never pump after that to cover your losses.
Let's take a look at the daily chart. We have already shown you this Elliott waves picture. Earlier we mentioned that may be wave 5 was shortened, but not, it has finally decided to reach new highs at 66% at least, in case of normal wave 5, but just imagine if it will reach 70%, the extended target. Your portfolio will be -70% from the current price. We need to be honest with you, altseason never comes and we have to forget about it.
Best regards,
Skyrexio Team
___________________________________________________________
Please, boost this article and subscribe our page if you like analysis!

USDT.DOMINANCE 4HOUR CHART UPDATE !!A downward trend in USDT dominance typically signals growing confidence in riskier assets (such as Bitcoin and altcoins), as traders move funds out of stablecoins and into crypto investments.
Breakout Attempt
The latest price action shows a breakout from the descending channel.
This signals a potential reversal, during which traders may return funds to USDT due to market uncertainty or a correction in crypto prices.
The black line forecasts a strong upward move in USDT dominance.
If this happens, it could indicate that investors are selling crypto holdings and moving funds into stablecoins in anticipation of a market decline.
If you found this analysis helpful, hit the Like button and share your thoughts or questions in the comments below. Your feedback matters!
Thanks for your support!
DYOR. NFA

TradeCityPro | Bitcoin Daily Analysis #45👋 Welcome to TradeCity Pro!
Let's dive into the analysis of Bitcoin and key crypto indices. In this analysis, as usual, I want to review the futures session triggers for the New York market.
⌛️ 1-Hour Timeframe
In the 1-hour timeframe, as you can see, the price is still within a ranging box between 86,401 and 88,480.
🔍 The price is making lower highs, and it seems that the bullish momentum has faded. However, valid triggers for both short and long positions can still be found.
✨ For a short position, you can enter if the price breaks below 86,401. In this case, the price could extend its corrective leg down to 84,734.
🔽 For a long position, you can enter if the price breaks above 88,480. This is a very important trigger and could start the next bullish leg up to 91,588.
👑 BTC.D Analysis
Let's move on to Bitcoin dominance. This dominance has formed a bit more structure, and its triggers are also close.
⚡️ If 61.63 breaks, we confirm a bearish trend, and if 61.81 breaks, we confirm a bullish trend.
📅 Total2 Analysis
Let's analyze Total2. This index also has a ranging box between 1.06 and 1.08, which can provide good trading opportunities.
💫 If 1.08 breaks, we confirm a long position for altcoins. For a short position, a break of 1.06 is suitable.
📅 USDT.D Analysis
Now, let’s analyze USDT dominance. As you can see, we are witnessing a downtrend, and now a box has formed between 5.19 and 5.05.
🧩 To confirm a bullish move in dominance, we need a break above 5.19. The bearish triggers for USDT dominance are 5.11 and 5.05.
❌ Disclaimer ❌
Trading futures is highly risky and dangerous. If you're not an expert, these triggers may not be suitable for you. You should first learn risk and capital management. You can also use the educational content from this channel.
Finally, these triggers reflect my personal opinions on price action, and the market may move completely against this analysis. So, do your own research before opening any position.

ALTSEASON 2025Dear investors and traders, members of the Horban Brothers community!
Today I come to you not with a warning of an impending crisis, but with the certainty that we are on the threshold of significant changes. The cryptocurrency market, which has been wavering in uncertainty for a long time, is finally entering a phase of active growth. Yes, you heard me right - from this moment, from today, we see all the signs that cryptocurrency is ready to take off.
All the data points to this: institutional investment in cryptocurrency is up 400% year-on-year, regulation is becoming clearer, leading to increased confidence among the big players, and most importantly, technological innovation in blockchain continues to convince even the most skeptical.
Make no mistake, the volatility of the cryptocurrency market will not go away, but those who are willing to accept these risks can expect rewards that are rarely seen in traditional markets. I'm not suggesting you rush out to buy everything, but carefully analyze those assets that show fundamental strength and technological resilience.
Now is not the time to be passive. Check your portfolios, reassess your strategies. If you're still standing on the sidelines of cryptocurrencies, now is the time to get in on the action. But remember, this is not for the faint of heart - this is a game for those who are willing to study, analyze and act.
This market, like any other, requires discipline and knowledge. Don't get caught up in emotions, don't fall for the hype, evaluate each project critically. But if you see that the project has potential, do not be afraid to invest.
Remember that cryptocurrencies are not just tokens; they are the foundation of the future financial world. And that world is already beginning to take shape.
Regards CFO Horban Brothers,
Alex Kostenich

TradeCityPro | Bitcoin Daily Analysis #44👋 Welcome to TradeCity Pro!
Let's dive into the analysis of Bitcoin and other important crypto indices. As usual, I want to review the futures triggers for the New York session for you.
⏳ 1-Hour Timeframe
In the 1-hour timeframe, as you can see, yesterday Bitcoin managed to stabilize above 86876 and moved up to 88480.
⚡️ Currently, the area that the price has reacted to is 86401, so I moved the 86401 line from 86876.
💥 As I mentioned yesterday, if the RSI had stayed above 70, the movement could have continued, which it did, but the RSI did not stabilize above 78.58 and we did not witness a pump.
💫 With the break of the 70 area in the RSI, the upward momentum disappeared and the corrective phase of the price began. The market volume is currently in favor of the buyers and has decreased during the correction.
🔽 Today, for a short position, you can enter a risky position with a break of 86401 because the market trend is currently upward and all short positions are considered risky for now.
📈 For a long position, we currently don't have any specific triggers sooner than 88480, and if you want to open a position sooner, you need to wait for more structure to be created and catch triggers in lower timeframes.
👑 BTC.D Analysis
Let's move on to the analysis of Bitcoin dominance, yesterday the dominance made a lower peak than 61.80 and was rejected from 61.76.
✨ Currently, a box has formed between 61.35 to 61.76, and breaking any of these areas could confirm and start the next leg.
📅 Total2 Analysis
As for Total2, as you can see, this index is doing much better than Bitcoin and has made less correction because dominance was rejected from 61.76 yesterday.
🔑 Today, I don't have a short trigger for Total2 because it's very bullish, but for a long, the trigger of 1.09 is very suitable and with a break of this area, we can witness the next bullish leg up to 1.12.
📅 USDT.D Analysis
Let's look at the USDT.D, it seems a range box is forming between 5.15 and 5.05, and breaking either of these areas could be important.
🎲 A break of 5.05 for a short, especially if it coincides with a break of 1.09 in Total2, would be very appropriate.
❌ Disclaimer ❌
Trading futures is highly risky and dangerous. If you're not an expert, these triggers may not be suitable for you. You should first learn risk and capital management. You can also use the educational content from this channel.
Finally, these triggers reflect my personal opinions on price action, and the market may move completely against this analysis. So, do your own research before opening any position.

TradeCityPro | Bitcoin Daily Analysis #43👋 Welcome to TradeCity Pro!
Let's dive into the analysis of Bitcoin and other key crypto indices. As usual, I want to discuss the futures triggers for the New York session.
⏳ 1-Hour Timeframe
In the 1-hour timeframe, as you can see, Bitcoin finally moved, activating our trigger, and it reached its target. Now, let's analyze today's triggers.
🔄 Yesterday, the breakout of the 84734 range box was activated, and the price made an upward move.
✔️ Currently, the price has reached 86876 and has been rejected from this area but is still above it. If it can stabilize above this area, the next price leg could start.
💥 The RSI oscillator has significant resistance at 78.58, and breaking this area could introduce a lot of momentum into the market, potentially starting a robust upward leg.
⚡️ Additionally, this oscillator has important support at 70, and if it can maintain above this area, the likelihood of breaking 86876 increases.
🔽 For short positions, we need to wait for the price momentum to turn bearish before entering in line with the trend direction.
🧩 If the price does not stabilize above 86876 and moves downward, with confirmation from Dow Theory or the activation of a fake breakout trigger, you can enter a short position.
👑 BTC.D Analysis
Let's move on to the analysis of Bitcoin dominance. Yesterday, dominance was supported at 61.35 and moved up to 61.80, which helped Bitcoin rise more than altcoins.
🧲 Currently, dominance has been rejected from 61.80 and is moving downwards. I believe a range has formed between 61.35 and 61.80, and breaking this box in either direction could determine the next leg of dominance.
📅 Total2 Analysis
Moving on to Total2, yesterday the price broke the 1.05 area and moved upwards, even surpassing 1.07. Currently, I have moved the 1.05 area to 1.06 because it is more accurate, and the price has moved away from it.
⭐ The next resistance for the price is at 1.09, and it seems that Total2 could move up to this area.
📅 USDT.D Analysis
Finally, let's look at the Tether dominance analysis. Yesterday, the 5.25 trigger in dominance was activated, and we observed a clean pullback in dominance that brought it down to 5.13.
✨ The next support for dominance is at 5.08, and we need to see if it can stabilize below this area or not.
❌ Disclaimer ❌
Trading futures is highly risky and dangerous. If you're not an expert, these triggers may not be suitable for you. You should first learn risk and capital management. You can also use the educational content from this channel.
Finally, these triggers reflect my personal opinions on price action, and the market may move completely against this analysis. So, do your own research before opening any position.

Is altseason soon?Hi, traders 👋
I’d like to share my thoughts and observations regarding Bitcoin dominance and the timing of the long-awaited altseason.
In general, I like to determine the phase altcoins are in by analyzing one of the oldest representatives of this group — Litecoin.
Like other financial instruments, cryptocurrency tends to follow certain patterns. Although each cycle comes with its own unique characteristics, historical similarities are often present.
Let’s take a look at the Litecoin chart.
When reviewing the chart, we can see a number of similarities with the previous cycle. Based on this, and if we assume that markets are cyclical and certain chart patterns and behaviors tend to repeat, it appears we are currently either in the equivalent of March or September 2020.
The case for March is supported by the fact that we haven’t yet seen a final liquidity sweep according to the Wyckoff model — the so-called “spring” phase. On the other hand, the case for September is supported by the timing following the end of the previous bear market phase.
Now, let’s take a look at the Bitcoin dominance chart.
In this cycle, the dominance chart has been showing clear and reliable chart patterns.
The pattern that has been forming since November 21, 2024, could potentially be either a Wolfe wave or an ending diagonal triangle according to Elliott Wave theory. At the moment, waves 1, 2, and 3 are clearly visible, and wave 4 is currently in the process of forming. There is also a clear alternation between waves 2 and 4, which strengthens this observation.
If the assumption about the Wolfe wave pattern is correct, we should still see one final push higher in Bitcoin dominance as part of wave 5. This would likely lead to a further decline in altcoins. In that case, referring back to the Litecoin chart analysis, it would confirm that we are currently in the equivalent of March 2020.
I’m glad to share my observations with you.

TradeCityPro | Bitcoin Daily Analysis #42👋 Welcome to TradeCity Pro!
Let's delve into the analysis of Bitcoin and other key crypto indices. As usual, I will review the futures triggers for the New York session for you.
⏳ 1-Hour Timeframe
In the 1-hour timeframe, as you can see, the price still maintains a range box between 83808 and 84734, and the market volume has decreased even more from yesterday.
📊 The less the volume, the closer we are to a price movement, so again, keep an eye on the market to ensure you don't miss any active triggers.
⚡️ For a short position, you can enter with a break of 83808, and for a long position, with a break of 84734.
👑 BTC.D Analysis
Let's move to the analysis of Bitcoin dominance. Yesterday, the support at 61.43 was broken, and it's moving towards 61.08.
✔️ Currently, I don’t have any specific triggers for confirmation in dominance, but as long as the dominance stays below 61.43, I see it continuing its downward trend.
📅 Total2 Analysis
On to the analysis of Total2, the trigger at 1.05 is about to be activated, and the price could move towards 1.07 with a break of this area.
🔽 The short trigger remains at 1.04 for now.
📅 USDT.D Analysis
Finally, looking at the Tether dominance, this index is still ranging between 5.25 and 5.34.
💫 A break of either of these areas could determine the next leg of the price movement.
❌ Disclaimer ❌
Trading futures is highly risky and dangerous. If you're not an expert, these triggers may not be suitable for you. You should first learn risk and capital management. You can also use the educational content from this channel.
Finally, these triggers reflect my personal opinions on price action, and the market may move completely against this analysis. So, do your own research before opening any position.

TradeCityPro | Bitcoin Daily Analysis #41👋 Welcome to TradeCity Pro!
Let's delve into the analysis of Bitcoin and important crypto indices. Today, as usual, I aim to review the New York session futures triggers for you.
⏳ 1-Hour Timeframe
In the 1-hour timeframe, as you can see, Bitcoin is still in a range box between 83808 and 84734, and the market volume is continuously decreasing.
📊 The market volume has reached its lowest possible level, indicating that a move is imminent, so be alert today as the likelihood of our triggers activating is very high.
🔼 For a long position, entering at a break of 84734 could be beneficial, as breaking this area could start a bullish leg up to 86876.
📉 For short positions, a break of 83808 remains suitable. Yesterday, the price briefly breached this area but seemed to rebound, making it still appropriate for positioning.
👑 BTC.D Analysis
Moving on to Bitcoin dominance analysis, as you can see, dominance was rejected from the high of 61.63 yesterday, then set a lower high compared to this area, and now the floor of 61.43 has been broken.
💫 Currently, with the break of 61.43, dominance could move down to 61.08. However, if the break of 61.43 proves to be a fake-out, the likelihood of breaking 61.63 increases.
📅 Total2 Analysis
Let’s talk about Total2; this index doesn't have a very reliable trigger right now, and you can still enter a position with a break of 1.07, but if the price reacts to 1.05, on a second contact, entering on a break of this area might be viable.
🔽 For short positions, a break of 1.04 is suitable, and you can enter a position with the break of this area.
📅 USDT.D Analysis
Lastly, analyzing Tether dominance, it is still ranging and has formed a box between 5.25 and 5.34.
✔️ For a downward trend in dominance, you can confirm with a break of 5.25, and for an upward trend, a break of 5.34 will serve as your confirmation.
❌ Disclaimer ❌
Trading futures is highly risky and dangerous. If you're not an expert, these triggers may not be suitable for you. You should first learn risk and capital management. You can also use the educational content from this channel.
Finally, these triggers reflect my personal opinions on price action, and the market may move completely against this analysis. So, do your own research before opening any position.

BTC-DOM- BTC dominance can't keep rising indefinitely.
-If we see a BTC dip, BTC dominance could climb to around 66% (71.8% Fibonacci), but in my opinion, that’s likely the maximum.
- If BTC surges too quickly and too high, altcoins will be suppressed, causing BTC dominance to potentially rise also to around 66%. However, once again, I believe that's would be the max.
- After any of both cases, altcoins will start to moon fly.
- 36-bar, 1096-day uptrend on the BTC dominance chart. That’s a significant duration from 2018 to 2021. The timespan from 2022 to 2025 could mirror the previous one.
- Take note also on the Bearish Divergence between the trend and the RSI. ( i will post weekly graphic also to show a more clear view ).
- An uptrend of this length indicates strong, sustained interest in BTC compared to altcoins. However, long-term trends like this are prone to exhaustion.
For now, just hold your alts and practice golden patience.
Happy Tr4Ding !

TradeCityPro | Bitcoin Daily Analysis #40👋 Welcome to TradeCity Pro!
Let's delve into the analysis of Bitcoin and important crypto indices. Today, as usual, I aim to review the New York session futures triggers for you.
⏳ 1-Hour Timeframe
In the 1-hour timeframe, as you can see, the price has pulled back to below the 84734 area again today.
🔽 The short trigger we have for today is the break of 83808. With the break of this area, the price could move downwards.
✅ The important supports are at 82459 and 80105, which we can use as targets.
📈 For a long position, entering at a break of 84734 could be beneficial, with a target at 86876.
👑 BTC.D Analysis
Moving on to the Bitcoin dominance analysis, a support was established yesterday at 61.43, creating a price box between 61.43 and 61.63.
💫 To confirm an upward trend in dominance, watch for a break of 61.63, and for a downward trend, a break of 61.43 will serve as a confirmation.
📅 Total2 Analysis
Let’s talk about Total2; this index has broken its support at 1.04, and if Bitcoin also loses its support, it could move down to 1.01 again.
🎲 If you don't have positions open, you might consider looking for altcoins that have not yet lost their support, or wait for Bitcoin.
🔼 For long positions, the trigger for Total2 remains at 1.07.
📅 USDT.D Analysis
Lastly, analyzing Tether dominance, it has come back above 5.26, pulled back to this area, and is poised to potentially initiate an upward leg to 5.46.
✔️ The upward dominance trigger for Tether is a break of 5.31. With the break of this area, we can expect dominance to potentially rise again to 5.46.
📉 For downward dominance, a break of 5.26 is a suitable trigger.
❌ Disclaimer ❌
Trading futures is highly risky and dangerous. If you're not an expert, these triggers may not be suitable for you. You should first learn risk and capital management. You can also use the educational content from this channel.
Finally, these triggers reflect my personal opinions on price action, and the market may move completely against this analysis. So, do your own research before opening any position.

USDT.DOMINANCE WEEKLY CHART UPDATE. Current Market Structure:
Breakout Confirmation: USDT Dominance has broken out of its descending trendline and is now in a retest phase.
50MA as Support: The 50-week moving average now acts as dynamic support, reinforcing the bullish outlook.
Rejection or Breakout? The price is currently testing resistance. If it gets rejected, a temporary pullback is likely before further gains.
If you found this analysis helpful, hit the Like button and share your thoughts or questions in the comments below. Your feedback matters!
Thanks for your support!
DYOR. NFA

TradeCityPro | Bitcoin Daily Analysis #39👋 Welcome to TradeCity Pro!
Let's delve into the Bitcoin and key crypto indexes analysis. As usual, I want to review the New York session futures triggers for you.
⏳ 1-hour timeframe
As you can see in the 1-hour timeframe, Bitcoin broke the 84734 resistance yesterday and the price moved upwards. We had some triggers before breaking this area, which I hope you opened positions with and made some profits.
✅ Currently, the price has reached the 86876 area, got rejected, and has returned to 84734. Given the low volume of the red candles, we can consider this movement a correction and a ranging box might form between 84734 and 86876.
⚡️ For today, the best long trigger is breaking 86876, which the price has already hit once. If it can break this area in subsequent contacts, we can enter a position.
🔽 For short positions, the first trigger is the break of 84734, but it’s a risky trigger and I prefer to wait until the price makes a significant trend change before entering a position.
👑 BTC.D Analysis
Moving on to the Bitcoin dominance analysis, yesterday, as Bitcoin's price increased, dominance broke through 61.49 and moved downward, which helped altcoins move higher.
💫 However, as dominance reached 61.08, the market momentum completely changed, and dominance returned above 61.49. Now, after the trend line break, with the break of 61.63, we can confirm a fake breakout.
🧩 For dominance to move downward, the break of 61.49 is still appropriate, and a break of this area can still confirm a downward trend in dominance.
📅 Total2 Analysis
Moving on to the Total2 analysis, yesterday’s trigger at 1.04 was activated, and I moved this area to 1.05 today because the price reacted better to it.
⭐ If you had opened a position with the break of 1.04, you could have made a good profit as the price reached 1.07.
🔑 Currently, the price is ranging between 1.05 and 1.07, and you can open positions if any of these areas break.
📅 USDT.D Analysis
Finally, looking at the Tether dominance, the chart is very similar to Total2 but in reverse.
✨ A break of 5.26 confirms an upward trend, and a break of 5.13 confirms a downward trend in dominance.
❌ Disclaimer ❌
Trading futures is highly risky and dangerous. If you're not an expert, these triggers may not be suitable for you. You should first learn risk and capital management. You can also use the educational content from this channel.
Finally, these triggers reflect my personal opinions on price action, and the market may move completely against this analysis. So, do your own research before opening any position.

66% Is About To Cancelled For Bitcoin DominanceHello, everyone!
Earlier we made analysis on CRYPTOCAP:BTC.D where pointed out that it can reach 66% before altseason or reverse from 62.5%. Now it looks like we can see the second scenario because momentum is almost gone and we are about to see the second confirmation of trend change.
Let's take a look at the weekly chart. Like the previous time we still have active red dot signal on Bullish/Bearish Reversal Bar Indicator . We have the great angulation with the alligator. This time we also have the double divergence with Awesome Oscillator which has been almost confirmed. We wanna see the three red columns in a row and this reversal is going to be strongly confirmed. The minimum target is 0.5-0.61 Fibonacci zone, but in case of true altcoin season we can see the new all time low.
Best regards,
Skyrexio Team
___________________________________________________________
Please, boost this article and subscribe our page if you like analysis!

TradeCityPro | Bitcoin Daily Analysis #38👋 Welcome to TradeCity Pro!
Let's dive into the Bitcoin analysis and key crypto indexes. As usual, I will review the futures triggers for the New York session for you.
✨ Yesterday, our short trigger was activated, and the price moved downward but then moved back up after a few candles.
⏳ 1-hour timeframe
In the 1-hour timeframe, as I mentioned, the trigger at 82066 that I specified for you yesterday was activated, but I personally opened my position at the break of 82459 because there was good downward momentum in the market, and the candle that broke this area was very strong.
🔄 The position I opened went to a risk-to-reward of 2 and became risk-free, and then the market moved upwards, now reaching 83806.
💫 Today, for opening positions, our long trigger is exactly 83906, and if the price breaks this area, we could see the next upward leg. I prefer that the price reacts to this area once and then breaks through it.
✔️ However, be aware that there is another important area at 84573 and a significant range has formed between 83906 and 84573. If you want to open a position confidently, wait until 84573 is also broken so the price can fully exit this range.
⚡️ A break of 62.94 in the RSI can be a good confirmation of momentum. As you can see, the volume is gradually increasing, which is suitable for a long position.
🔽 For short positions, you can still enter with a break of 82459. It's better to wait for the price to react to this area once and look for a break on the second contact.
👑 BTC.D Analysis
Let's move on to the analysis of Bitcoin dominance. As you can see, a descending triangle has formed, and the price has a downward trend line that has caused it to set a lower high every time it reaches 61.49, and now there is a very high chance of breaking this area, which could start a new downward leg in dominance.
👀 On the other hand, if the trend line breaks, dominance could move back up to 62.03. If this happens, money will move out of altcoins and into Bitcoin.
📅 Total2 Analysis
Let's move on to the analysis of Total2. This index still hasn't exited its ranging box and is moving between 1.01 and 1.04.
🔼 You can open a long position with a break of 1.04 and a short position with a break of 1.01.
📅 USDT.D Analysis
Let's look at the USDT.D analysis. Yesterday, the 5.43 area was broken, but like Bitcoin, after a few candles, this area was faked, and the price returned to the box between 5.28 and 5.43.
🔑 For confirming a downward trend in Tether dominance, you can confirm with a break of 5.28. For an upward trend in dominance, you should wait until the price creates a new structure.
❌ Disclaimer ❌
Trading futures is highly risky and dangerous. If you're not an expert, these triggers may not be suitable for you. You should first learn risk and capital management. You can also use the educational content from this channel.
Finally, these triggers reflect my personal opinions on price action, and the market may move completely against this analysis. So, do your own research before opening any position.

TradeCityPro | Bitcoin Daily Analysis #37👋 Welcome to TradeCity Pro!
Today, we're going to analyze Bitcoin and other important crypto indices. In this analysis, as usual, I want to examine the futures triggers for the New York session.
⏳ 1-hour timeframe
In the 1-hour timeframe, as you can see, after breaking 83806, a downward movement occurred, but afterward, it moved upwards again and now has formed a box between 82066 and 83806.
⚡️ Today, we have triggers for both long and short positions because the price has created a good structure for opening positions, and since it's the beginning of the week, volume could enter the market.
✔️ Additionally, we have an ascending trend line that started from the base at 77598 and the price has touched it several times. If this trend line breaks, the price could start a new downward leg.
🔼 For long positions, the first trigger we have is 83806, which could coincide with an RSI of 54.70. However, this trigger is risky and the main trigger for breaking is 84817.
📉 For short positions, a good trigger was created yesterday at 82066. Breaking this area could start the next downward leg to 80105. This trigger is also a trigger for breaking the trend line, and breaking this area could start the next downward leg to 80105. The main trigger is the break of 80105 itself.
👑 BTC.D Analysis
Let's move on to the analysis of Bitcoin dominance, as you see, dominance has rejected from the ceiling of 62.03 again and is moving downward. Currently, dominance has again reached 61.53.
🎲 If 61.53 breaks, we can expect dominance to move downward, and on the other hand, if 62.03 breaks, the price can move upward.
✨ In general, a new range box has been formed again, and breaking the floor or ceiling of this box can determine the next price leg.
📅 Total2 Analysis
Let's move on to the analysis of Total2, this index rose from 1.01 yesterday and is moving towards 1.04 again.
💫 The long trigger for today is the break of 1.04, although we should wait until the price reacts to this area once so that the exact number of resistance is revealed, and we can open a position with its break.
🔽 For short positions, you can enter a very good and suitable short position with the break of 1.01.
📅 USDT.D Analysis
Let's move on to the analysis of Tether dominance, like Total2, its triggers have not been activated yet and nothing new can be said about it.
🔑 A breakout above 5.43 indicates an upward move and a break below 5.28 indicates a downward move
❌ Disclaimer ❌
Trading futures is highly risky and dangerous. If you're not an expert, these triggers may not be suitable for you. You should first learn risk and capital management. You can also use the educational content from this channel.
Finally, these triggers reflect my personal opinions on price action, and the market may move completely against this analysis. So, do your own research before opening any position.
