TradeCityPro | Bitcoin Daily Analysis #129👋 Welcome to TradeCity Pro!
Let’s take a look at the Bitcoin analysis and key crypto indices. As usual, in this analysis, I’ll review the futures triggers for the New York session.
⏳ 1-hour timeframe
Yesterday, Bitcoin faced a sharp drop after being rejected from the 122733 top and fell down to the 116829 level.
⚡️ Currently, the price has reached an important support area that I’ve marked for you, and at the same time, the RSI has entered the Oversold zone.
✅ Considering the main trend of the market is bullish, this RSI entry into Oversold could be a very good entry point for a long position, as it may indicate the end of the correction.
✨ If the price holds above the 116829 zone, we can enter a long position, and it’s worth opening a position at this level. Further entries can be taken with breakouts of 118494 and 122733.
👑 BTC.D Analysis
Let’s go to Bitcoin dominance. It has continued its downward movement and after breaking 64.44, it’s now moving down toward 64.18.
📊 If this level breaks, we’ll get confirmation of the continuation toward 63.96. In that case, long positions on altcoins would be very suitable.
📅 Total2 Analysis
Total2 is also undergoing a correction like Bitcoin and has settled below the 1.3 level.
⭐ If the correction continues, the next level to watch is 1.26. For long positions, you can enter after breakouts of 1.3 and 1.33.
📅 USDT.D Analysis
Now to Tether Dominance. After bouncing from the 4.22 bottom, it has returned to the box between 4.36 and 4.44.
🔑 If 4.36 breaks, the next bearish leg could start. On the other hand, if 4.44 breaks, we’ll get the first signal of a trend reversal.
Btcdominance

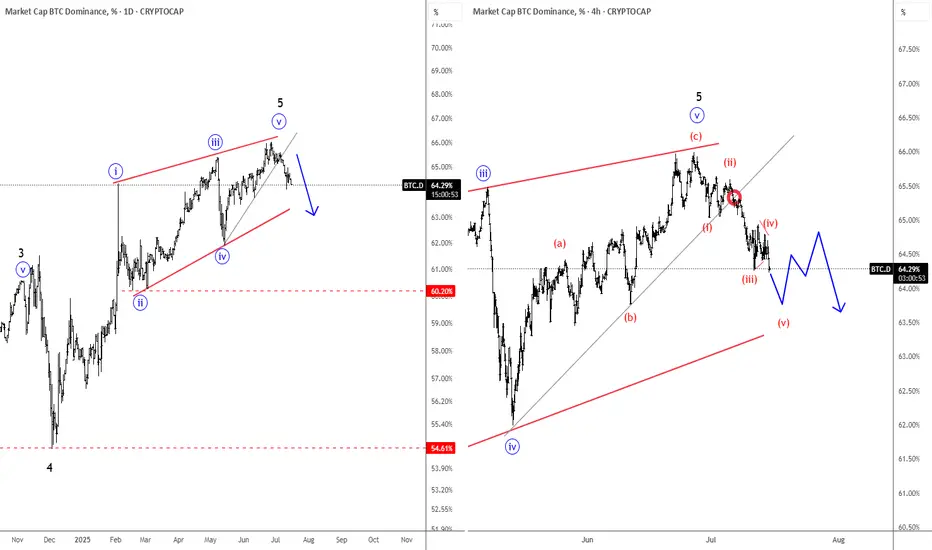
Bitcoin Dominance Found The Top; ALTcoin Dominance Stepping InHello Crypto traders! BTC.Dominance is falling in an impulsive fashion after we spotted the top within the wedge pattern. Now that is trading in wave (v) of a five-wave impulse from the highs, it just confirms a bearish reversal, which indicates that ALTcoin dominance is stepping in. And with still bullish Crypto market, we might be in the ALTseason.
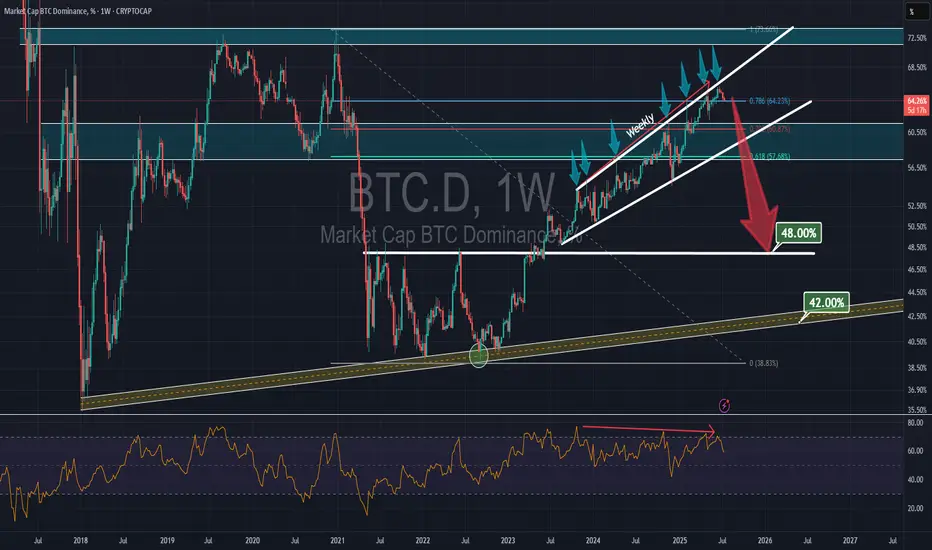
Bitcoin DOMINANCE dropssssBTC dominance has been within a rising channel since October 2023, showing a significant bearish divergence on the weekly RSI. After the seventh rejection from the channel's top, it may drop to the major support at 48%.
TradeCityPro | Bitcoin Daily Analysis #128👋 Welcome to TradeCity Pro!
Let’s get into the analysis of Bitcoin and key crypto indexes. As usual, I’ll be reviewing the futures triggers for the New York session.
⏳ 1-Hour timeframe
In the 1-Hour timeframe, as you can see, Bitcoin broke the 118494 top yesterday and is now moving upward.
✔️ According to the Fibonacci Extension zones, the price has moved up to the 0.5 Fibonacci level and has been rejected from there, printing a few red candles for now.
📊 The buying volume in this bullish leg was very high, and as you can see, volume was in convergence with the trend. Now that the corrective phase has started, the volume is also decreasing, and still remains in convergence with the uptrend.
🔔 From a momentum perspective, we’ve reached a market top because RSI has reached the ceiling it previously formed at the 85.90 level, reacted to it, and has now dropped back below the 70 zone.
💥 If the 85.90 zone on RSI is broken, we’ll likely see a very sharp and explosive bullish leg from Bitcoin. In that case, the next targets would be the 0.786 and 1 Fibonacci levels.
🔑 For opening a position now, we can enter on the break of 122512, and we could also use the price’s pullback to the SMA25 as an entry. For now, our triggers aren’t highly reliable, so positions should be based more on market momentum.
👑 BTC.D Analysis
Let’s move to Bitcoin Dominance. The dominance range box between the 64.44 and 64.82 is still ongoing, and dominance hasn’t broken out of this box yet.
⚡️ If the box breaks downward, a large amount of capital will flow into altcoins, and we could see major pumps in altcoins.
📅 Total2 Analysis
Moving on to Total2. Yesterday, the 1.3 top was broken and the price moved up toward 1.33 and has now reached that area.
I✨ f that resistance breaks, the next target will be 1.41. If a correction happens, 1.3 and 1.26 are the lower support zones.
📅 USDT.D Analysis
Now to Tether Dominance. A new bearish wave started yesterday and has continued down to 4.22.
🎲 If this zone breaks, the bearish leg can continue down to 4.08.
❌ Disclaimer ❌
Trading futures is highly risky and dangerous. If you're not an expert, these triggers may not be suitable for you. You should first learn risk and capital management. You can also use the educational content from this channel.
Finally, these triggers reflect my personal opinions on price action, and the market may move completely against this analysis. So, do your own research before opening any position.

Dominance & Altcoins- This graph is purely based on fibonacci law.
- 61.8% is the core of the system ( check rectangles in graph to get it )
- Most of long term traders not even look at the price.
- they just wait the good time to buy using Fibo.
- in 2016 BTC was almost 100%. Altcoins were inexistant. (less than 2% of the market with ETH)
- in 2021 BTC Dominance pushed to 75% (altseason followed the push)
- in 2024 we could see BTC dominance knocks 60% ish ( Altseason will follow )
- BTC is maturing.
- Cryptos are growing.
- Don't look too much at your altcoin wallets.
- Most of the time the story repeats itself.
- Respect the cycle, be patient and eat noodles!
Happy Tr4Ding !

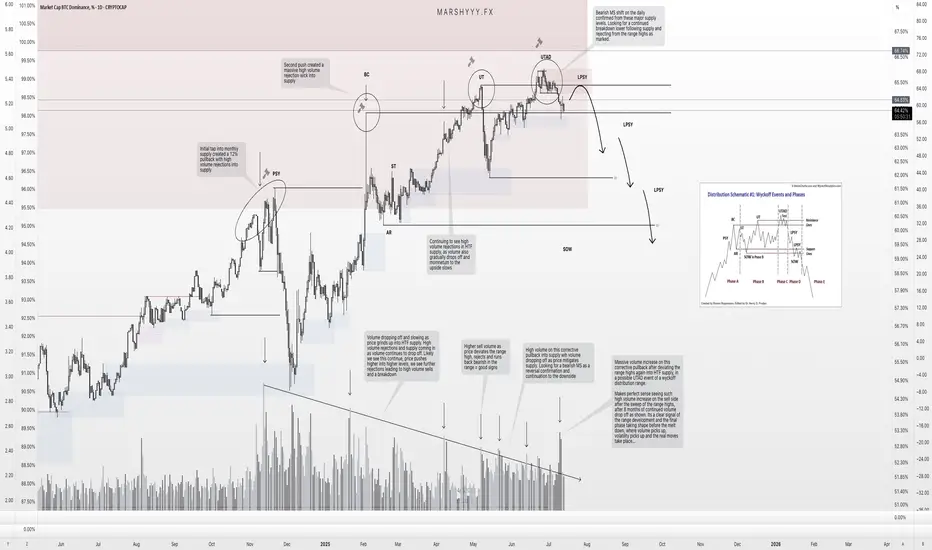
BTC.D – Distribution Confirmed. Is the Final Altseason Next?Over the past couple of months, I’ve been tracking the development of a potential high time frame (HTF) Wyckoff distribution range forming on BTC Dominance (BTC.D), and it’s now looking like that structure is starting to break down.
Back on June 14th, I noted that while we hadn’t confirmed a trend shift yet, BTC.D was showing strength and likely to push into the 65% region, with altcoin weakness to follow. The very next day, I shared my idea of a potential Wyckoff distribution forming — and since then, it’s followed that path almost perfectly.
🧠 What’s Happened Since?
✅ Sweep of the HTF range high at ~65%
✅ Second deviation of the highs
✅ Volume divergence into supply — declining volume + strong rejection candles
✅ Formation of a UTAD (Upthrust After Distribution)
✅ 1D bearish market structure break after the sweep
✅ Price now back inside the range
This is textbook distribution behaviour — even if it doesn’t follow the Wyckoff schematic to the letter, the key elements are present: deviation, volume drop-off, and structural breakdown.
🔮 What Comes Next?
BTC.D is currently holding inside a prior unmitigated daily demand, but given the structural shift, I’m expecting:
A pullback to 65–65.5% (daily supply + range high retest)
Then a continuation bearish, targeting:
🔸 49% (prior accumulation range high)
🔻 46% (FVG fill + range breakout retest)
These lower targets align with where I expect altcoins to top out — so as BTC.D breaks down, I expect capital to rotate hard into ETH and alts, triggering the final phase of altseason before the macro cycle top.
⚠️ Why This Matters
This distribution range has been developing since late 2024, and with BTC.D now showing bearish market structure, combined with:
- ETH.D flipping bullish
- OTHERS.D pushing higher
- Stablecoin dominance pairs breaking down
…we’re seeing confluence across the board for a risk-on altcoin environment.
I believe this is the setup that leads to the final euphoric altcoin rotation before the 4-year cycle top prints later this year.
📌 Watch for the retest. Watch for the rejection. The breakdown will be fast.
This is the window — time to stay sharp.
Let me know in the comments if you’ve been tracking this too, or drop your altcoin rotation picks.
— Marshy 🔥
1D:
3D:
1W:
1M:
TradeCityPro | Bitcoin Daily Analysis #127👋 Welcome to TradeCity Pro!
Let’s dive into the Bitcoin analysis and the key crypto indexes. In this analysis, as usual, I want to review the New York session futures triggers for you.
⏳ 1-Hour timeframe
In the 1-hour timeframe, as you can see, Bitcoin, after the correction down to the 116829 level, is now breaking the 118494 top again.
🔔 This move can potentially start Bitcoin’s next bullish leg. In that case, I think this leg will be a strong one because the correction was very shallow and didn’t even reach the 0.236 Fibonacci level, so the price may perform another sharp move.
💥 On the other hand, the RSI oscillator is entering Overbuy, which increases the probability of a bullish scenario and a sharp next leg.
📈 If the 118494 level is broken, we can open a long position. We already have suitable confirmations for this position since volume and RSI are aligned with price, and also the SMA25 is supporting the price and pushing it upward.
👑 BTC.D Analysis
Let’s move on to Bitcoin Dominance. The dominance trend is still bearish and continuing downward.
⭐ Currently, it’s sitting on a key support at 64.44, and breaking this level can continue the bearish move in dominance.
📅 Total2 Analysis
Let’s go over Total2. Yesterday, after correcting to the 1.26 level, it seems the next bullish move has started and it’s heading toward 1.3.
🎲 The main resistance I see for Total2 is still 1.33, and I believe this will be the main ceiling that Total2 will struggle with.
📅 USDT.D Analysis
Moving on to Tether dominance. This index is still dropping and is now sitting at the 4.36 support.
✨ Breaking this level will start the next bearish leg, and the price can move toward 4.22. If a correction occurs, the first level will be 4.49.
❌ Disclaimer ❌
Trading futures is highly risky and dangerous. If you're not an expert, these triggers may not be suitable for you. You should first learn risk and capital management. You can also use the educational content from this channel.
Finally, these triggers reflect my personal opinions on price action, and the market may move completely against this analysis. So, do your own research before opening any position.

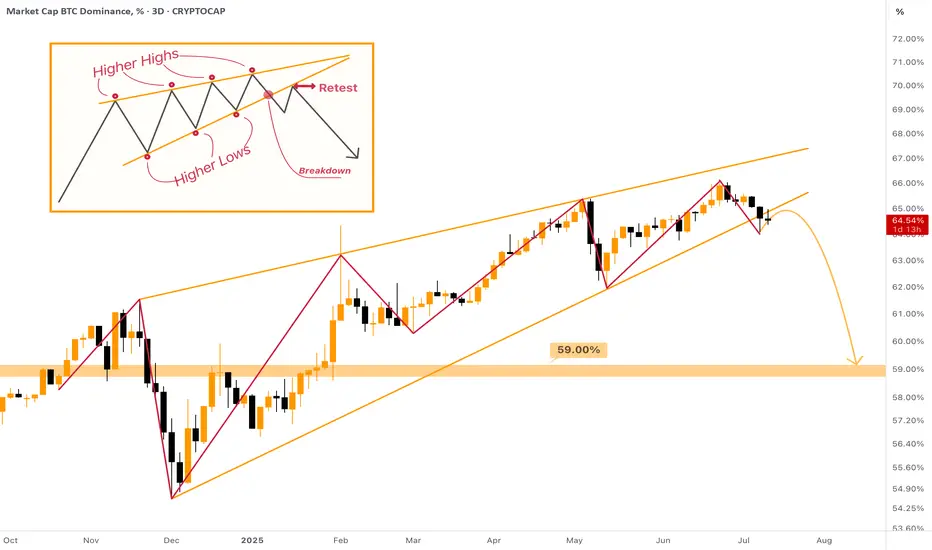
Rising Wedge on Bitcoin Dominance - [BROKEN DOWNWARDS] The MASSIVE Rising Wedge on Bitcoin Dominance was broken downwards during the past week, most likely the 1W candle will also close below the support of the wedge.
What does it mean? The dominance will dump from 64% to at least 59%. This move can already provide us with the huge Altcoin Season! After this there more likely be a small correction towards 60%, and then we can freely dump further towards 54% zone.
I expect not only small cap, but major altcoins to be sent to new highs as well. Mark my words & be prepared for the last opportunity of this bull cycle!
BTC.D Slipping ! ALTSEASON Loading ? This is BTC.D on the daily chart.
It has shown a strong relationship with the 50MA (blue/cyan line), often using it as support. While there were a couple of daily closes below it in the past, they lasted only 1 or 2 candles.
Now we’ve seen 4 consecutive daily closes below the 50MA (including today), which increases the likelihood of a deeper move to search for support.
The next key support zone (green rectangle) is defined by the 200MA (red line) and the 62.25% level (black line) — both of which acted as support before.
If BTC.D drops into that zone, ETH and altcoins could experience a strong bounce.
Always take profits and manage risk.
Interaction is welcome.

$BTC.D: Failed breakout above 66%. Was that it? Time and again we investigate the CRYPTOCAP:BTC dominance chart. In my opinion it is the most important chart in the Crypto markets. I have supported the idea that we will see CRYPTOCAP:BTC.D touch 66% in this market cycle. In my first blog on this topic on April 14th I published the idea here in Trading view.
CRYPTOCAP:BTC.D to 66%, CRYPTOCAP:TOTAL2 / BTC down to 0.43 for CRYPTOCAP:BTC.D by RabishankarBiswal — TradingView
Since April time and again we looked at this chart and since I first preached the idea of CRYPTOCAP:BTC.D to 66.2% from 63% in April we had some hiccups in the way where the Altcoins tried to claim leadership. On May 20th I indicated that the short-term blip is not consequential.
CRYPTOCAP:BTC.D : Have we seen the top or a local top in the CRYPTOCAP:BTC.D ? for CRYPTOCAP:BTC.D by RabishankarBiswal — TradingView
We reaffirmed our view on June 22nd, and we confirmed our commitment to CRYPTOCAP:BTC.D to 66%.
CRYPTOCAP:BTC weathering the storm: CRYPTOCAP:BTC.D close to 66%. CRYPTOCAP:BTC to 160K. for BITSTAMP:BTCUSD by RabishankarBiswal — TradingView
We briefly touched 66% and failed to breakout on June 27th. Now we have hit an air pocket. In my opinion this should also pass. Confirming my view of CRYPTOCAP:BTC.D to 66.2% and 160K $BTC.
Verdict: CRYPTOCAP:BTC.D will cross 66.2% before all set and done. Price performance of Altcoin can be good going from here.
Verdict: CRYPTOCAP:BTC.D will cross 66.2% before all set and done. Price performance of Altcoin can be good going from here.
TradeCityPro | Bitcoin Daily Analysis #126👋 Welcome to TradeCity Pro!
Let’s dive into the Bitcoin analysis and key crypto indices. As usual, in this analysis I’ll review the potential triggers for the New York futures session.
⏳ 1-Hour Timeframe
As you can see on the 1-Hour chart, Bitcoin started a bullish move after breaking the 111747 resistance, which continued up to 118494.
✨ Currently, the price is consolidating after reaching that resistance and has formed a range box between 116829 and 118494, fluctuating within this zone.
💥 The RSI oscillator has exited the Overbuy zone and is now near the 50 level. If it drops below 50, there is a possibility of a deeper correction.
⚡️ Confirmation of a deeper correction would come with a close below the 116829 level. The next support areas will be Fibonacci levels, which I have marked on the chart.
✔️ Since the SMA25 has reached the candles and there is no significant momentum yet, we’ll need to wait for the SMA99 to approach the price to see if momentum enters the market.
👑 BTC.D Analysis
Looking at Bitcoin Dominance, yesterday it reached the 64.18 support level and managed to bounce back, closing above 64.44.
🔔 Currently, it’s consolidating above 64.81, and if this holds, the trend could turn bullish for now.
📅 Total2 Analysis
Total2’s main resistance is at 1.33, but the price was rejected at 1.3 and is now correcting toward 1.26.
🔍 If the correction continues, the 0.382 and 0.618 Fibonacci levels would be reasonable areas to watch. If the upward move resumes, the next target will be 1.33.
📅 USDT.D Analysis
Tether Dominance has had a steep drop from 4.72 and has now reached 4.36. If support holds at this level, we could see a correction back toward Fibonacci zones.
🎲 A break below 4.36 would confirm continuation of the downtrend.

TradeCityPro | Bitcoin Daily Analysis #125👋 Welcome to TradeCity Pro!
In this Bitcoin analysis, I want to switch to a higher timeframe and analyze the daily chart because a very significant resistance has been broken and it’s important to take a closer look.
📅 Daily Timeframe
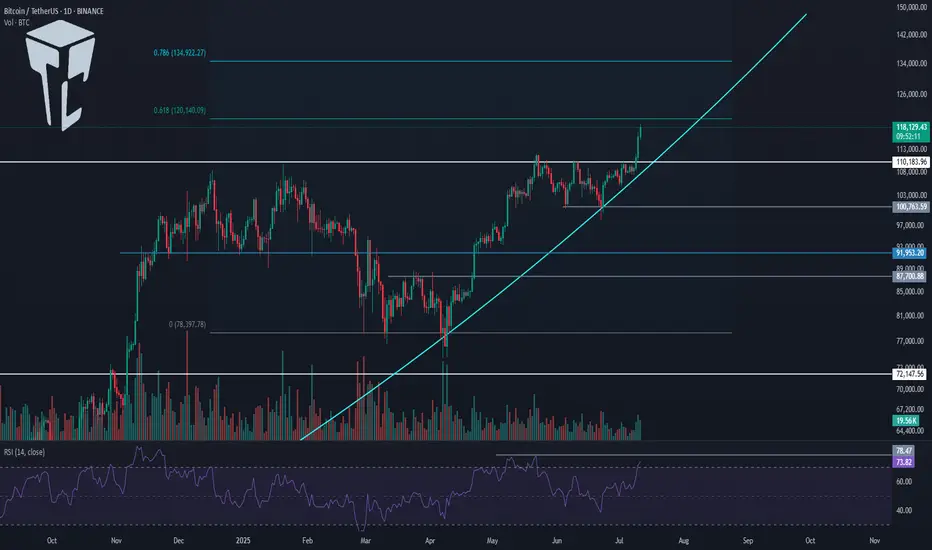
On the daily chart, as you can see, a bullish trend started around the 80000 level and in the first leg moved up to 110183. After a prolonged correction, the price has now managed to break that previous high and begin a new bullish leg.
⚡️ As shown, volume was sharply decreasing during the correction phase, but in the past few candles, significant buying volume has entered the market, enabling the price to break above 110183.
💥 The RSI oscillator is entering the Overbuy zone in today’s candle, which could be a sign of continuation of this bullish move. The next RSI resistance is around 78.47.
🎲 Meanwhile, based on Fibonacci levels, 120140 and 134922 are key zones that could mark the end of this bullish leg. The price is currently very close to 120140, and we need to watch for the market's reaction to this level.
✅ If 120140 is broken, Bitcoin will likely head toward 134922. In that case, I believe this leg could be the final bullish leg of this bull run, since I’ve previously mentioned that my target range for Bitcoin in this cycle is between 130000 and 180000.
📊 The curved trendline I’ve drawn is very important in this leg. As long as the price remains above this trendline, the market momentum will stay bullish, and the likelihood of continued upward movement increases.
🔽 If this trendline is broken, we could see the first signal of a trend reversal. A close below 110183 would confirm that the breakout was fake, and a break below 100763 would open the door for a longer-term short position.
❌ Disclaimer ❌
Trading futures is highly risky and dangerous. If you're not an expert, these triggers may not be suitable for you. You should first learn risk and capital management. You can also use the educational content from this channel.
Finally, these triggers reflect my personal opinions on price action, and the market may move completely against this analysis. So, do your own research before opening any position.
CoinMarketCap chart and correlation with BTC
Hello, traders.
If you "Follow", you can always get new information quickly.
Have a nice day today.
-------------------------------------
(USDT.D 1D chart)
USDT dominance is showing a downward trend along the medium- to long-term downtrend line.
The decline in USDT dominance can be interpreted as an upward trend in the coin market.
Therefore, if it remains below 4.91 or continues to decline, the coin market is likely to enter a bull market.
The coin market is expected to show a major bull market until 2025.
At this time, the USDT dominance is expected to fall to around 3.42 and then rise, causing the coin market to enter a bear market.
Therefore, a major bear market is expected in 2026.
-----------------------------------------------
(BTCUSDT 1M chart)
You might think that it would be good if it continued to rise in a bull market, but in reality, that is not the case.
The reason is that if the price continues to rise, you have to buy more money.
Therefore, it will show a pattern of falling when appropriate and rising again when appropriate.
As I mentioned earlier, 2025 is a major bull market, so it will eventually show a rising pattern.
So, when should we buy and when should we sell?
It would be nice if we could know this a little bit faster, but we can never know.
Currently, BTC is renewing its ATH, so it is even more difficult to predict the movement.
Therefore, we can only predict it through predictable chart analysis techniques.
Among them, the method I use is to predict and respond to the high point using the HA-Low, HA-High indicators and the DOM (DMI + OBV + MOMENTUM) indicator using the Heikin-Ashi chart.
The DOM indicator indicates the end of the high and low points, and the HA-Low and HA-High indicators are used to establish a basic trading strategy.
The sky blue (#00bcd4) arrow is generated, indicating that the DOM (60) indicator is likely to be generated soon.
In other words, it means that the end of the high point is becoming more likely.
When the DOM(60) indicator is created, there is a high possibility of resistance, so the price is likely to fall.
Therefore, you should think about a countermeasure for the decline.
However, as I mentioned earlier, since 2025 is expected to show a major uptrend, it is recommended to sell in installments at an appropriate level to preserve profits.
The reason is that we cannot know how far it will fall.
The start of a full-scale decline is likely to begin when it falls below the HA-High indicator.
Therefore, if it falls after the DOM(60) indicator is created, we should observe whether a new HA-High indicator is created.
If a new HA-High indicator is created, the key point is whether there is support in the vicinity.
If a new HA-High indicator is not created, it is likely to fall to the current HA-High indicator location of 73499.86.
-
A trend line has been formed between highs, but a trend line between lows has not yet been formed.
Therefore, it is difficult to predict how far it will fall once the decline begins.
In the 2025 bull market, BTC is expected to rise to around the Fibonacci ratio of 2.618 (133889.92).
Therefore, we should also consider countermeasures for this.
------------------------------------------------
(BTC.D 1M chart)
When will the altcoin bull market start?
I think the timing is when BTC dominance falls below 55.01 and is maintained or continues to decline.
I think the rising BTC dominance means that the funds flowing into the coin market are concentrated toward BTC.
Therefore, we should consider that a market for trading BTC has been formed.
If BTC dominance fails to fall below the 55.01-62.47 range, BTC dominance is expected to rise to around 73.63-77.07.
At this time, it is highly likely that it will encounter strong resistance and begin to decline.
Since it has not fallen below the mid- to long-term trend line, it seems likely that it will continue to rise.
In order to eventually turn into a downtrend, BTC dominance must fall below 60.
If not, I think it will be difficult to expect an uptrend in altcoins.
----------------------------------------------------------------------
(BTCUSDT 1D chart)
This period of volatility is expected to continue until July 11.
Therefore, the key issue is whether there is support near 111696.21.
If there is support at the 111696.21 point, it is expected to rise to the right Fibonacci ratio 2.24 (116940.43).
If not, we need to check whether there is support near 108316.90.
As I mentioned in the previous idea, three conditions must be met to break through the 111696.21 point upward.
- The StochRSI indicator is showing an upward trend with K>D,
- The PVT-MACD oscillator is showing an upward trend (if possible, above the 0 point),
- The OBV indicator of the Low Line ~ High Line channel is maintained above the High Line,
If the above conditions are met, I said that there is a high possibility of a stepwise upward trend from the 111696.21 point.
-
The next volatility period is expected to occur around July 18 (July 17-19).
Therefore, we need to see if it can be maintained above 111696.21 until the next volatility period.
If it fails, we need to check if it is supported above the M-Signal indicator on the 1D chart, near 108316.90.
If not, it is likely to fall to the M-Signal indicator on the 1W chart or near 99705.62.
-
The basic trading strategy is to buy near the HA-Low indicator and sell near the HA-High indicator.
However, if the HA-High indicator rises, there is a possibility of a stepwise uptrend, and if the HA-Low indicator falls, there is a possibility of a stepwise downtrend.
The end of the stepwise uptrend is a downtrend, and the end of the stepwise downtrend is an uptrend.
That is, we can see that the support around the HA-High ~ DOM(60) section and the DOM(-60) ~ HA-Low section will be important turning points for the future trend.
----------------------------------------------------
On the USDT dominance chart, it seems likely that August 3rd will be the volatility period.
Looking at the BTC chart, it seems likely that August 2nd to 5th (August 1st to 6th) will be the pre-movement for the volatility period of August 1st to 6th.
-
Thank you for reading to the end.
I hope you have a successful trade.
--------------------------------------------------
- This is an explanation of the big picture.
(3-year bull market, 1-year bear market pattern)
I will explain more details when the bear market starts.
------------------------------------------------------

BTC Dominance (BTC.D) — Weekly Failed AuctionChart Context
• Instrument: CRYPTOCAP:BTC.D
• Time-frame: 1-Week
• *Key vLevels (dashed):
• 68 % – 2021 supply pivot
• 66-68 % zone – recorded a Weekly Failed Auction (wick above, close back below)
• 62.50 % – mid-range support / prior breakout shelf
Failed Auction at the Top
Price wicked into the 66-68 % vLevel but closed lower.
On a weekly chart that pattern often marks exhaustion; bulls couldn’t maintain control.
First Support = 62.50 %
If BTC.D trades < 62.50 % and closes a weekly bar there, odds rise that capital rotates out of BTC and into alt-coins.
Historically this breakdown triggers the early stages of alt-season (see 2021 analogue).
Invalidation
Weekly close > 68 % negates the failed auction and points to renewed BTC strength (alts lag).
How I’ll trade / allocate
Spot BTC bias – overweight BTC while dominance holds > 62 %.
Alt-coin rotation – shift 20-35 % into high-conviction alts only after a confirmed weekly close < 62 % and follow-through below 60 %.
Risk checks – trim alt exposure back to cash/BTC if dominance reclaims 62 % after a breakdown (failed alt-season).

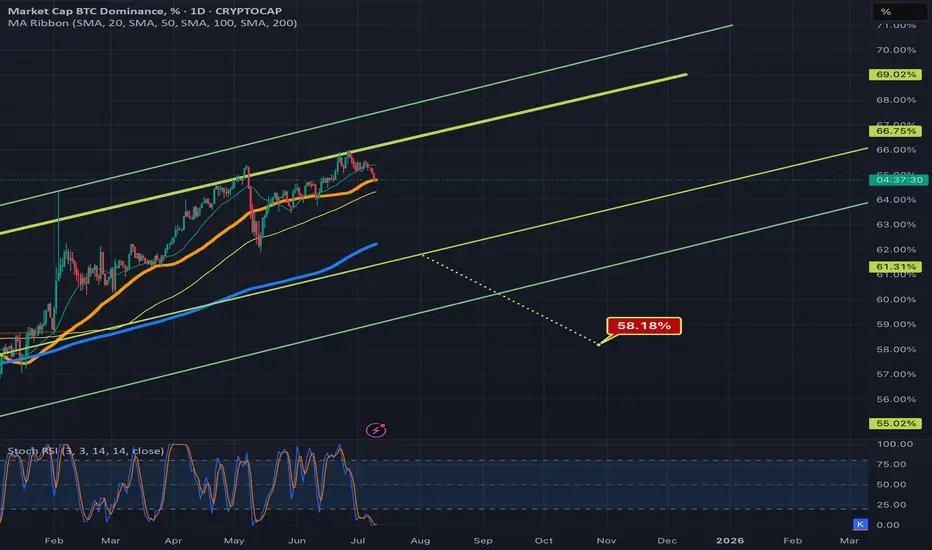
Bitcoin dominance chart ready to dump?Bitcoin dominance aka the btc.d chart has been in these 2 rising channels now for a long long tie, after ust recently being rejected down fro the top trendline of the neon yellow channel, there seems to be an opportunity here for it to potentially head down to retest the bottom trendline of that channel as well. If this occurs this could lead to an altcoin season. Price is right now combating the 50ma(in orange) and trying to maintain it as support. If this moving average flips to solidified resistance that greatly increases the chances of price going down to retest that bottom yellow trendline. Being that both of these channels are rising channels probability favors price action eventually breaking down from them instead of up so I have arbitrarily placed the measure move break down target of the yellow channel in a random spot below roughly where price could break down from the channel were it to be rejected strongly enough here by the 50ma. It’s retested this bottom trendline multiple times in the past and has always found away to avoid the breakdown thus far though so a breakdown there is definitely not guaranteed if it does retest the trendline, but even heading back down to retest the trendline in the first place may provide enough momentum for an alt season *not financial advice*
July 10th Market Outlook –Charted Waters & Uncertain Momentum🗓️📊 July 10th Market Outlook – Charted Waters & Uncertain Momentum 🌊⚠️
Today’s breakdown is a reality check for traders navigating a market full of setups but short on clarity. Resistance is stacking across the board, but that doesn’t mean we can’t break through — it just means we need to stay sharp and keep our charts close.
🔎 Highlights from the 19-minute video:
Bitcoin is approaching a third and crucial resistance test. A breakout could trigger ultra-FOMO, but failure here could send us lower.
Ethereum is in a pressure zone — the "Symplegades" setup from Greek mythology reflects today’s narrow trading path.
Bitcoin Dominance is clinging to support — if it breaks, altseason could be on. If it holds, alts may stay sidelined.
NASDAQ & Nvidia have delivered massive runs, but signs of exhaustion and reversal risk are showing.
Dollar Index (DXY) showing a Golden Cross, but unresolved rate expectations could catch markets off guard.
💬 I also speak candidly about market manipulation, being someone else’s exit liquidity, and why we might be heading toward a formative trap before any true breakout.
🎥 Watch the full video to catch all the details — from long-term setups to real-time chart reactions.
📌 Stay tuned for detailed updates today on Bitcoin, Ethereum, Bitcoin Dominance, NASDAQ and more.
One Love,
The FXPROFESSOR 💙
Disclosure: I am happy to be part of the Trade Nation's Influencer program and receive a monthly fee for using their TradingView charts in my analysis. Awesome broker, where the trader really comes first! 🌟🤝📈

Bitcoin Dominance Rebounds – Bad News for Altcoins??📊⚠️ Bitcoin Dominance Rebounds – Bad News for Altcoins? 🧨💣
Today’s chart says it clearly: Bitcoin Dominance is bouncing off support at the edge of its ascending channel. This rebound zone around 64.58–64.64% has been critical — and the move up confirms it’s holding… for now.
❗ With Bitcoin itself facing heavy resistance, this dominance bounce is not good news for altcoins. In fact, it's a classic setup for capital rotating into BTC and out of alts — not the other way around.
📌 Chart Breakdown:
Biggest alt bull runs have started when BTC.D failed here — not when it rebounded
Breakout above 71.3% = serious risk of altcoin extinction
Breakdown below 62.3% = green light for altseason
🧠 As I’ve written on the chart: the END of alts comes not just from price — but from meme culture, utility decay, and market maker manipulation. That zone? 97% BTC.D. We’re not there, but we’re not heading toward freedom yet either.
🎥 Want to see how this fits into the full market picture? Watch the July 10th macro update:
👉 July 10th Market Outlook – Uncharted Waters, Uncertain Momentum
The market’s pressure is rising.
No good news from BTC.D today.
One Love,
The FXPROFESSOR 💙
Disclosure: I am happy to be part of the Trade Nation's Influencer program and receive a monthly fee for using their TradingView charts in my analysis. Awesome broker, where the trader really comes first! 🌟🤝📈

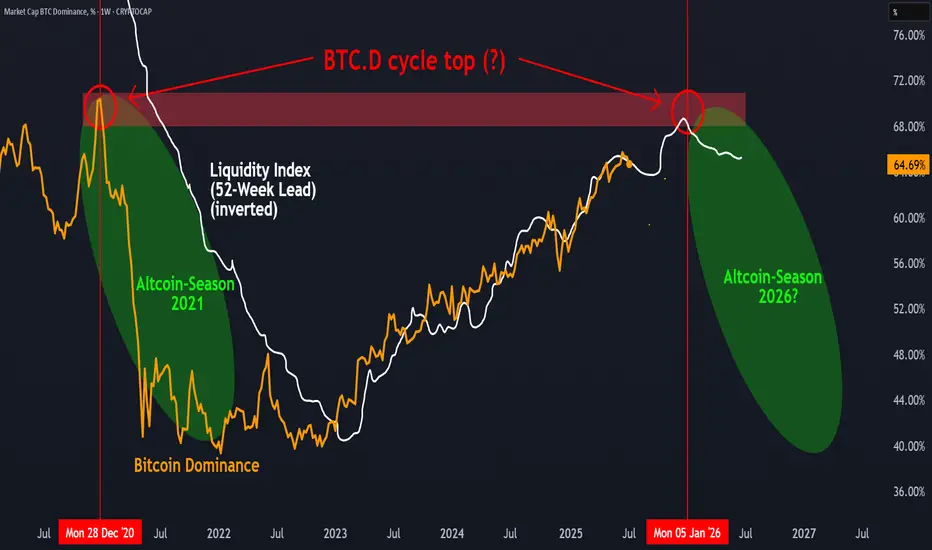
BTC.D Cycle top in?There are signs that Bitcoin Dominance (BTC.D) could be leaving a cyclical top, similar to what we saw in late 2020. When overlaid with the Global Liquidity Index (inverted and leading by 52 weeks), a potential correlation appears: previous peaks in liquidity were followed by turning points in BTC.D about a year later.
If this pattern repeats, a shift in market dynamics — possibly in favor of altcoins — could unfold over the coming year. However, this remains a hypothesis rather than a confirmed signal. The relationship between macro liquidity and crypto sector rotation is worth watching, but it’s not guaranteed to play out the same way again.
What’s your take: Altcoin Season loading or not yet?
TradeCityPro | Bitcoin Daily Analysis #124👋 Welcome to TradeCity Pro!
Let’s dive into the analysis of Bitcoin and key crypto indicators. As usual, I’ll review the futures triggers for the New York session.
⏳ 1-Hour Timeframe
On the 1-hour timeframe, as you can see, Bitcoin made a bullish move yesterday after stabilizing above the 109391 level and managed to register a new ATH around the 112000 level.
⭐ The resistance at 111747 has effectively held back further price increases, and the price has reacted to it and entered a corrective phase.
✔️ I believe the correction could continue down to 110256. The next lower support levels are 109391 and 107853.
📈 If you already have a long position open, I recommend holding it. If the 111747 resistance breaks, a strong bullish trend could begin, and having an open position from earlier could have a big positive impact on your account.
🔼 If 111747 is broken, we can consider opening new long positions. If this level breaks, I’ll post a higher timeframe analysis to identify the next major resistance levels.
💥 RSI entering the Overbuy zone and rising volume would provide strong confirmation for this position.
👑 BTC.D Analysis
Bitcoin Dominance is still dropping. Yesterday, after breaking 64.81, it continued its downward move and is now approaching the 64.49 level.
🔍 If this level breaks, the drop could continue further, but in my opinion, after the recent drop, it's time for BTC.D to enter a correction phase.
📅 Total2 Analysis
Total2 has also had a bullish move, breaking through the 1.18 and 1.2 levels, and continues to rise.
🎲 The next resistance is at 1.24, which the price may target. However, I think there’s a high chance of a correction or consolidation phase starting soon.
📅 USDT.D Analysis
Looking at Tether Dominance, after the recent drop and the break of 4.72, it reached the 4.63 level and has formed a base there.
✨ If 4.63 breaks, USDT.D could head toward 4.56. In case of a pullback, the first level to watch is 4.72.
❌ Disclaimer ❌
Trading futures is highly risky and dangerous. If you're not an expert, these triggers may not be suitable for you. You should first learn risk and capital management. You can also use the educational content from this channel.
Finally, these triggers reflect my personal opinions on price action, and the market may move completely against this analysis. So, do your own research before opening any position.

TradeCityPro | Bitcoin Daily Analysis #123👋 Welcome to TradeCity Pro!
Let’s dive into the analysis of Bitcoin and key crypto indices. As usual, in this analysis I’ll go over the trigger levels for the New York futures session.
⏳ 1-Hour Timeframe
On the 1-hour chart, as you can see, Bitcoin is currently below a resistance zone at 109135 and is approaching this level with strong bullish momentum.
⭐ If the price breaks and stabilizes above this level, we can open a long position. Both the volume and market momentum are confirming this setup well, but the main long trigger remains the breakout of 109135.
📈 If this bullish move turns out to be fake and the price starts heading downward, the first trigger we have for a short position is the 107853 level. A break below this level would give us an entry for a short.
👀 Overall, I think the market has been pretty straightforward lately, and we don’t need complex tools to analyze it. Just these support and resistance levels and simple triggers are sufficient.
👑 BTC.D Analysis
Moving on to Bitcoin Dominance, the 65.04 floor has finally broken, and dominance is now trending downward.
💫 The next support ahead is at 64.81, which the price is approaching. We’ll have to see how the market reacts to this level. For now, the trend of dominance in the 1-hour timeframe appears bearish.
📅 Total2 Analysis
Let’s look at Total2. With Bitcoin Dominance dropping and Bitcoin itself moving upward, Total2 has started a strong bullish leg and is heading toward the 1.18 level.
🔑 Many of the altcoins I’ve analyzed have triggered their entries, and as long as Total2 remains bullish, these moves can continue.
📅 USDT.D Analysis
Now to Tether Dominance. After breaking below the 4.76 level, it has now reached the 4.72 floor.
💥 A break below this floor could confirm continuation of the downtrend, but in my opinion, the price may pause here for some correction and consolidation.
❌ Disclaimer ❌
Trading futures is highly risky and dangerous. If you're not an expert, these triggers may not be suitable for you. You should first learn risk and capital management. You can also use the educational content from this channel.
Finally, these triggers reflect my personal opinions on price action, and the market may move completely against this analysis. So, do your own research before opening any position.

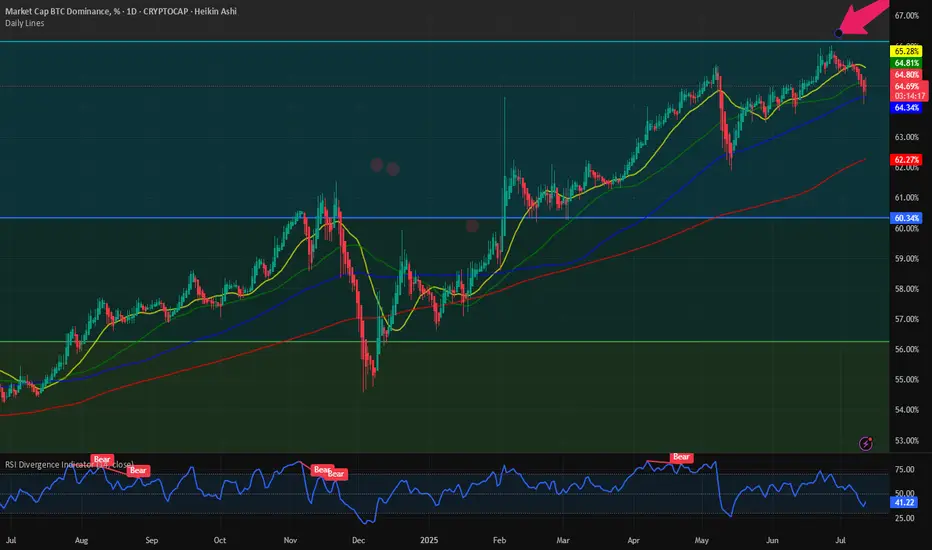
Bitcoin Dominance, RSI Bearish Divergence & Decreasing VolumeThis is a classic signal and we are going to be looking at it on two different timeframes, daily and weekly.
Bitcoin Dominance (BTC.D) is producing a strong bearish divergence with the RSI. The weekly timeframe is very pronounced and I will show you the details below. This type of signal tends to support a change of trend. It appears before the reversal happens but sometimes it can take years before it goes into effect.
» BTC.D Weekly RSI
Here you can see the RSI peaked October 2023. Then a lower high October 2024, then again in April 2025 and finally last month.
As the RSI produces lower highs BTC.D is producing higher highs.
This signal is supported by decreasing volume. Bitcoin Dominance continues to climb higher while trading volume continues to drop. Both signal support a change of trend soon and together they become stronger.
» BTC.D Daily RSI
The daily RSI peaked June 2023 but we will focus on the short-term as we already have a strong signal coming from the weekly.
Here we have a peak in May 2025 and a strong lower high in June. Needless to say, BTC.D peaked 27-June thus the divergence but the action is clearly weak.
» Bitcoin daily
There is a long-term rising wedge on the weekly timeframe and this pattern can also support a reversal.
All these signals are bearish but not very strong, still, there is some weakness on the bearish side for this index. This means that the action can turn bearish tomorrow or it can continue rising for weeks or months before turning red.
These signals are pointing to a reversal but they do not give us a specific date. Can happen next week, next month or in seven months. If we focus on the altcoins, the way they are looking and how long will it take for them to grow, then this index can turn bearish within 2-4 weeks. Bitcoin will also grow as the altcoins market grow. Everything Crypto will grow in late 2025.
Thanks a lot for your continued support.
Namaste.

Bitcoin Dominance Daily Bullish Altcoins ConfirmedThere is an interesting signal here on the daily Bitcoin Dominance index chart. Four days red. This signal has not happen since February and it is most certainly bearish.
After 26-June the index went red four days after hitting the highest reading since January 2021. This highest reading ended up producing a rounded top and the action moved back below the 7-May top which was the previous highest reading since 2021.
Now notice the purple line on the chart. This is the 7-May peak price. Yesterday, BTC.D was trading above this level but moved below today. The candle ended as a Doji, lower high and today turning bearish signals growing bearish momentum.
You can check the weekly timeframe for additional signals including the MACD and RSI. You can find it by visiting my profile @MasterAnanda (Make sure to follow.)
In November 2024 BTC.D went extremely bearish and the entire altcoins market produced a major advance; Bitcoin also moved forward, the same can happen today. It is not certain the specific date, can be tomorrow, in a weeks time or within months... What is certain is that the bullish wave won't last as little as in April-May 2025 nor November-December 2024, both instances lasted only one month, this time around the bullish wave can last between 3-6 months.
Some pairs will grow straight up for months. Others will experience strong volatility but with a bullish bias. Marketwide bullish action. Bitcoin and the altcoins.
Thank you for reading.
Namaste.

BTC Dominance Nearing Breaking Point – What It Means for Alts🚨📈 BTC Dominance Nearing Breaking Point – What It Means for Alts ⚠️🧩
Bitcoin Dominance (BTC.D) is climbing — and fast. As of now, we're at 64.13% , officially in the “ Bad for Alts ” zone. Historically, this level has meant one thing for altcoins: trouble ahead . But what if we go further?
🔵 The chart tells the full story:
Above 73% dominance, we're not just bad — it's disaster territory for altcoins.
The biggest alt bull runs in history started when BTC dominance reversed from these high levels .
But now? We're riding a rising channel with no sign of slowing, and a potential peak at 71.34% could be next.
📉 If dominance hits that upper wedge, altcoins may face an extinction-level drawdown — especially if meme coins, scams, and greedy behavior continue to dominate the space.
🧠 As the chart says:
“The END of Alts would be back here…” (not a valid scenario in my opinion but it exists)
Unless fundamentals and real utility make a comeback, we may be heading for a cleansing phase — where only the strongest survive . And that's Bitcoin only.
🔎 Key Zones:
>73% = 🚫 Disaster for Alts
64–73% = ❌ Bad for Alts
54–62% = ⚖️ Neutral / Good for select alts
<45% = ✅ Historically Great for Altcoins
💬 What do you think? Is this a final dominance pump before reversal? Or are we witnessing the long-awaited re-centralization of crypto around BTC?
One Love,
The FXPROFESSOR 💙
