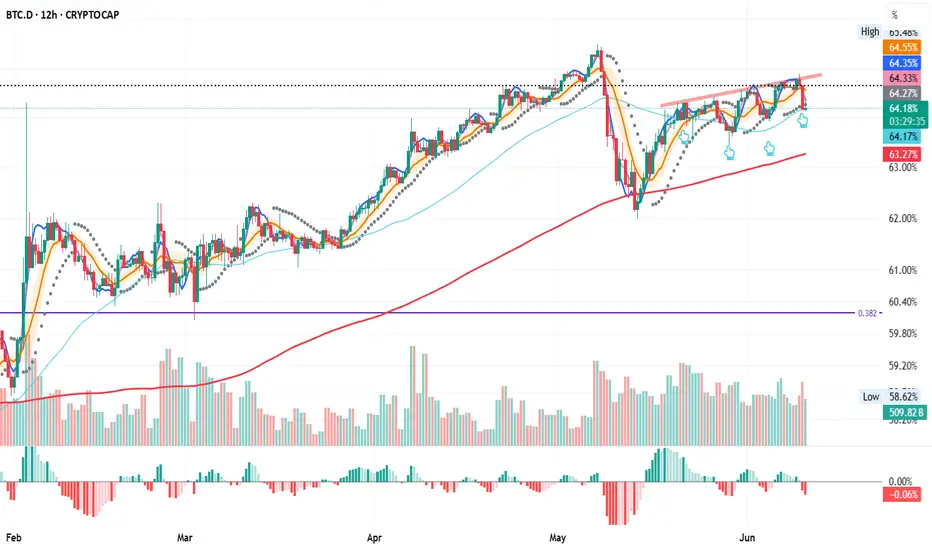
Bitcoin Dominance Will Drop To 60% SoonGood Morning Trading Family,
I really don't have much to say on this post. My last post on Ethereum showed us an inverse head and shoulders pattern, which plays out over 85% of the time. This is a clear sign that altcoins may rally within the next week or two. And here, on our Bitcoin dominance chart, you can see that the patterns are clear, BTC dom cannot last at this level much longer before a breakdown to 61% or lower occurs. Be prepared. FOMO will get real.
Best,
Stew
Btcdominance

TradeCityPro | Bitcoin Daily Analysis #114👋 Welcome to TradeCity Pro!
Let’s go over Bitcoin analysis and the key crypto indexes. As usual, I’ll break down the futures triggers for the New York session.
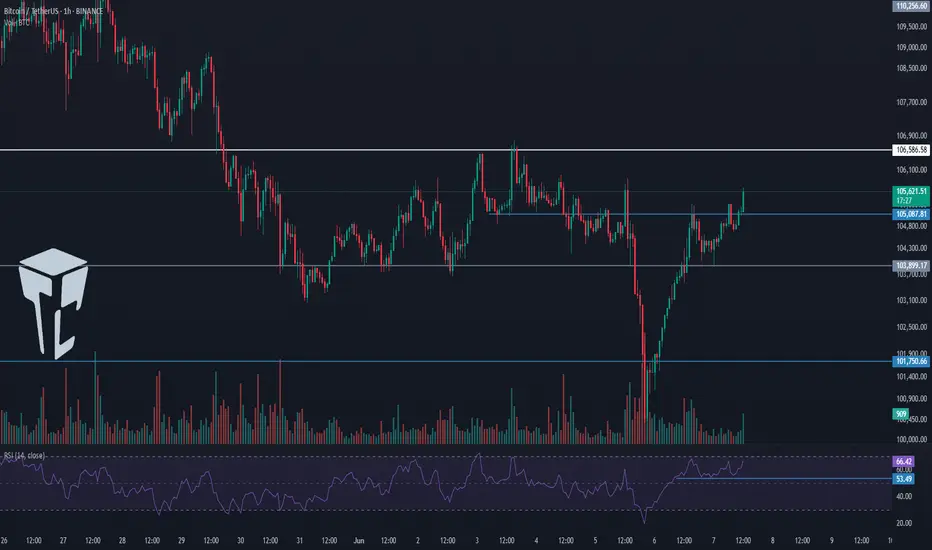
⏳ 1-Hour Timeframe
On the one hour timeframe, as you can see, a trading range has formed between the levels of 108617 and 110256. This has happened after a strong upward move with significant buying volume, and now we’re in a market correction phase.
📊 Market volume is decreasing during this corrective phase, which shows the strength of the buyers and supports the ongoing uptrend. RSI has exited the Overbuy zone and is now cooling off, which indicates that the bullish momentum has weakened for now.
📈 For a long position, the 110256 trigger seems very suitable today. If the price forms a higher low above 108617 before breaking this level, the probability of breaking 110256 increases significantly.
💥 If this trigger is activated, it’s crucial that volume rises as well. That would confirm the strength of the trend and increase the chances of the uptrend continuing. The current target for this position is 111747.
🔽 In the correction scenario, if the price stabilizes below 108617, this scenario becomes more likely and a deeper correction could follow.
✨ Personally, I won’t open a short position unless we get confirmation of a trend reversal. But if you want to go short, a break below 108617 is not a bad option and could signal a downward move.
👑 BTC.D Analysis
Bitcoin dominance has continued its downward movement, stabilized below 64.12, and is now heading toward 63.93.
⭐ If the 63.93 low is broken, the bearish move in dominance will likely continue. If it pulls back, a break above 64.12 will confirm that retracement.
📅 Total2 Analysis
Let’s look at Total2. Yesterday, it broke through the 1.2 level and is now moving toward 1.24. A breakout above this level could start the next bullish leg.
🎲 If a correction occurs, the price may drop back to 1.2 or even 1.18.
📅 USDT.D Analysis
Now for Tether dominance. This index is still sitting at the 4.56 support and is currently being held there. If 4.56 breaks, the next bearish leg can form.
🔔 In case of a retracement, USDT dominance might rise to 4.64.
❌ Disclaimer ❌
Trading futures is highly risky and dangerous. If you're not an expert, these triggers may not be suitable for you. You should first learn risk and capital management. You can also use the educational content from this channel.
Finally, these triggers reflect my personal opinions on price action, and the market may move completely against this analysis. So, do your own research before opening any position.

Bitcoin Dominance Update – Key Levels in Play!Hey Traders!
If you’re finding value in this analysis, smash that 👍 and hit Follow for high-accuracy trade setups that actually deliver!
BTC Dominance is testing a major resistance zone after a sustained rally from late 2024. The structure is showing signs of exhaustion near the 64-65% zone.
🔶 Pattern: Rising wedge breakdown
🔶 Current Action: Retesting broken support zone as resistance
🔶 Key Resistance: 64.5% - 65%
🔶 Rejection zone: Strong supply sitting overhead
Why this matters for Altcoins:
A rejection from this zone could open the door for capital rotation into altcoins.
BTC dominance stalling = potential for ETH, SOL, and midcaps to gain momentum.
If dominance goes down, it may keep altcoin rallies capped for now.
Monitor closely — dominance breakdowns often align with altseason rotations.
💡 Stay patient, stay prepared.

BTC.D – Repeat or Reset?
BTC.D (Bitcoin dominance) on the 12H chart is now testing the 50MA for the fourth time.
The last three touches led to a bounce toward the triple top trendline.
Will it play out the same way again, or will the 200MA need to step in as support?
Let’s watch it unfold together.
TradeCityPro | Bitcoin Daily Analysis #113👋 Welcome to TradeCity Pro
Let’s dive into the Bitcoin analysis and key crypto indexes. As usual in this analysis, I’ll walk you through the futures triggers for the New York session.
⏳ 1-Hour Timeframe
As you can see in the one hour timeframe, Bitcoin has continued its upward movement and reached the 110256 level and is now undergoing a correction.
✔️ If the price continues correcting, the next support level will be 108777. In case of a deeper pullback, the next area to watch is 106586.
📈 For a long position, our first trigger level is 110256, with a target of 111747.
📊 Market volume is currently increasing, and if this inflow of buy volume continues, the probability of a bullish move increases.
💥 The RSI oscillator has dropped below the 70 level. If RSI reenters the overbought zone, we’ll also get a strong momentum confirmation.
👑 BTC.D Analysis
Let’s take a look at Bitcoin Dominance. Today, it finally closed below the 64.49 level and has dropped to 64.12.
⚡️ This drop has allowed capital to flow into altcoins, and many of them are moving upward today. If 64.12 breaks, the downtrend may continue.
📅 Total2 Analysis
Moving on to Total2, this index finally broke above the 1.21 level and is now heading toward 1.24.
💫 At the moment, there is no major resistance preventing the market from continuing its upward trend. But there’s an important point regarding USDT Dominance, which I’ll cover below.
📅 USDT.D Analysis
During this bullish move in the market, the dominance of Tether hit the support at 4.56, while other indexes and most altcoins activated their triggers.
🔑 The key point here is that Tether Dominance has such a significant influence on the market that the inability to break this support has caused the entire market, including Bitcoin, to start correcting.
🔽 The 4.56 level in USDT Dominance is very important and will be the key to triggering the next bullish leg.
❌ Disclaimer ❌
Trading futures is highly risky and dangerous. If you're not an expert, these triggers may not be suitable for you. You should first learn risk and capital management. You can also use the educational content from this channel.
Finally, these triggers reflect my personal opinions on price action, and the market may move completely against this analysis. So, do your own research before opening any position.

TradeCityPro | Bitcoin Daily Analysis #112👋 Welcome to TradeCity Pro
Let’s dive into the analysis of Bitcoin and key crypto indexes. As usual, in this analysis I’ll review the futures triggers for the New York session.
⏳ 1-Hour Timeframe
Yesterday, Bitcoin finally broke through the resistance zone it had formed. As you can see, it pushed through this level with strong buying volume and is now moving toward 108777.
🔍 If you entered a position using yesterday’s triggers, I’d be glad to hear about it in the comments. Your feedback gives me great energy.
⭐ Today, I cannot provide a specific trigger because the market has already made its move. If you do not have an open position, it is better to wait for a new market structure and then identify a fresh trigger.
💥 At the moment, I expect Bitcoin’s upward movement to continue toward 108777. Market volume is strongly supporting the trend and is aligned with price action. RSI is also in the overbought zone, indicating strong buyer presence. If RSI stays above 70, the sharp upward movement is likely to continue.
📊 If a market correction occurs, the price could pull back to the zone I marked. In future analyses, I will review triggers for both trend continuation and possible reversals.
👑 BTC.D Analysis
Bitcoin dominance formed a higher low above 6449 and has now broken the 6467 resistance, signaling the beginning of a new bullish leg.
⚡️ If this upward move continues, Bitcoin dominance may climb further. However, if a pullback to 6467 happens, altcoins could see a strong upward move as well.
📅 Total2 Analysis
Looking at Total2, this index was supported at 114 yesterday and is now moving toward 117.
📈 If Bitcoin dominance starts to drop, Total2 will likely break above 117 and begin a main bullish trend.
📅 USDT.D Analysis
Now for Tether dominance. After forming a lower high below 479, it broke below the 472 support and is now heading toward 464.
✅ In my view, this movement toward 464 is likely to continue, and as that happens, the overall crypto market is expected to keep moving upward.
❌ Disclaimer ❌
Trading futures is highly risky and dangerous. If you're not an expert, these triggers may not be suitable for you. You should first learn risk and capital management. You can also use the educational content from this channel.
Finally, these triggers reflect my personal opinions on price action, and the market may move completely against this analysis. So, do your own research before opening any position.

BTC / USD 1hr 110K INC!BTC/USD – 1H Chart Analysis
📝 Trend Overview:
BTC is showing signs of a bullish reversal, forming higher highs and higher lows, supported by the broadening bottom pattern. This formation often signals accumulation and precedes breakout moves. The market has now bounced three times from the demand zone, reinforcing its validity as a strong support.
📍 Key Technical Zones:
Demand Zone:
103,201.46 – 104,197.07
Price has tested this zone multiple times and bounced, indicating strong buying interest.
☑️ Supply Zone:
110,098.80 – 111,330.54
Significant historical resistance. If BTC reaches this zone, expect strong selling pressure.
📥 Fair Value Gaps (FVGs):
1H FVG: 105,746.93 – 106,157.49
Aligned with the Fibonacci Golden Pocket (0.618–0.786) retracement, increasing confluence.
4H FVG: 107,337.85 – 107,738.15
Key level for potential breakout or rejection.
✅ Targets:
TP1: 1H FVG zone (~106k)
TP2: 4H FVG zone (~107.5k)
TP3: Supply zone (~110k–111k)
❌ Invalidation:
Break and close below the demand zone would invalidate the bullish bias short term.
📊 Volume Profile & OBV:
Volume Profile (Right Side):
High activity zones between 105k–107k show areas of interest for both bulls and bears.
📊 OBV (On-Balance Volume):
Currently consolidating, which suggests accumulation and potential for a breakout once volume picks up.
🧠 Summary:
BTC has regained bullish momentum following multiple rejections from the demand zone and the formation of a broadening bottom. If the price confirms a higher low at or above 104,925, expect a move towards the 106k and possibly the 110k region. Monitor price action at the FVGs for reactions and profit-taking opportunities.
(NOTE: This is a spot trade - Leverage at your own risk and research)

TradeCityPro | Bitcoin Daily Analysis #111👋 Welcome to TradeCity Pro!
Let’s take a look at Bitcoin and key crypto indicators. As usual in this analysis, I’ll review the futures triggers for the New York session.
⏳ 1-Hour Timeframe
As you can see in the 1-hour timeframe, none of our triggers were activated yesterday and Bitcoin has been ranging.
⭐ There was an important RSI level at 53.49, which was tested multiple times. I mentioned that breaking this level could trigger a slight correction — and that’s exactly what happened. The price pulled back slightly to 105087, retested this zone, and now RSI has returned above 53.49. Price is also moving with strong bullish momentum toward the 105851 resistance.
📊 The buying volume entering the market is quite strong, and if this increase continues, the price could begin an upward move. So in terms of both momentum and volume, we have bullish confirmation and can enter a position if the triggers activate.
📈 For a long position, the trigger we’re watching is 105851. While the main resistance is at 106586, I prefer to take the risk and open the position earlier, because I think the 106586 break won’t provide a clean entry and would be harder to act on.
✨ So my chosen trigger for a long position is 105851. Given the rising volume and high RSI momentum, we have the confirmations needed to open this trade.
🔽 For a short position, the first trigger is the break of 105087. This is a risky position since we haven’t yet confirmed a trend reversal — this would be the first signal if a downtrend begins. Personally, I’ll wait for confirmation of bearish momentum before opening a short.
👑 BTC.D Analysis
Bitcoin Dominance is still below the 64.67 level and is ranging under this resistance.
🧩 A break above 64.67 would confirm a bullish move in dominance. A break below 64.49 would signal a bearish reversal.
📅 Total2 Analysis
Total2 is ranging below the 1.15 level. A break above this zone could initiate a bullish move.
🔔 On the bearish side, the current trigger is the 1.13 level. We need to wait for this level to be broken for a trend reversal confirmation.
📅 USDT.D Analysis
Tether Dominance stabilized below the 4.79 zone yesterday and has now pulled back to it, preparing for a possible second leg downward.
🔑 If that happens, the crypto market could move upward. However, if USDT.D rises back above 4.79, its uptrend could continue.
❌ Disclaimer ❌
Trading futures is highly risky and dangerous. If you're not an expert, these triggers may not be suitable for you. You should first learn risk and capital management. You can also use the educational content from this channel.
Finally, these triggers reflect my personal opinions on price action, and the market may move completely against this analysis. So, do your own research before opening any position.

TradeCityPro | Bitcoin Daily Analysis #110👋 Welcome to TradeCity Pro!
Let’s dive into the Bitcoin analysis and major crypto indexes. In this review, as usual, I’ll cover the key futures triggers for the New York session.
⏳ 1-Hour Timeframe
As you can see in the 1-hour timeframe, Bitcoin formed a higher low yesterday and has now reached the 105087 resistance. It seems likely that this level will be broken soon.
✨ Currently, a candle has closed above 105087, but price hasn’t yet confirmed a breakout, and the move hasn’t taken off.
📈 For a long position, we can enter once the price confirms a breakout above this level. If 105087 breaks, price could target 106586. The main long position will be opened upon breaking 106586.
🛒 Strong buying volume is a very good trigger for this setup. RSI entering the Overbought zone would also provide a powerful momentum confirmation, and price could rise accordingly.
💥 If the current upward move fails and price falls below the recent low, we can open a short position upon breaking 103899, targeting 101750.
⚡️ The 53.49 level on RSI is critical — its break would serve as a strong confirmation for the short position.
👑 BTC.D Analysis
Looking at Bitcoin Dominance, yesterday it once again moved toward 64.67, but failed to break it and is now heading downward after being rejected from that resistance.
🔑 The trigger for bullish continuation remains 64.67, while 64.49 serves as the trigger for a bearish move.
📅 Total2 Analysis
This index formed a higher low at 1.13 yesterday and is now testing the 1.15 resistance. If this level breaks, the price could head toward 1.17 and 1.18.
📊 A break above 1.15 would be a valid long trigger. However, if price is rejected and moves downward, breaking 1.13 could send it back toward 1.1.
📅 USDT.D Analysis
USDT Dominance closed below the 4.79 level yesterday and is now moving toward 4.70. If this continues, the crypto market could see bullish momentum.
🧩 However, if dominance moves back above 4.9, the next bullish leg in USDT.D could begin.
❌ Disclaimer ❌
Trading futures is highly risky and dangerous. If you're not an expert, these triggers may not be suitable for you. You should first learn risk and capital management. You can also use the educational content from this channel.
Finally, these triggers reflect my personal opinions on price action, and the market may move completely against this analysis. So, do your own research before opening any position.
TradeCityPro | Bitcoin Daily Analysis #109👋 Welcome to TradeCity Pro!
Let’s dive into the Bitcoin analysis and key crypto indicators. As usual, I’ll walk you through the futures triggers for the New York session.
⏳ 1-Hour Timeframe
In the 1-hour chart, as you can see, yesterday Bitcoin activated the short trigger at 103899 and dropped below the 101750 level. This setup gave an opportunity to open a short position—hopefully you took advantage of it.
✨ After that bearish leg, the downtrend ended and the price began to rise again, now reaching back to the 103899 level.
🔍 If the price gets rejected once from 103899 and then forms a higher low compared to 101750, we can consider a long position on subsequent attempts—if 103899 breaks. If the price breaks this level sharply, the next long triggers will be 105087 and 106586.
📉 For today's short position, we can enter on a pullback to 103899. Personally, I’ll look for a bearish trigger in lower timeframes; if confirmed, I’ll open a short. The main bearish trigger remains the break of 101750.
📊 Currently, volume favors buyers, but we’ve seen divergence during this bullish leg, and volume increased on the last bearish move. So, I still see a higher probability of the market turning bearish rather than bullish.
👑 BTC.D Analysis
Looking at Bitcoin dominance, yesterday it made an upward move to 64.67 after breaking through 64.23. This 64.67 level is a strong resistance, and as shown, the dominance got rejected there.
💫 If this rejection is confirmed, there's a high chance of a retracement back to 64.23. In that case, if the market continues to drop, Bitcoin will likely be a better short than altcoins.
☘️ However, if 64.67 breaks, dominance could initiate another bullish wave.
📅 Total2 Analysis
As for Total2, after activating the 1.16 and 1.13 triggers, it dropped to the 1.1 zone and is now making a pullback to its previous support—similar to Bitcoin.
💥 For a long position, we’ll need a Dow Theory confirmation. For a short, we can wait for a pullback to 1.13 and look for a bearish confirmation to enter.
📅 USDT.D Analysis
Now onto Tether dominance: yesterday, after breaking 4.79, it moved up to 4.98. Following that, it reversed and is now back down to 4.79.
🔑 If 4.79 breaks, Tether dominance could drop further to 4.70 and 4.64. But if it holds and finds support there, another bullish leg may begin.
❌ Disclaimer ❌
Trading futures is highly risky and dangerous. If you're not an expert, these triggers may not be suitable for you. You should first learn risk and capital management. You can also use the educational content from this channel.
Finally, these triggers reflect my personal opinions on price action, and the market may move completely against this analysis. So, do your own research before opening any position.

BTC Dominance New Update (12H)We are truly at a critical point for Bitcoin dominance.
It’s possible that the main drop in Bitcoin dominance has already begun. If the green zone is lost, dominance could experience a deep decline, especially since the final wave of this diametric pattern | wave G | has touched the 0.618 Fibonacci level.
That said, there’s still a chance that the green zone might once again push the price near the previous high before we witness the drop in dominance. However, there are also signs suggesting that the main drop may have already started. Follow the chart closely and monitor it with precision.
For risk management, please don't forget stop loss and capital management
Comment if you have any questions
Thank You

TradeCityPro | Bitcoin Daily Analysis #108👋 Welcome to TradeCity Pro!
Let’s dive into the analysis of Bitcoin and key crypto indices. As usual, in this analysis, I’ll review the futures session triggers for New York.
⏳ 1-Hour Timeframe
As you can see in the 1-hour timeframe, yesterday the 105087 trigger was activated, and now after a pullback to that level, the price is heading toward the 103899 support.
💥 If you entered a short position based on the 105087 trigger, you can hold it until 103899. If you haven’t opened a position yet, you can consider today’s triggers.
🔽 The first short trigger for today is the 103899 level. A break below this level can start a major bearish move. Personally, I’ll enter a short if this level breaks.
⚡️ Breaking below 38.95 on the RSI will give us a suitable momentum confirmation. If selling volume increases, the probability of a bearish move will rise.
📈 For long positions, our first trigger is the same 105087 level. If a higher low is formed compared to 103899 and this level breaks, it will provide a good long opportunity.
💫 The main long trigger is 106586. If this level is broken, the uptrend can resume and price could move toward higher resistance levels.
👑 BTC.D Analysis
Looking at Bitcoin Dominance, a range box has formed between 63.93 and 64.23.
✨ A break above 64.23 confirms bullish continuation, while a break below 63.93 confirms a bearish trend in dominance.
📅 Total2 Analysis
Moving to Total2, yesterday it closed below 1.17, and now after a pullback, it's heading toward 1.16.
✅ If 1.16 breaks, a short position can be opened. If the downward move turns out to be fake, a break above 1.18 gives us a long trigger.
📅 USDT.D Analysis
Looking at Tether Dominance, yesterday it confirmed above 4.70 and is now moving toward 4.79. A break of 4.79 could signal a continuation of the upward move.
📊 If it closes back below 4.70, the price could move toward 4.64. A break below 4.64 would signal a bearish trend in USDT dominance.
❌ Disclaimer ❌
Trading futures is highly risky and dangerous. If you're not an expert, these triggers may not be suitable for you. You should first learn risk and capital management. You can also use the educational content from this channel.
Finally, these triggers reflect my personal opinions on price action, and the market may move completely against this analysis. So, do your own research before opening any position.

TradeCityPro | Bitcoin Daily Analysis #107👋 Welcome to TradeCity Pro!
Let’s dive into Bitcoin and key crypto indices. As usual, in this analysis I’ll walk you through the triggers for the New York futures session.
⏳ 1-Hour Timeframe
As you can see in the 1-hour timeframe, yesterday the price made another upward move and formed its resistance at the 106586 level and a bottom at 105087.
📈 For a long position, considering the uptrend in higher timeframes such as the daily and weekly, we can enter upon a breakout of 106586. A bounce of the RSI from the 50 level can act as a good confirmation for the position.
📊 Buying volume is currently increasing, but the price is still sitting on the support bottom and hasn’t moved upward yet. If this volume inflow continues, a breakout of 106586 would be a strong confirmation for a long position.
🔽 For a short position, the first trigger is the breakdown of the 105087 bottom. If this level is broken, we can enter a short. The main short trigger is at 103899.
💥 Conditions are currently favorable for a short position, and the current candle has strong bearish momentum. So, if 105087 breaks, a short position would be appropriate.
👑 BTC.D Analysis
Let’s look at Bitcoin Dominance. After a pullback to the 64.23 level, the next bearish leg continued to 63.93. If 63.93 breaks, the downtrend is likely to continue and the price could fall to 63.50.
✅ If 63.93 holds, dominance may start moving back up toward 64.67.
📅 Total2 Analysis
Now let’s check out Total2. This index is still below the 1.18 level, and breaking this level would confirm a bullish move.
✨ A new bottom has also formed at 1.17. If this level breaks, we can look for a short position.
📅 USDT.D Analysis
Now to Tether Dominance. This index has formed a box between 4.64 and 4.70.
🔔 A breakout above 4.70 could initiate a bullish move in dominance, while a breakdown below 4.64 could trigger a bearish move.
❌ Disclaimer ❌
Trading futures is highly risky and dangerous. If you're not an expert, these triggers may not be suitable for you. You should first learn risk and capital management. You can also use the educational content from this channel.
Finally, these triggers reflect my personal opinions on price action, and the market may move completely against this analysis. So, do your own research before opening any position.

TradeCityPro | Bitcoin Daily Analysis #106👋 Welcome to TradeCity Pro!
Let’s dive into Bitcoin and the key crypto indices. As usual, I’ll be reviewing the futures triggers for the New York session.
⏳ 1-Hour Timeframe
On the 1-hour chart, the 105800 trigger was activated yesterday and Bitcoin’s trendline was broken. However, the price failed to hold above 105800 and quickly fell back below, making it a fake breakout.
⚡️ For now, I’m keeping the 105800 level as the long trigger to observe how the price reacts. We need to wait for a clear reaction to this zone to better refine the trendline. On the next test, if it breaks successfully, we can enter a long position.
🔍 If a higher low forms above 103899 and the RSI finds support above 50, the likelihood of breaking the 105800 resistance increases, potentially leading to a stronger upward move.
✨ On the short side, since the 105800 breakout failed, bearish momentum could increase. A breakdown below 103899 would trigger a short position with a target at 10750.
If you’ve already opened a short position before this trigger, be aware that it's a risky trade and shouldn’t be relied on as a long-term position.
👑 BTC.D Analysis
The downtrend in Bitcoin dominance has continued following the breakdown of 64.29, and now it has also broken below 64.15, heading toward 63.87.
⭐ For now, BTC dominance is temporarily bearish. If the market corrects, Bitcoin might fall harder, but if the market recovers, altcoins could perform better — unless BTC dominance reverses trend.
📅 Total2 Analysis
Yesterday, the long trigger at 1.16 was activated, and now the index has reached 1.18. Thanks to falling Bitcoin dominance, altcoins have outperformed Bitcoin.
✔️ If 1.18 breaks, the uptrend could continue. Key levels to watch next are 1.21 and 1.24.
📅 USDT.D Analysis
This index formed a lower high below 4.79 yesterday and is now retesting 4.70 after breaking below it.
🎲 If this pullback gets rejected, it confirms weakness in USDT dominance — which supports long positions on altcoins. However, if USDT.D climbs back above 4.70 and it turns into a fake breakdown, there’s a strong chance it could revisit 4.79 or even break that resistance.
❌ Disclaimer ❌
Trading futures is highly risky and dangerous. If you're not an expert, these triggers may not be suitable for you. You should first learn risk and capital management. You can also use the educational content from this channel.
Finally, these triggers reflect my personal opinions on price action, and the market may move completely against this analysis. So, do your own research before opening any position.

Bitcoin Dominance, BTC ATH and ALT Seasons since 2017-some facts
There is little doubt now, that this Crypto cycle is very different from previous cycles and the main reason for this is the Bitcoin Dominance ( BTC.D) of the Market.
The reasons for this Dominance is complicated but we can certainly point towards the arrival of ETF's as one of the principle factors.
Corporations simply Buy Bitcoin, Hold it and Trade the ETF's - The Key Principle here being that the Coins are HELD Long term.
As we can see from the main chart, we have a key point in the BTC cycle called the Bitcoin Halving. To many extents, the explanation of this is not relevant right now.
But what you can see is how, previously, after the BTC Halving, we saw a drop in BTC.D,
This was due to the money Flow out of BTC and into ALT coins.
As more ALT coins were bought up, the demand drove the price higher and so their dominance increased, driving BTC.D down
This has not happened this cycle due to bulk buying of BTC for ETF's and BTC being Held Long term.
We can also see how , as we approached a certain time span After the Halving, we saw a sharp rise in BTC.D as we headed towards the next BTC ATH as the BTC buying picked up.
Again, this is not happening this cycle as the Bitcoins are being held long term.
What we can also see on the main chart is how we would normally be approaching a period of expected BTC ATH ( green vertical box )
And the HUGE question is, Will we get a Bitcoin ATH in this period ?
This is, to many extents, impossible to answer but as demand for Bitcoin continues and coins become harder to find, the price should continue to rise.
The tricky bit is, now, with a Bitcoin costing over 100K usd, it becomes harder to move the price. Only Corporations can afford to bulk buy.
So, again, things are different.. Retail is struggling to find a foot hold in the Bitcoin market, seeming to think that a Bitcoin is too expensive for them.....forgetting that they can buy a bit and that will also increase in price by the same %.
And so they look to the ALTs, fast volatile price rises and high returns,
This is seen very clearly in this chart that shows us when we had previous ALT seasons after the Halving
See how, after a period of time after Halving, the ALT Seasons appeared when the BTC.D dropped.
And that has simply just NOT happened this time.
It has to be said, it did try to appear. ALT season tried to happen.
See how after 210 days after halving this cycle, BTC.D did drop sharply but, it found a line of support and bounced back, Killing the ALT season dead in its tracks
There have been a lot of attempts since but the Market has been Bloody for ALTS, with sharp rise and Falls destroying confidence..... And Bitcoin continues to Rise.
So, where are we now ?
This Daily BTC.D chart may offer some ideas
BTC.D PA is currently at TOP of long Term range and finding it hard to get over that line of resistance.
BTC.D Weekly MACD , while not overbought, is curling over Bearish
BTC ATH's have previously been attained from Oversold areas as MACD Rose back higher.
The Volatility has gone and MACD is ranging smooth
SO, in conclusion, it is anybodies Guess right now if we will ever see an ALT season again.
Technically, on many fronts, we are poised, ready for it, even if it is a mini one.
But as we have seen on many occasions this cycle, Bitcoin is a very desired asset now and Demand drives price.....and so the Sell off that we need to drive an Alt season just may not occur.
One thing that is Absolutely certain though, we are highly likely to see another Bitcoin ATH
Stay safe everyone and Love one another. It is Free to do and is worth more than anything

TradeCityPro | Bitcoin Daily Analysis #105👋 Welcome to TradeCity Pro!
Let’s dive into Bitcoin and key crypto indices. As usual, in this analysis, I’ll walk you through the triggers for the New York futures session.
⏳ 1-Hour Timeframe
On the 1-hour chart, as you can see, Bitcoin’s correction phase began after the breakdown of the 107010 level. Currently, after pulling back to the 105673 area, it seems ready to begin its next corrective leg.
✔️ One of the reasons Bitcoin has moved downward over the past few days is the escalation of war between Ukraine and Russia. As the conflict intensified, risk assets like Bitcoin dropped while safe-haven assets like gold surged.
🔍 Currently, price action is forming an expanding triangle and is trending downward. It was recently rejected from the triangle’s top and is now sitting on a key support at 103899.
💥 If 103899 breaks, a short position targeting 101750 could be triggered. Selling volume has increased significantly, confirming bearish momentum, so opening a short upon a break of 103899 appears logical. However, keep in mind that the primary market trend remains bullish, and there is a high probability that any short may hit stop-loss.
📈 For a long position, the first trigger would be a breakout above the triangle. In this case, breaking 105673 could justify entry. Key overhead resistances are located at 107010 and 110256.
👑 BTC.D Analysis
Looking at Bitcoin dominance, the metric continued its upward move to reach 64.67 and has since been rejected from that level.
⚡️ If the bullish move continues, the breakout above 64.67 would act as a bullish trigger. On the other hand, a breakdown below 64.29 would confirm a bearish shift.
📅 Total2 Analysis
Total2 is currently ranging between 1.13 and 1.16. A breakout from either side could serve as a trigger for a directional position.
📊 If 1.13 breaks, a short position could be considered. Conversely, breaking above 1.16 would signal a potential long.
📅 USDT.D Analysis
After breaking above 4.70, USDT dominance has been ranging between 4.70 and 4.79. It’s now heading back toward the 4.79 resistance.
🧩 If 4.79 is broken, the next bullish leg in dominance may begin. A drop back below 4.70 would bring the dominance back into its previous range and could lead to further downside toward 4.49.
❌ Disclaimer ❌
Trading futures is highly risky and dangerous. If you're not an expert, these triggers may not be suitable for you. You should first learn risk and capital management. You can also use the educational content from this channel.
Finally, these triggers reflect my personal opinions on price action, and the market may move completely against this analysis. So, do your own research before opening any position.

Correlation between USDT.D and BTC.D
Hello, traders.
If you "Follow", you can always get new information quickly.
Have a nice day today.
-------------------------------------
(USDT.D 1M chart)
If USDT dominance is maintained below 4.97 or continues to decline, the coin market is likely to be on the rise.
The maximum decline is expected to be around 2.84-3.42.
-
(BTC.D 1M chart)
However, in order for the altcoin bull market to begin, BTC dominance is expected to fall below 55.01 and remain there or show a downward trend.
Therefore, we need to see if it falls below the 55.01-62.47 range.
The maximum rise range is expected to be around 73.63-77.07.
-
In summary of the above, since funds are currently concentrated in BTC, it is likely that BTC will show an upward trend, and altcoins are likely to show a sideways or downward trend as they fail to follow the rise of BTC.
The major bear market in the coin market is expected to begin in 2026.
For the basis, please refer to the explanation of the big picture below.
-
Thank you for reading to the end.
I hope you have a successful transaction.
--------------------------------------------------
- This is an explanation of the big picture.
(3-year bull market, 1-year bear market pattern)
I will explain more details when the bear market starts.
------------------------------------------------------

Phoneix is coming backdoes not include financial advice.
the graph is back to its 2019 appearance
let's see if he can spread his wings this time

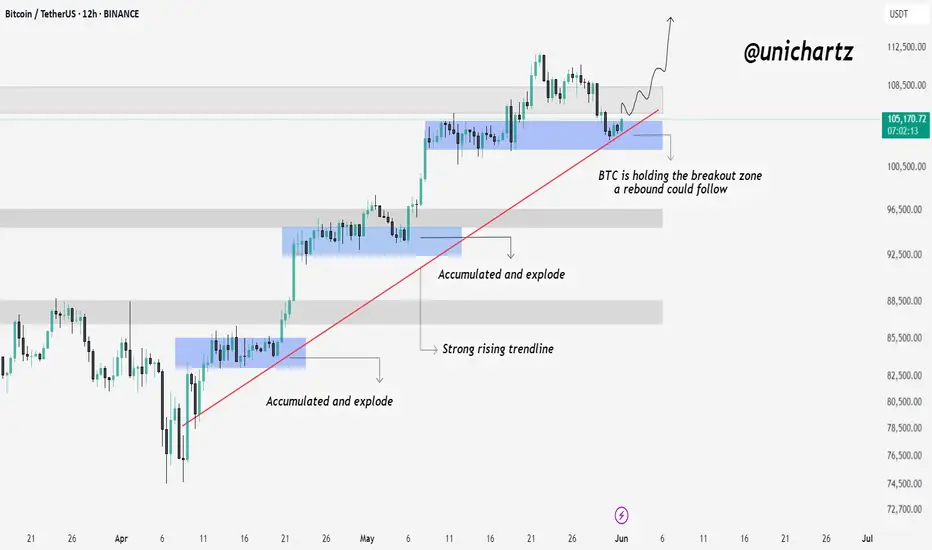
Bitcoin Retests Breakout Zone – Will It Bounce Again?Hello traders, here is the Quick CRYPTOCAP:BTC update
Bitcoin is currently holding right at the previous breakout zone, which also aligns with the rising trendline and previous accumulation area.
This zone has acted as a strong launchpad in the past — where BTC accumulated and exploded higher. If buyers defend this level again, we could see another rebound play out from here.
As long as BTC holds this structure, the bullish trend remains intact.
Bullish Altcoins: Bitcoin Dominance In Correction ModeHere BTC.D is still moving within a classic ABC correction. The peak happened 7-May. After 14-May there was a bounce but this bounce ended in a lower high. The correction is not over.
As this index moves lower, the Altcoins market will grow.
When Bitcoin turns sideways, retraces or consolidates, it is an opportunity for the smaller Altcoins to move forward. This is the scenario we are entering right now.
» Bitcoin sideways. Altcoins bullish. Long-term growth.
The 2025 bull market is only starting now. Prepare for growth until late 2025 or beyond (early 2026).
Namaste.

USDT dominance chart!The chart shows USDT.D (Tether dominance) moving within a descending channel.
Currently, USDT.D is testing the upper resistance of the channel, around 4.65%.
If the dominance gets rejected at this level, the next potential target is the lower channel support around 3.9-4.0%.
This could indicate a risk-off environment where traders move capital from stablecoins (USDT) to more volatile assets like Bitcoin or altcoins.
The 50 and 200 moving averages provide dynamic resistance levels that support this potential downside move.
Thanks for your support!
DYOR. NFA

WARNING! Sell Your Altcoins, -40% Drop AheadHello, Skyrexans!
The title of this article is made specially for haters. I see euphoria on each small drop of CRYPTOCAP:BTC.D and understand that altseason now will not happen. People are still holding and dreaming Lambos. This is very bad for potential growth, so I expect only dump on risky alts with the new dominance push!
Look at the 4h time frame. As you remember from my previous analysis I expect the global wave 5. In my opinion waves 1 and 2 have been finished already. Wave 2 represented as an irregular ABC correction. Target at 0.38 Fibonacci has been reached. Now it's time for wave 3 which will reach 67%. During this dump on altcoins I wanna see total disappointment of moon boys and selling on every local bounce. I will repeat once more, market shall be cleared from the crowd to go up.
I am not an altseason hater. I am also holding some altcoins, but it's important to understand the real picture and have the right exaltations. Otherwise you will be disappointed and go out from rocket. I wish for clever, patient and realistic people to earn on the altseason, but first of all market need to persuade greedy and disrespectful people to escape altcoins.
Best regards,
Ivan Skyrexio
___________________________________________________________
Please, boost this article and subscribe our page if you like analysis!

TradeCityPro | Bitcoin Daily Analysis #104👋 Welcome to TradeCity Pro!
Let’s dive into Bitcoin and key crypto indices. As usual, in this analysis I’ll walk you through the triggers for the New York futures session.
⏳ 1-Hour Timeframe
On the 1-hour chart, as you can see, Bitcoin was once again rejected from the 110128 level yesterday and is now hovering near 108237.
✔️ At the moment, price hasn’t yet touched the 108237 support. If it manages to stay above this level without breaking below, the chances of retesting 110128—and even breaking above it—increase.
🔍 If 108237 is broken, a short position could be considered. However, keep in mind that this setup goes against the current uptrend. As mentioned in previous analyses, the 106192–107010 range is a major support zone, and as long as price remains above it, the trend remains bullish.
📉 The main short trigger would be a break below this key support. If that occurs, it could introduce strong bearish momentum. An RSI break below 38.57 would serve as a momentum confirmation.
✨ During this pullback from 110128, market volume has been decreasing, which indicates the strength of the ongoing uptrend.
💥 If 110128 is broken, and considering the strong trend, a long position could be initiated. An RSI break above 50 would provide additional confirmation. The primary long trigger remains a break above 111747.
👑 BTC.D Analysis
Bitcoin Dominance continued to fall yesterday, reaching as low as 63.87. It has shown a slight bounce from that level and is currently in a mild upward correction.
⭐ If a lower high forms below 64.18, the chances of breaking below 63.87 increase. However, if the correction goes beyond 64.18, the probability of resuming the uptrend will grow.
📅 Total2 Analysis
Yesterday, Total2 was rejected from 1.24 and corrected down to 1.21. If price bounces from here and heads back toward 1.24, the chances of breaking that resistance will rise.
📊 If 1.21 fails to hold, a deeper correction toward 1.18 could follow.
📅 USDT.D Analysis
USDT Dominance is forming a lower high compared to 4.56. If this plays out and 4.49 is broken, it would confirm a bearish move.
⚡️ On the other hand, if 4.56 is broken to the upside, the move could extend toward 4.62.
❌ Disclaimer ❌
Trading futures is highly risky and dangerous. If you're not an expert, these triggers may not be suitable for you. You should first learn risk and capital management. You can also use the educational content from this channel.
Finally, these triggers reflect my personal opinions on price action, and the market may move completely against this analysis. So, do your own research before opening any position.
