#BTC/USDT 4HR CHART UPDATE !!BTC was unable to hold the lower trend line support and broke below here
Hello members as we can see BTC does not played as we have expected here, it was unable to sustain the lower trend line support and broke below.
IMO, it can also be a fake-out don’t know but, a candle close below the current candle will change things.
Here we should wait for the weekly close which will be the direction point for BTC’s upcoming PA.
NOTE: This is not financial advice This is for education purposes only. I am not responsible for the profits or losses you generate from your investments.
DO YOUR OWN RESEARCH BEFORE MAKING ANY TRADES.
Thank you.
Btcdominancechart

BITCOIN DOMINANCEBTCDOM/USDT just watch Bitcoin dominance starting to push down this plays a big role on Bitcoin where you can see a big Resistance zone on this chart if that resistance cant broke we are Bullish with BITCOIN for my opinion we can Take 22000$-23000$ if Dominance start to drop more down But if that resistance Broke We are Bearish and we comming first 19000$--16000$----14000$
ENJOY

#TETHER/DOMINANCE DAILY CHART UPDATE !!Hello, community members welcome to another USDT DOMINANCE chart update.
If you find this update helpful, shoot the like button follow and share your views in the comment section.
As we can see from the above-mentioned chart that USDT DOMINANCE is currently facing the resistance level in the daily time frame.
Rejection will bring relief to bulls and it can drop down to the level of 5.50%.
Break above will lead ALT COIN to bleed more and it will end up things horrible.
Let’s see how USDT DOMINANCE performs in the upcoming days.
NOTE: This is not financial advice. This is for education purposes only. I am not responsible for the profits or losses you generate from your investments.
DO YOUR RESEARCH BEFORE MAKING ANY TRADES.
Thank you.

Must read BTC IMPORTANT WEEKLY UPDATE !!As we can see in the chart mentioned above that BTC is currently trading one support of green MA.
If we consider the past and do some backtesting then it is clearly evident that BTC holds the green MA very well but it always moves downside to touch the lower trend line support, so here I am expecting a wick off from the lower trend line support and rally to print a new ATH.
Whenever BTC bounced from the lower trend line support it printed new ATH.
At the top of this chart, BTC also printed a double top pattern and a triple top is likely in the upcoming days.
In another scenario, if BTC breaks below the lower trend line, this chart will be invalidated.
Thank you for your time, we hope that our work is good for you, and you are satisfied, we wish you a good day and big profits.
Thank you

BTC.Domination Analysis 9 June 2022#UPDATED
#BTC.D Analysis
still moving in ascending channel and rejected two times after hit nearly major resistance. but if we see from indicator BTC.D showing in overbought area which shoudly down first to retest indicator
center trendline be strong resistance any 4 times trying to breakout always rejected and back to support trendline
i this situation can't expect much . Alt season will happen if BTC.D breakdown And BTC sideways or up and instead if BTC.D up or pumping we will see ALT dominant dump

#BTC.DOMINANCE 1Hour CHART UPDATE !!Hello dear traders, we are new here so we ask you to support your ideas with your LIKE and COMMENT, feel free to ask any questions in the comments, and we will try to answer for all, thanks, Friends.
I have tried my best to get the best possible results in this chart.
Hello, dear traders welcome to this BTC.DOMINANCE 1Hr chart analysis.
Now Rejected from resistance and Holding 47.11% support.
We can see more Blood baths in #Altcoins
Remember:-This is not a piece of financial advice. All investment made by me is at my own risk and I am held responsible for my own profit and losses. So, do your own research before investing in this trade.
Sorry for my English it is not my native language.
Do hit the like button if you like it and share your charts in the comments section.
Thank you...

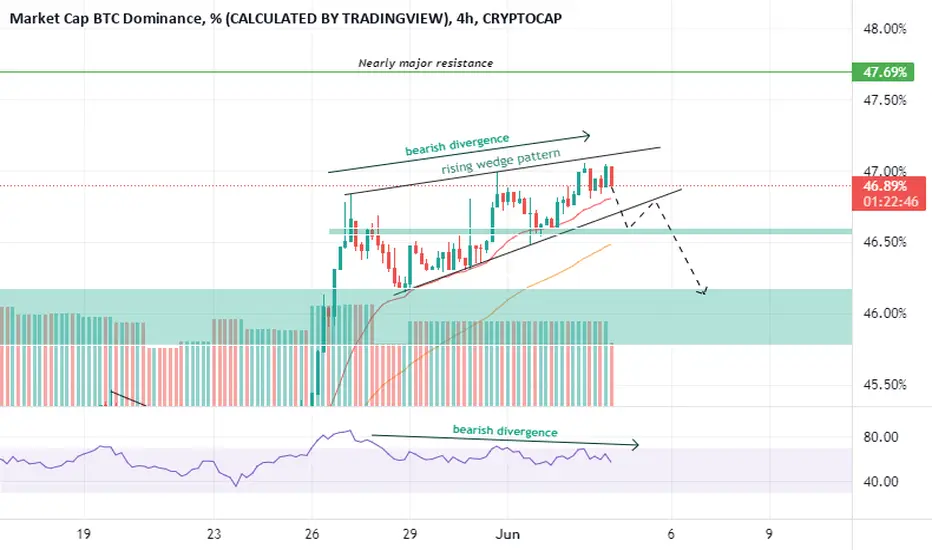
BTC.Domination Analysis 4 June 2022#BTC.D ANALYSIS
we can see BTC.D now make a rising wedge pattern And also any bearish divergence in RSI . Rising wedge valid if BTC.D breakdown . if this can happen, good for ALTS coin
Btc Dom UPDATE (refer to linked post)First BTCDOM target hit, and is halfway through the second TP. Refer to linked post for reference =)


#BTCDOMINANCE 2Hr UPDATE BY CRYPTOSANDERS !!Hello dear traders, we are new here so we ask you to support your ideas with your LIKE and COMMENT, feel free to ask any questions in the comments, and we will try to answer for all, thanks, Friends.
I have tried my best to get the best possible results in this chart.
Hello, dear traders welcome to this BTC.DOMINANCE 2Hr chart analysis.
As we can see from the above-mentioned chart that BTC.D is trading inside the bear flag pattern.
BTC.D rejected from the upper trend line resistance and will move downside towards the lower trend line at the level of 46.80%.
Break below the lower trend line retest will trigger the BTC pair altcoins to rally upside hard.
Thank you for your time, we hope that our work is good for you, and you are satisfied, we wish you a good day and big profits.
Sorry for my English it is not my native language.
Thanks.

USDT dominance: tool to anticipate rotation back into BTC+altsUSDT dominance, like in my last BTCSHORT post, is also a useful tool to approximate when BTC may bottom & when USDT coins will rotate back into BTC+Altcoins.
This monthly chart suggests that BTC still have some room to fall (still a small space to reach the top of wedge) before a real rally.
Not trading advice

BTC.DOMINATION ANALYSIS BTC.D consolidation and make a bullish flag pattern . has breakout and also retest and now still consolidation in lower timeframe , we see have double doji pinbar candle on support and confirmation close with green candle , potential continue upward movement minimum 46.82%
so this is bad for ALTS if BTC.D up and BTC down ALTS will dump

#BTC.DOMINANCE 1DAY UPDATE !!Hello dear traders, we are new here so we ask you to support your ideas with your LIKE and COMMENT, feel free to ask any questions in the comments, and we will try to answer for all, thanks, Friends.
I have tried my best to get the best possible results in this chart.
Hello, dear traders welcome to this BTC.DOMINANCE 1DAY chart analysis.
Dominance is getting rejection by the resistance. The reason we see some green in many Alts across the market.
ALT/ BTC Pairs are likely to continue the rally unless broken upside.
The trend for alts looks strong for now but keep in mind this will only stay this way as long as BTC holds the $28k level. That is the key level we need to keep an eye on.
Thank you for your time, we hope that our work is good for you, and you are satisfied, we wish you a good day and big profits.
Sorry for my English it is not my native language.
Thanks.

BTCDOM ANALYSISBTCDOM ANALYSIS
BTC succeed breakout and has retest potential continue upward movement. Nearly resistance at 47.69% Area
If BTC breakdown until $26k area potential BTCDOM hit 48.92% this is key resistance level for BTCDOM
RSI showing overbought on daily so potential rejection and make a correction at 46,7% Area before back to try breakout again

#BTC.DOMINANCE UPDATE BY CRYPTOSANDERS !Hello dear traders, we here new so we ask you to support our ideas with your LIKE and COMMENT, also be free to ask any question in the comments, and we will try to answer for all, thank you, guys.
Hello, dear traders welcome you to this BTC.DOMINANCE 1hr chart analysis.
Dominance is getting rejection by the resistance. The reason we see some green in many Alts across the market.
ALT/ BTC Pairs are likely to continue the rally unless broken upside.
The trend for alts looks strong for now but keep in mind this will only stay this way as long as BTC holds the $28k level. That is the key level we need to keep an eye on.
THANK YOU.Thanks for your time, we hope our work is good for you, and you are satisfied, we wish you a good day and big profits.
THANK YOU.

#BTC Dominance Rejection in progress.. ALTSEASON??#BTC Dominance getting rejection from the resistance. Reason we are seeing some green in many Alts across the market.
ALT/BTC Pairs are likely to continue the rally unless broken upside.
The trend for alts look strong for now but keep in mind this will only stay this way as long as BTC holds the $28k level. That is the key level we need to keep an eye on.
Make sure you keep enough cash to buy the Dips and always DCA your entires and use SLs.
Cheers
Smash that like button if you like it and share your views in the comment section.
Thank you
#PEACE

#BTC.DOMINANCE 1HOUR UPDATE BY CRYPTOSANDERS !! Hello dear traders, we here new so we ask you to support our ideas with your LIKE and COMMENT, also be free to ask any question in the comments, and we will try to answer for all, thank you, guys.
Hello, dear traders welcome you to this BTC.DOMINANCE 1hr chart analysis.
CHART ANALYSIS:-As we can see in the chart above BTC.D was trading inside the parallel channel pattern and broke above the 45% level.
Now, BTC.D is retesting the upper trend line, and here BTC.D can put towards the 49% level which is 8.5% from the retesting level.
It indicates that BTC can also pump at any time and we can witness short-term bull rallies in upcoming hours.
Thanks for your time, we hope our work is good for you, and you are satisfied, we wish you a good day and big profits.
THANK YOU.

#LUNA/BUSD 30 MIN CHART UPDATE BY Domino Crypto!!Hello, community members welcome to this LUNA/BUSD 30 minutes chart update by Domino crypto.
Don’t forget to hit the like button if you find this update helpful because this motivates me to bring this kind of update on a regular basis.
Now, Let's get to the chart,
As we can see at the above mentioned chart that LUNA was trading inside a triangle pattern in this 30 minutes chart and broke above the upper triangle pattern.
Now LUNA is retesting the upper trend line and trading on the green support zone at the price level of $0.0001300, here we can take entry for some good profits.
But LUNA needs to hold this lower green zone support if it breaks below and closes then it will no trade for me.
This is for only SPOT TRADING.
Entry will be between $0.00012000 to $0.00013000.
SL: $0.00011200
Target: $0.00022000 to $0.00025000
INVALIDATION: candle close below the STOP LOSS in the 30 MINUTES time frame will be the invalidation point of this chart analysis.
NOTE: This is not financial advice. This is for education purposes only. I am not responsible for the profits or losses you generate from your investments.
DO YOUR RESEARCH BEFORE MAKING ANY TRADES.
Thank you.

#BTC.DOMINANCE 2HOUR UPDATE BY CRYPTOSANDRS !!Hello dear traders, we here new so we ask you to support our ideas with your LIKE and COMMENT, also be free to ask any question in the comments, and we will try to answer for all, thank you, guys.
Hello, dear traders welcome you to this BTC .DOMINANCE 2hr chart analysis.
CHART ANALYSIS:-BTC.DOMINANCE is flag brake out and the retest uper trand line and BTC pair altcoin is bearish.
Thanks for your time, we hope our work is good for you, and you are satisfied, we wish you a good day and big profits.
THANK YOU.

#BTC.DOMINANCE BART PATTERN CREATE !!Hello dear traders, we here new so we ask you to support our ideas with your LIKE and COMMENT, also be free to ask any question in the comments, and we will try to answer for all, thank you, guys.
Hello, dear traders welcome you to this BTC.DOMINANCE 2hr chart analysis.
CHART ANALYSIS:-This Bart pattern is forming so we can expect BTC dominance from here to be a power buying opportunity for 41.60% BTC pair, we will give you a slack BTC pair coin update soon.
Thanks for your time, we hope our work is good for you, and you are satisfied, we wish you a good day and big profits.
THANK YOU.

Let's not catch a falling knife .CRYPTOCAP:BTC.D
We are being rejected of the monthly supply and might head downwards in sometime which may let the alts to rise. We have made a triangle in which price tried to brekout upwards but seems to a fake-out now to trap late longs. Bitcoin bottoming and Dominance going down can give provide us with at least 15-20% for now.
PS = Still holding 50% USDT for future use i want to catch a dip not a falling knife.

ALTS CAN RISE AGAIN !BTC.D I'm seeing a reversal at this point , next weekly open can be good for alts in my opinion 44.62% and 44.17% acting as a strong resistance here . But on the other side if we close a few daily above 44.62% we may see another blood bath in this month , else a drop till 42.63 level is quite possible . BTC might range till 20Th of may and Dominance going lower . What might be a best to to load a few dips ? Though save some USDT for future use .

#BTC DOMINANCE WEEKLY UPDATE BY CRYPTOSANDERS!!Hello, welcome to this BTC.D chart update by CRYPTOSANDERS.
I have tried my best to bring the best possible outcome to this chart.
Show some support do hit the like button, follow and comment in the comment section. this motivates me to bring this kind of chart analysis on regular basis.
CHART ANALYSIS :
BTC .D still respecting the bear flag. If confirmed over the next few weeks we could see bitcoin dominance reach the very low 30 maybe even into the high 20%. Altcoins will explode if BTC .D loses 39%.
Do hit the like button if you like it and share your charts in the comments section.
THANK YOU...
