Btc to the moon?be carefulShort:price should touch line again if after twice touch it breaks you can open position low risk and set your sl back of last pivot. If after third touch price breaks line you can open position with more risk and set your sl back of break candle shadow and your target can be next sr line.
Long:price touched line 3time it's good and you can open risky position with low risk after break line but I suggest you open your position in pullback to line or in break last high after price broken sr line.You can set your position in setup 1 back of last pivot and in setup 2 and 3 you can set sl back of shadow of break candle. Don't forgot you can open long setup 1.2 and 3 if rsi breaks dynamic line. And never trade with whale candles
Thank you for boost and comment and spending time for read this article.
Btcdump

Don't buy btc?In third touch to wedge up line you can open short and it should have bearish divergence in RSI. And target of v pattern is a resistance. We can see more shadows nd smaller candles in bullish trend. Volume don't like this trend too. But if btc break 2 resistance and RSI line it could have bullish moments but I wouldn't open long position.

BTCUSD (BITCOIN)Bitcoin price is near at 21 june swing high $21722 facing strong resistance we see potential breakout of this level also chart pattern rising wedge is forming and if breakout with volume than two structure are break supply zone and wedge so the price next target for #btc is $22721 resistance level and above reistance are draw in the chart.
#bitcoin
#btcpriceprediction

Gold vs BTC, which one will make the next move? XAUBTC is one of my favorite indicators to decide if bitcoin's big crash or big pump is over! The rivalry between GOLD and BTC is worth watching and being careful about.
It seems that bitcoin will suffer a little more depreciation against gold and will lose more value until it reaches the next resistance zone, I mean between 0.1 to 0.11. After the touch and a few days of range on the area, either the red or the green scenario is going to happen and it's too soon to talk about it. But in the case of the green scenario which leads BTC to gain value against gold, I'm expecting a sharp reject because there is no obstacle to reaching 0.06 on the chart and it means a nice pump for the bitcoin.
DO YOUR OWN ANALYSIS.
DO NOT FORGET MONEY MANAGEMENT.

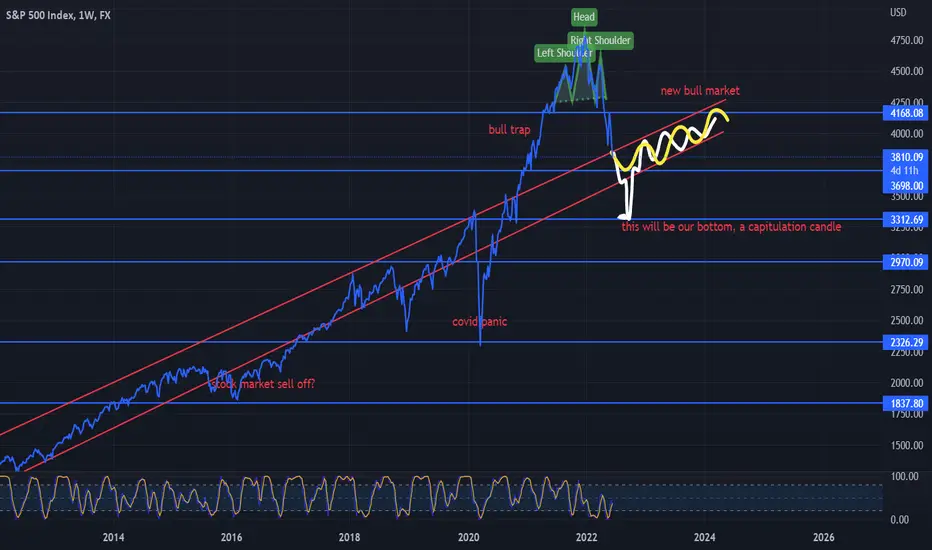
2009 till 2022, bullish channel, where we bottom by DIAAlright, so we can clearly see a bullish channel since 2009. During a bear market or stock sell offs, we deviated temporarily from the trend line ;there is no support there at the moment, or maybe we go more sideways. This could mean bottom is if we break 3700, 3311 swift capitulation, then bounce to 3600.
#BTC.DOMINANCE 1Hour CHART UPDATE !!Hello dear traders, we are new here so we ask you to support your ideas with your LIKE and COMMENT, feel free to ask any questions in the comments, and we will try to answer for all, thanks, Friends.
I have tried my best to get the best possible results in this chart.
Hello, dear traders welcome to this BTC.DOMINANCE 1Hr chart analysis.
Now Rejected from resistance and Holding 47.11% support.
We can see more Blood baths in #Altcoins
Remember:-This is not a piece of financial advice. All investment made by me is at my own risk and I am held responsible for my own profit and losses. So, do your own research before investing in this trade.
Sorry for my English it is not my native language.
Do hit the like button if you like it and share your charts in the comments section.
Thank you...

BTC PUMP Comming !!!!!!!Not too much changes in my btc chart.Btc is still holding the major support zone of $30k - $28k . Btc can again test the lower trendline of falling wedge pattern before any pump.We are safe as far as btc is holding the support zone of 30k-28k and the lower trendline of falling wedge pattern .Total Crypto Market cap is also at major support zone OF .If btc will hold this major support zone than it can move towards 33k-37k or more upside move will be possible also{in case of Falling Wedge Pattern upside Breakout}.Total crypto market cap needs to hold its support zone . If Total market cap will lost its support zone , then no one can stop btc to dump towars $24k-$18k area .So, Both of them hold their support zone. For now , dont invest your whole portfolio in coins. must keep some spare funds to do dca in case of BTC&Total market cap support zone broken.i hope this update will be helpful for you. Hit the like button to keep us motivated.

How did Open Interest tell me: Stay long as BTC Dumped!?!BYBIT:BTCUSD
I was in 3 long trades as Bitcoin dumped on the 26th of May 2022.
I had 2 choices. Close my longs because I saw price dumping below my entry
or
look at what Open interest was telling me to determine if this was a fakeout.
I saw price dropping as OI was dropping. This meant that longs were closing out their positions, which means that when this ended, price could reverse quickly.
Longs were closing out their positions and re-entering as shorts. As soon as this selling dried up, Longs started entering and then suddenly shorts were being liquidated, pushing the price up again.
This is known as a stop run. Hit long stops and then hit short stops. Be aware of this kind of fakeout as it happens again and again!
Learn to trade the retest and why it is important not to short at support and inversely why it is NB not to long at resistance, UNLESS you get a retest of that level!
Not financial advice, DYOR. Papertrade before using real money.
If this educational snipped helped you, please consider giving it a thumbs up and follow for more like this!
Trade Safely and Learn something every day!
Shawn

BTC Continuation SellsIf we are able to trade back into the FVG, i'd say we have a high probability to continue a lower maybe reaching for the full TP.

#BTC.DOMINANCE 6HOUR UPDATE BY CRYPTOSANDERS Hello, welcome to this BTC.D chart update by CRYPTOSANDERS.
I have tried my best to bring the best possible outcome to this chart.
Show some support do hit the like button, follow and comment in the comment section. this motivates me to bring this kind of chart analysis on regular basis.
CHART ANALYSIS :
As we can see in the above-mentioned chart that BTC.D is trading inside the triangle pattern on a support level after a rejection from the red resistance zone, whenever BTC.D rejects from the red resistance zone it moves down towards the lower support zone which is 39.40%.
Here I am expecting that BTC.D will brake the green support and move down to the White ray support area which is 39.40%.
Sorry for my English it is not my native language.
Do hit the like button if you like it and share your charts in the comments section.
THANK YOU...

#BTC.DOMINAMNCE DAILY UPDATE BY CRYPTOSANDRES Welcome to this BTC .DOMINANCE analysis in the chart
I have tried my best to bring the best possible outcome in this chart.
Hello members welcome to BTC.D 1DAY update by CRYPTOSANDERS
In the above mentioned chart we can see that BTC.D dominance is trading inside the Chanel pattern and rejected from the yellow MA In daily chart.
So just line the previous two moves inside the channel so here we are expecting that BTC DOMINANCE can fall all the way to the lower trend line. Which will be the bull trend for btc.
This is not a piece of financial advice.
Sorry for my English it is not my native language.
Do hit the like button if you like it and share your charts in the comments section.
thank you.

#BTC.DOMINANCE 4HOUR UPDATE BY CRYPTOSANDERS Welcome to this BTC.DOMINANCE analysis in the chart
I have tried my best to bring the best possible outcome in this chart.
Hello members, welcome to BTC.D 4 hour update by CRYPTOSANDERS.
If you have gone through with our yesterday's BTC.D 3 day chart then you will remember, in that chart we mentioned that BTC.D is looking bearish in long term.
In the current scenario, in 4hr chart, BTC.D is currently trading inside the falling channel pattern.
As we told in our last update that we can take a position in ALTCOINS in btc pair this chart is confirming in the shorter time frame that we will be able to earn some good profit in long run.
If BTC.D broke the upper trend line then this chart will be invalidated.
This is not a piece of financial advice.
Sorry for my English it is not my native language.
Do hit the like button if you like it and share your charts in the comments section.
thank you.

#BTCDOMINANCE 3DAY UPDATE BY CRYPTOSANDERS Welcome to this quick BTCDOMINANCE analysis.
I have tried my best to bring the best possible outcome in this chart.
Hello members, welcome to our BTC.D 3-day update
As we can see here that BTC.D is on a support of yellow MA, inside a falling wedge pattern.
If BTC.D rejects from yellow MA then that will be the confirmation that BTC.D can come down to 39% mark.
If it moves as we expect then we will see an uptrend in ALTCOINS until BTC.D changes its movement direction.
Sorry for my English it is not my native language.
Do hit the like button if you like it and share your charts in the comments section.
THANK YOU...

#BTC.DOMINANCE 4HOUR UPDATE BY CRYPTOSANDERS Hello members, welcome to the BTCDOMINANC Quick update by CRYPTOSANDERS.
I have tried my best to bring the best possible outcome in this chart.
In the current scenario, BTC.D broke the Chanel downside and retested the lower trend line.
We are expecting here that we will see some downfall which means that BTC will form some green candle because as we know that BTC and BTC.D both work inversely proportional.
Sorry for my English it is not my native language.
Do hit the like button if you like it and share your charts in the comments section.
THANK YOU...


BTC/USDT 1HOUR UPDATE BY CRYPTOSANDERSWelcome to this quick BTC /USDT analysis.
I have tried my best to bring the best possible outcome in this chart
Hello friends
BREAKING: Explosions are now being reported in Odesa as well, as the Russian bombardment of Ukraine continues.
Thanks for connecting with us stay tuned like comment and share to get the latest updates
Sorry for my English it is not my native language.
thank you.

BTC/USDT may drops more 30%HELLO FRIENDS, here we can see in 1 day timeframe and it showing barish flag pattern. If bitcoin rejects by its resistance I will fall up to 30% ($27,000). BITCOIN has Major resistance at $39,400 and $46,000. If you are a short term holder be careful...... FOLLOW FOR MORE...

BTC/USDT SHORTHELLO FRIENDS, BTC/USDT showing inverse flag pattern and also rejected by its resistance . We can see some more dump in bitcoin. Be Careful short term holders....,

BTC/USDT broke it's strong supportHELLO FRIENDS, this is a fast ubdate, here we can see BTC broke it's Feb and trend support just now. And if this 4 hour candle closes red we can see more drop up to $37800. FOLLOW FOR MORE

BTCUSDT Little DumpStructure is changing But We Might See A Little More Dump From Here To My POI 1 AND 2.Trae safe .Entry At 15m Bearish Flag.

btcusdt targets 29K and 21k what is happening daily timeframe Btcustd already made Cup and handle and also Head and shoolders Completed so two patterns on Retest sooner or later btc ll touch the Target 29k and may be posible to touch 21k
BTCDOMINCE also cup and handle on Retest if Btc domoince goes up the btc and whole market ll down,,,
not finacial advice

What's it look like to you? Bitcoin short.BTC heading for underside of the previous support trendline on the descending wedge prior to the drop. My bet is we reject straight down from it in the next day or so.

Nearing "Deathcross" A familiar pattern takes formThat i'm sure most have noticed by now. This deathcross makes it that much more relatable now.
