Hitting Resistance28-30k is big resistance. Expect a pullback over the next couple of weeks. Possibly all the way back down to our neckline at $25,200.
Stew
Btceth

BTC/USD 1DAY UPDATE BY CRYPTO SANDERS !!Hello, welcome to this BITCOIN /USD update by CRYPTO SANDERS.
CHART ANALYSIS:-Bitcoin ( BTC ) fell from earlier highs on Tuesday, as momentum in cryptocurrency markets rapidly changed as the day progressed.
Following a high of $25,126.85 earlier in today’s session, BTC/USD has since gone on to fall to a low of $24,642.57.
Tuesday’s earlier high sent the world’s largest cryptocurrency to its strongest point since June 13.
Overall, prices slipped as bulls were unable to force a breakout of a resistance level at the $25,200 mark.
In addition, the relative strength index (RSI) also failed to move beyond its own ceiling at 66.00.
As of writing, the index is tracking at 63.29, which is marginally above a support zone of 61.00.
I have tried to bring the best possible outcome to this chart.
Hit the like button if you like it and share your charts in the comments section.
Thank you.

BTC/USD 1DAY UPDATE BY CRYPTO SANDERS !!Hello, welcome to this BITCOIN /USD update by CRYPTO SANDERS.
CHART ANALYSIS:-Bitcoin ( BTC ) BTC has also formed an Adam and Eve chart pattern and attempting to break out its neckline and making it weak in each attempt of breakout.
We've to wait for a breakout with a successful retest above it, which would confirm a strong bullish rally in the market.
If the bottom is closed then the chat will be invalid
I have tried to bring the best possible outcome to this chart.
Hit the like button if you like it and share your charts in the comments section.
Thank you.

BTC/USD 1DAY UPDATE BY CRYPTO SANDERS !!Hello, welcome to this BITCOIN /USD update by CRYPTO SANDERS.
CHART ANALYSIS:-Bitcoin ( BTC ) rebounded from recent losses in today’s session, as prices moved closer to the $22,000 level.
BTC/USD hit an intraday high of $21,849.01 earlier in the day, which comes after falling to a low of $21,460.09 on Monday.
Today’s action saw bitcoin snap a two-day losing streak, and comes as prices rejected a full breakout of a floor at $21,500.
Looking at the chart, the 14-day relative strength index (RSI) also rejected a break of its own, with the index remaining above its support at 44.00.
As of writing, price strength is at a reading of 47.86, with a resistance of 50.00 nearby.
In order for BTC bulls to take the price above the $22,000 mark, this point of resistance will need to be broken.
I have tried to bring the best possible outcome to this chart.
Hit the like button if you like it and share your charts in the comments section.
Thank you

The market is at a crossroadsOver the weekend, Bitcoin jumped above $22 000. However, the rebound did not last long, and Bitcoin fell toward the $21 700 price tag, where it currently trades. We have not yet seen developments confirming the short-term trend reversal (from bullish to bearish). Therefore we are very cautious and pay close attention to two particular price levels at $21 473 (support) and $22 314 (resistance). If the price breaks below $21 473, it will further bolster a bearish case in the short term; in such a scenario, we would like to see a pick-up in volume. On the other hand, a breakout above $22 314 will support a bullish case, potentially hinting at a retest of $22 500 and $23 000.
Besides mentioned price levels, we also watch the price action in the stock market to which Bitcoin stays highly correlated. To support a bearish case, we would like to see stocks go lower, sparking risk aversion among investors. Contrarily, to support a bullish case, we would want to see the stock market start erasing some of its recent losses, providing aid for the cryptocurrency market. Overall, we would say that the market is at a critical point where it might either start breaking down or recovering losses and marching higher.
Illustration 1.01
Illustration 1.01 displays the daily chart of BTCUSD and two simple moving averages. The 20-day SMA acts as another form of resistance. Meanwhile, the 50-day SMA has a role of support.
Technical analysis
Daily time frame = Bearish
Weekly time frame = Neutral/Slightly bearish
Illustration 1.02
Illustration 1.02 displays the weekly chart of BTCUSD. The yellow arrow indicates a price retracement toward the 50-week SMA, which often coincides with the strong correction of a primary trend.
Please feel free to express your ideas and thoughts in the comment section.
DISCLAIMER: This analysis is not intended to encourage any buying or selling of any particular securities. Furthermore, it should not be a basis for taking any trade action by an individual investor. Therefore, your own due diligence is highly advised before entering a trade.

BTC/USD 1DAY UPDATE BY CRYPTO SANDERS !!Hello, welcome to this BITCOIN /USD update by CRYPTO SANDERS.
CHART ANALYSIS:-Bitcoin ( BTC ) extended recent declines on Friday, with prices falling below the $22,000 mark for the first time in several weeks.
BTC/USD fell to an intraday low of $21,754.13 earlier today, which comes less than 24 hours after trading at $22,770.22.
As a result of this drop, bitcoin moved to its weakest point since January 20, when the price bottomed at $20,865.
From the chart, the sell-off took place following a break out of a resistance level at $22,500, which had mostly held firm since late January.
In addition to this, the 14-day relative strength index(RSI) also dropped, falling to its lowest point in over a month.
After weeks in overbought territory, price strength has started to subside, which could act as a long-term positive for bulls, whose next target will likely be $25,000.
I have tried to bring the best possible outcome to this chart.
Hit the like button if you like it and share your charts in the comments section.
Thank you

BTC/USD 1DAY UPDATE BY CRYPTO SANDERS !!Hello, welcome to this BITCOIN /USD update by CRYPTO SANDERS.
CHART ANALYSIS:-Bitcoin ( BTC ) Bitcoin (BTC) moved higher on Wednesday, following comments from Federal Reserve Chair Jerome Powell.
Speaking yesterday, Powell stated, “The reality is we’re going to react to the data. So if we continue to get, for example, strong labor market reports or higher inflation reports, it may well be the case that we have to do more and raise rates more than is priced in.”
BTC/USD rose to an intraday high of $23,367.96 earlier today, less than 24 hours after hitting a low of $22,781.95.
Looking at the chart, the move pushed bitcoin to its strongest point in four days and came as the 14-day relative strength index (RSI) ran into a ceiling.
The index rose to a ceiling at 65.00, however, momentum was not strong enough to break out of this point.
As of writing, the index is tracking at 62.92, with BTC falling from earlier highs, and currently trading at $23,195.36.
I have tried to bring the best possible outcome to this chart.
Hit the like button if you like it and share your charts in the comments section.
Thank you

#BTC/USDT 2hour update !!Hello and welcome to this BTC /USDT chart update by Crypto Sanders.
I have tried to bring the best possible result in this chart.
Chart Analysis:- hello friend welcome to btc 2hr update btc is forming a bearish expanding pattern expect btc to fall from here so close your positions open long positions and short only after seeing the market face.
This is not a piece of financial advice.
Hit the like button if you like it and share your chart in the comment section.
Thank you

BTCETH Price PredictionBTCETH is forming an ascending triangle on 4h timeframe and upwards breakout is expected as bullish structure has also formed.
The target is 15.

BITCOIN 4H next move Bitcoin is in the short term in the uptrend flag pattern, which is expected to rise in prices if we pass through the resistance area, otherwise it is not unexpected due to the uptrend line failure.
Its not Buy or Sell SIGNAL
DYOR
BY : M.TeriZ - @AtonicShark

new analysis It's really hard to explain this
but we have a slight downpour, and then about 1 month to 45 days the market is bullish , and the altcoin will grow between 100 and 1000%, currencies with high market caps like Ethereum 100% and currencies with low market caps up to 1000%,
and then we have a terrible fall that many currencies will be destroyed
if you like analysis with me. Join me and make a profit to message me or comment
I put 7 new analyzes I will let you see all the analysis to pay attention to the analysis dates and do not harm

BITCOIN/USD 1DAY UPDATE BY CRYPTO SANDERS !! Hello, welcome to this BITCOIN /USD update by CRYPTO SANDERS.
CHART ANALYSIS:-Bitcoin ( BTC ) moved to a fresh five-month high earlier in the session, as markets reacted to Tesla’s latest quarterly earnings report.
The report, which was released after yesterday’s closing bell, showed that the electric vehicle maker did not sell any of its bitcoin.
Following the news, BTC/USD raced to a high of $23,722.10, hitting its strongest point since August 17 in the process.
Looking at the chart, the move saw BTC once again break out of a ceiling at $23,500, and this comes after colliding with a floor at $22,500.
Earlier gains have somewhat eased, with the 14-day relative strength index (RSI) back in overbought territory.
As of writing, the index is tracking at 80.77, with a support point at 78.00 the next visible target.
I have tried to bring the best possible outcome to this chart.
Hit the like button if you like it and share your charts in the comments section.
Thank you

BITCOIN DOMINANCE UPDATE BY CRYPTO.SANDERS !!Hello, welcome to this BITCOIN dominance update by CRYPTO SANDERS.
CHART ANALYSIS:-BTC DOMINANCE A small update on BTC dominance that is pumping up BTC. usdt.d similarly dumping btc dominance which is forcing btc peers to dump older coins btc has created support by breaking the local resistance zone next target of btc dominance may go from 47% to 49% this strong resistance level btc is from here dominance job will be rejected in bottom trade so btc altcoin is going to give very good rally so we will do some update by entering btc pair coin and spot it. thanks for reading my update
I have tried to bring the best possible outcome to this chart.
Hit the like button if you like it and share your charts in the comments section.
Thank you

Bitcoin 200ma Buyers and ShortersIn the history of bitcoin, the 200ma on the weekly has been a good place to buy before a great rally upwards. This time, buyers of the 200ma weekly were in loss to about 30.5%. Shorters of the 200ma weekly got a 2R trade. Price is now at their entry again. This is tracking the long entries that have been waiting for a significant rise since the drop.
R is risk. The number in front is the multiple of that risk. Risk is calculated by how much price goes in the opposite direction of your bias after your entry, before finally going in your favor. This is the concept of actual risk.

BTC & ETH Comparison where the rally will stop ?Hello Everyone,
Welcome Back, Well We anticipated the region for Ethereum to short around 1350 1370 but now as per the Footprints and Positive Delta,
we come to know that Ethereum might stay in this range and try to flip it into support for further continuation towards 1500$
having said that there is high possibilities that BTC might do the same as Ethereum did.
So far so good no sign of weakness has been spotted in both charts, so becarefull while you shorting an uptrend
patience is the name of the game
Disclaimer :
All information is only for educational and entertainment purpose , do paper trades only.

Bitcoin is getting stuck within the narrow rangeBitcoin is getting stuck within the narrow range, manifesting a neutral trend. It currently trades near $17 200, which is slightly below the range's upper bound. In the big picture, we continue to be bearish on Bitcoin. However, the lack of a trend makes a case for both scenarios, bullish and bearish. Therefore, we will pay close attention to the price action and setup we introduced a while ago (displayed in Illustration 1.01).
If the price breaks above the range, then we may expect a short-term rally. Though, in such a scenario, we do not expect it to impact the primary bearish trend. At best, we can imagine BTCUSD rallying to $20 000 (but we are very skeptical about that). Therefore, if a breakout to the upside occurs, we will monitor volume and look for signs of exhaustion. Contrarily, a breakout to the downside will bolster the bearish case, potentially leading Bitcoin to new lows.
In addition to what we stated, the bullish case can get additional support from the stock market (if it continues higher), providing a temporary lifeline for cryptocurrencies. However, if that happens, we once again expect it to be only short-lived. With that said, we maintain our price targets for Bitcoin at $15 000 and $13 000.
Illustration 1.01
The picture above shows the daily chart of BTCUSD and a series of breakouts from the narrow range with subsequent invalidations; the range grows in significance.
Technical analysis
Daily time frame = Neutral
Weekly time frame = Neutral
Illustration 1.02
Illustration 1.02 shows simple support/resistance levels for BTCUSD.
Please feel free to express your ideas and thoughts in the comment section.
DISCLAIMER: This analysis is not intended to encourage any buying or selling of any particular securities. Furthermore, it should not be a basis for taking any trade action by an individual investor. Therefore, your own due diligence is highly advised before entering a trade.

ETH - Lesser of the Two Crypto BearsCrypto winter is here. Is this the darkest before dawn? Or the start of a long artic winter ahead?
In such nebulous times, directional bets are rife with risks. In contrast, spread trades vastly lowers risk while enabling limited but durable returns.
Set against the current macro backdrop and landscape shift in the industry, this case study will argue that Ether exhibits greater price resilience relative to Bitcoin prices.
Accordingly, a long position in CME Micro Ether Futures combined with a short position in CME Micro Bitcoin Futures provides an opportunity to extract yield in a bearish market.
Spread entry at 0.0721 with a target at 0.0793 delivers a reward to risk ratio of 1.88 with returns of $1,660. A stop loss of 0.0684 will limit losses from the spread trade to $880.
A RESILIENT ETHER?
Crypto winter plus recession fears in major economies will keep crypto prices subdued with continuing downside pressure.
After a successful massive upgrade last year, the Ethereum blockchain reduced its carbon footprint. Next big enhancement is the Shanghai upgrade expected in March. This upgrade enables withdrawal of staked Ether representing ~13% of the entire supply.
Staked Ether withdrawal will be gradual. Even though this might increase selling pressure, it will be less so relative to what Bitcoin faces as described below.
GBTC LINKED BITCOIN SELLING PRESSURE
Last November, Genesis (a major crypto lender) halted withdrawals citing a $1 billion shortfall. Genesis is looking to avoid bankruptcy filing. Its bankruptcy could spell contagion in crypto markets accelerating selling pressure.
Genesis’ parent company Digital Currency Group ("DCG") operates the Grayscale Bitcoin Trust. Grayscale’s flagship product GBTC has suffered sharp sell-off resulting in a staggering 45% discount to NAV presently.
Grayscale’s attempt to convert GBTC to a spot BTC ETF allows them to rebalance their holdings to narrow the discount. But their application to transform into an ETF has been denied by the SEC. Grayscale is appealing against the SEC’s decision in court with an outcome anticipated this quarter.
If the ruling goes against them, Grayscale plans to offload up to 20% of GBTC shares leading to sales of 128,000 bitcoins which will send its prices tanking.
BITCOIN MARKET CYCLES – WILL HISTORY REPEAT? PERHAPS NOT.
Crypto winter is not new. Previous winter cycles of extended periods of subdued price action were followed by massive bull rally. Hope springs eternal but this time could be different.
Bitcoin as an asset class will face recessionary environment for the first time ever. Unlike in 2018, long term holders (>1Y) have not moved their holdings this time around but hold massive losses on their portfolios down some 50% to 80% which could aggravate bitcoin downside pressures when selling begins.
POOR FUNDAMENTALS BUT NEUTRAL TECHNICAL SIGNALS IN BITCOIN
Bitcoin’s long-term moving average has served as a strong resistance and continues to be in a downtrend.
Falling realised volatility points to a sideways market with limited liquidity and leverage. Declining market volume vindicates that. Orange Fibonacci retracement level which proved to be strong resistance also coincides with the pivot level P could be challenged once the Grayscale-SEC court ruling is out later this quarter.
ETHER TECHNICALS POINT TO A SIDEWAYS MARKET DESPITE OUTPERFORMANCE OVER BITCOIN
Ether has remained highly correlated with Bitcoin for the past two months. The long-term (100-day) moving average has served as a weak resistance as Ether broke through this level during November. The long-term moving average has become flat over the past two months in sharp contrast to a bearish one for Bitcoin.
In the previous period of low HV (October to November), Ether outperformed Bitcoin by a stunning 22%.
Stochastic for both Bitcoin and Ether point to oversold levels.
OPTIONS MARKET FAVORS ETHER OVER BITCOIN
Bitcoin has a put/call ratio of 2.5 on the CME in sharp distinction to Ether’s put/call ratio of only 0.8. On Deribit markets, put call for Ether is two-times lower relative to Bitcoin. Options traders clearly favor Ether over Bitcoin.
TRADE SETUP
A spread position of long CME Micro Ether Futures and short CME Micro Bitcoin futures.
Spread trades require notional values of each leg to be equal. Each contract of CME Micro Ether Futures and CME Micro Bitcoin Futures both expiring in Feb 2023 provides exposure to 0.1 Ether ($120) and 0.1 Bitcoin ($1,665), respectively.
Fourteen (14) lots of long positions in CME Micro Ether Futures will provide a notional value of $1,680 to offset one lot of CME Micro Bitcoin Futures which has notional $1,665.
Entry: 0.0721
Target: 0.0793
Stop Loss: 0.0684
Reward/Risk Ratio: 1.88
Profit at Target: $1,660
Loss at Stop Loss: $880
MARKET DATA
CME Real-time Market Data helps identify trading set-ups and express market views better. If you have futures in your trading portfolio, you can check out on CME Group data plans available that suit your trading needs www.tradingview.com
DISCLAIMER
Trade ideas cited above are for illustration only, as an integral part of a case study to demonstrate the fundamental concepts in risk management under the market scenarios being discussed. They shall not be construed as investment recommendations or advice. Nor are they used to promote any specific products, or services.
This material has been published for general education and circulation only. It does not offer or solicit to buy or sell and does not address specific investment or risk management objectives, financial situation, or particular needs of any person.
Advice should be sought from a financial advisor regarding the suitability of any investment or risk management product before investing or adopting any investment or hedging strategies. Past performance is not indicative of future performance.
All examples used in this workshop are hypothetical and are used for explanation purposes only. Contents in this material is not investment advice and/or may or may not be the results of actual market experience.
Mint Finance does not endorse or shall not be liable for the content of information provided by third parties. Use of and/or reliance on such information is entirely at the reader’s own risk.
These materials are not intended for distribution to, or for use by or to be acted on by any person or entity located in any jurisdiction where such distribution, use or action would be contrary to applicable laws or regulations or would subject Mint Finance to any registration or licensing requirement.

new analysisIt's really hard to explain this
but we have a slight downpour, and then about 1 month to 45 days the market is bullish , and the altcoin will grow between 100 and 1000%, currencies with high market caps like Ethereum 100% and currencies with low market caps up to 1000%,
and then we have a terrible fall that many currencies will be destroyed
if you like analysis with me. Join me and make a profit to message me or comment
I put 7 new analyzes I will let you see all the analysis to pay attention to the analysis dates and do not harm


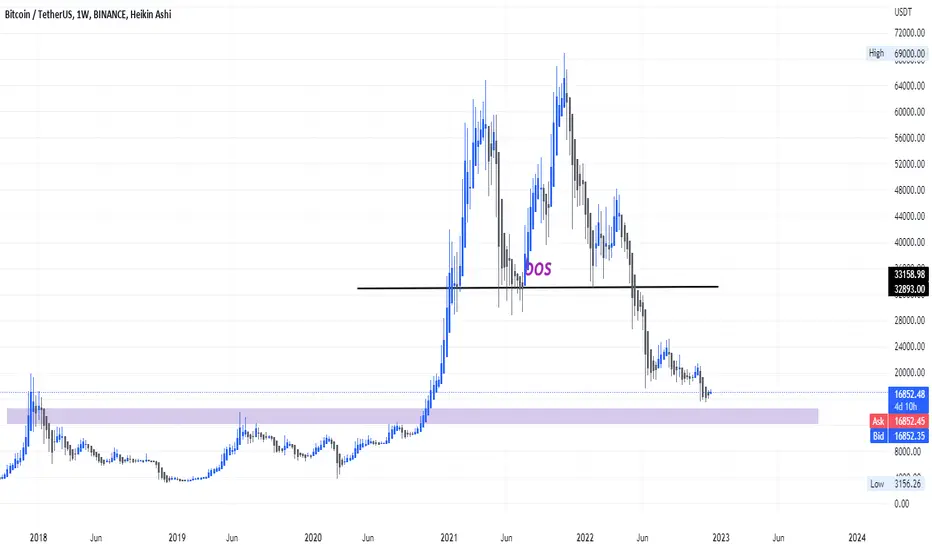
BITCOIN / TETHERUSBITCOIN / TETHERUS
Strong and good landing of bitcoin and likely to continue the drop to the lowest points, the most important of which is the historic demand area. We can also see the drop and the re-climb and build a new path
The ECB's strong message, dovish FED, and a high alertYesterday, Bitcoin broke above the 17 000$ price tag in spite of a strong message coming out of the European Central Bank (ECB). The official Twitter account of the ECB tweeted that the price of Bitcoin is artificially held up (at the moment) and that soon it will embark on a journey to irrelevance. This is an unusual statement from the European officials, leaving us only to speculate about the workings behind the veil. Therefore, this message puts us on high alert.
The actual message from the official Twitter account of ECB:
"The apparent stabilisation of bitcoin’s value is likely to be an artificially induced last gasp before the crypto-asset embarks on a road to irrelevance. #TheECBblog looks at where bitcoin stands amid widespread volatility in the crypto markets."
Meanwhile, on the other side of the world, Jerome Powell said during his speech that as soon as in December 2022, the pace of rate hikes might slow down. Despite this being nothing new, the market sought a pivot in Powell’s statements and rose across the board. However, the market discounts the fact that interest rates are here to stay for much longer than initially thought. Additionally, the market participants seem to ignore that rate hikes will continue to increase, putting more pressure on debt servicing and the overall economy.
As a result, we expect the bear market to continue to unravel and drag prices of cryptocurrencies and stocks much lower over time. Accordingly, we maintain our price targets at 15 000$ and 13 000$.
Illustration 1.01
Illustration 1.01 displays the daily chart of BTCUSD and two simple moving averages in a bearish constellation. The yellow arrow indicates the price retracement above the 20-day SMA, which often coincides with corrections and is bullish for the short term. Now, the 20-day SMA acts as a support level; meanwhile, the 50-day SMA acts as a resistance level.
Please feel free to express your ideas and thoughts in the comment section.
DISCLAIMER: This analysis is not intended to encourage any buying or selling of any particular securities. Furthermore, it should not be a basis for taking any trade action by an individual investor. Therefore, your own due diligence is highly advised before entering a trade.

Bitcoin bottom, people leveraging up, and systemic failuresOnce again, we notice calls for the market bottom all over the place. As if it was not enough, we also see a barrage of statuses on social networks with claims from people about mortgaging their houses, selling cars, and getting loans… only to get on this “lifetime” opportunity in Bitcoin.
However, we would like to stop for a second and take time to realize how irrationally bullish the sentiment has become. The FED is set to slow the pace of rate hikes; however, it will not reverse the course in monetary policy. The interest rates will continue to climb, and payments on the debt will climb with it. Over the coming months, people trying to leverage the current situation might end up in a precarious place, being forced to sell their holdings because of improper money management.
With that said, we doubt the market bottom is in. Despite that, risks associated with shorting are immensely bigger than a year ago. The potential for the downside in percentage terms might still be relatively high, but this also applies to the potential of missing out on a bottom, which is exactly what causes many people to slide into “FOMO” mode (subsequently sparking big swings up and down in BTCUSD).
Problems in the system continue to persist, with many troubled financial institutions amid the downfall in the cryptocurrency market. We do not expect these issues to be resolved in a blink of an eye. Contrarily, we believe more companies might still end up declaring bankruptcy, further risking more systemic failures (and a drop in the price). Accordingly, we remain bearish on Bitcoin, and our price targets stay at 15 000$ and 13 000$.
Illustration 1.01
Illustration 1.01 displays the daily chart of BTCUSD and two simple moving averages. The yellow arrow points to the 20-day SMA, which we pointed out numerous times in our article and outlined as a natural occurrence. The 20-day SMA acts as a resistance, and if it is broken to the upside, it will be bullish (the same applies to the 50-day SMA).
Technical analysis - daily time frame
Stochastic points to the upside. MACD is neutral. RSI is neutral. DM+ and DM- stay bearish. Overall, the daily time frame is turning neutral, potentially foreshadowing a further uptick in Bitcoin (in the short-term).
Illustration 1.02
The image above portrays the weekly chart of BTCUSD. The red arrow shows the decline in volume for the past three weeks, hinting at a decrease in selling pressure.
Technical analysis - weekly time frame
MACD is turning neutral. RSI and Stochastic stay bearish. DM+ and DM- are bearish. Overall, the weekly time frame is bearish.
Illustration 1.03
The picture above shows the monthly chart of BTCUSD. The yellow arrow indicates low monthly volume.
Please feel free to express your ideas and thoughts in the comment section.
DISCLAIMER: This analysis is not intended to encourage any buying or selling of any particular securities. Furthermore, it should not be a basis for taking any trade action by an individual investor. Therefore, your own due diligence is highly advised before entering a trade.

BTC possible moves BTC expected moves, let's see how it comes, i think BTC will touch it's last support
