BTCEUR

BTC/USDT WeekLyBitcoin is the world’s first decentralized cryptocurrency – a type of digital asset that uses public-key cryptography to record, sign and send transactions over the Bitcoin blockchain.
Launched on Jan. 3, 2009, by an anonymous computer programmer (or group of programmers) under the pseudonym “Satoshi Nakamoto”, the Bitcoin network (with an uppercase “B”) is a peer-to-peer electronic payment system that uses a native cryptocurrency called bitcoin (lower case “b”) to transfer value over the internet or act as a store of value like gold and silver.

No skinny dipping yetHi folks!
First - as I like to update on my positions (because you should never trust anyone who do not put their money where their mouth is - and Tradingview should definitely have a "Proof of Position"-feature:
I got liquidated on one of my shorts (46.3k, SL 52k, TP 30k) - equivalent to a 0.9% loss of my total free equity portfolio. I still hold the (49.5k, SL 56k, TP 30k) short and added an even larger (52.5k, SL 56k, TP 30k)
short. I am currently short BTCUSD for about 2.5% of my free equity portfolio.
In my opinion, we are in a massive financial bubble that will eventually burst - even from a Black Swan or (most likely) due to (possibly some combination of) very highly probable factors such as liquidity decrease and less complacency. This has - as you mave have seen from my ideas for the past couple of months - convinced me that the best thing you can to is to sit it out, bet on volatility and possibly enter some short positions
is a possibility arises, although with a proper risk management strategy (see the Kelly Criterion).
Now, as I have stated multiple times, I am mostly trading VIX futures these days in the since that I buy big amounts of short term future contracts (you can do this through ETFs such as VIXY/VXX etc for simplicity, but you should definitely understand the math before you jump into this - which holds for all investments). However, the grim technicals in BTCUSD - especially the volume divergence - has made me enter short positions for the last month. After the fact, you may say I was too early or placed a too tight SL on my first short, but this is a probabilistic game and you lose sometimes - also, the tight SL is often a bad idea in crypto markets unless you are a scalp trader. Also, if you have the opportunity to enter volatility contracts for a good price (not binance vol options!), that might be better than shorting.
Now, I have marked concurrent divergences in RSI and MACD on the daily as buy (long)/sell (short) signals with a price range until the next opposite indicator. As you can see, this simple indicator has yielded massive gains at all signals this year (given that you held the entire position until an opposite signal appeared, which is not recommended due to the change in expected value, and also required you to hold a loose SL at some occasions). This indicator - especially coupled with a volume divergence (which is arguably the most important) - hold up very good historically in both directions. Just check for yourself if you do not believe me.
We also saw a first rejection off the what was the support line of the broken ascending wedge today, and the singal is confirmed on up until 4h - if this continues to hold throuhgout the dayly candle, it is another important indicator that supports the sell signal based on the stated triple DIV.
For the record, I am a huge believer in blockchain technology, and I also own some staked DOT and ETH. I also plan to place the potential profit of my shorts and/or volatility bets in crypto (in addition to real assets)
if I am right - I just think this is a terrible risk/reward environment where the expected value is higher on the short side than the long side in both the U.S. stock market, bond markets and crypto.
DYOR.
NFA.
Never take the words of others as a given, and never take advise from one some without skin in the game.
I wish you all well :)

btcusd more and more like break out in 2020 Jan or MayNext week we will see where we are A or B
This is break out like 2020 Jan or May it is still and indicator of a new bull rally with even more potential gain up to 5x BUT
The question is to FOMO now at 51k CASE B
Or there will be another 50% crush CASE A before the real rally.
Taking into account that tomorrow ElSalvador will start the use of Bitcoin as official payment and most possibly there will be a lot of problems, bugs, like it is in case of any innovation.
I am more than sure many big money maker will fight to discredit the bitcoin use in ElSalvador - simply selling big amout of all possible cryptos to create panic.
So I think we will have a good chance to enter at -50% discount in September.
But it is 50/50 Chance, so I am 50 in FIAT and 50 in Crypto.
FIAT I need only in case the DIP happens, otherwise I will FOMO if price will stay around 51k all the September, as of it will mean CASE B.

Be Prepared For Bitcoin To Go PARABOLIC MartyBoots here. I have been trading for 14 - 15 years and I am here to share my ideas with you to help the Crypto space.
Bitcoin & ALT Coins are Setting up for a HUGE bounce and we in CryptoCheck intend to make lifechanging money
------------------------------------------------------------------------------------------------------------------------------------------------------------
If you want help trading Bitcoin or any other ALT coins hit me up , We will improve your trading . Have a look at the link below
------------------------------------------------------------------------------------------------------------------------------------------------------------

Upcoming BTC Short!Here we have a weekly BTC chart where we can see a lovely .61 fib retracement and a trendline touch and we are now expecting downfall.

BTC/EUR - Supply Zone WicksPrice returned to the .382 of the iH&S Break Target, a Supply Zone has formed as resistance with 3 upper wicks.

BITCOIN - Was This All A Bear Market Rally?Taking a look at the Bitcoin daily chart, I cannot help but cringe at the picture I see. We had a very strong rally back to $50k after our 50% fall from the high at $65k. But you can see the price action rounding as it approaches the neckline of the previous high, which to me means the bulls are either exhausted or taking some time before moving on up. However, I think their is more evidence at the moment in support of a bearish reversal here. We have been rejected twice now by the $50k level which could potentially be a double top bearish pattern. You can also see the daily sell wick forming from yesterday's pump. I think if we fall back below the purple support area, we can confirm this was a bull trap and need to consider changing gears from bullish to bearish. The potential downside from here could be big and I will be taking the necessary precautions to protect my investments. Dropping to the $40k level could set up a massive head and shoulders pattern which would take us down to $16k-$18k. That is a worse case scenario, but a plausible one, especially considering Bitcoin's proclivity for dramatics.
In terms of the alt market, I don't think I will be making many shorts given how bullish they are against BTC. We could have a December 2017 - January 2018 flip between Bitcoin and the alts where the alts break their usual behavior pattern and follow Bitcoin's lead. If this is the case, I will be looking for ALT/USD entry points when Bitcoin hits its lows and hoping for strong alt spikes when it moves sideways. We will see. Stay tuned!


Bitcoin $190k Target MartyBoots here. I have been trading for 14 - 15 years and I am here to share my ideas with you to help the Crypto space.
Bitcoin & ALT Coins are Setting up for a HUGE bounce and we in CryptoCheck intend to make lifechanging money
------------------------------------------------------------------------------------------------------------------------------------------------------------
If you want help trading Bitcoin or any other ALT coins hit me up , We will improve your trading . Have a look at the link below
------------------------------------------------------------------------------------------------------------------------------------------------------------
Not saying there cant be dips but the longer term trend is saying we go UP

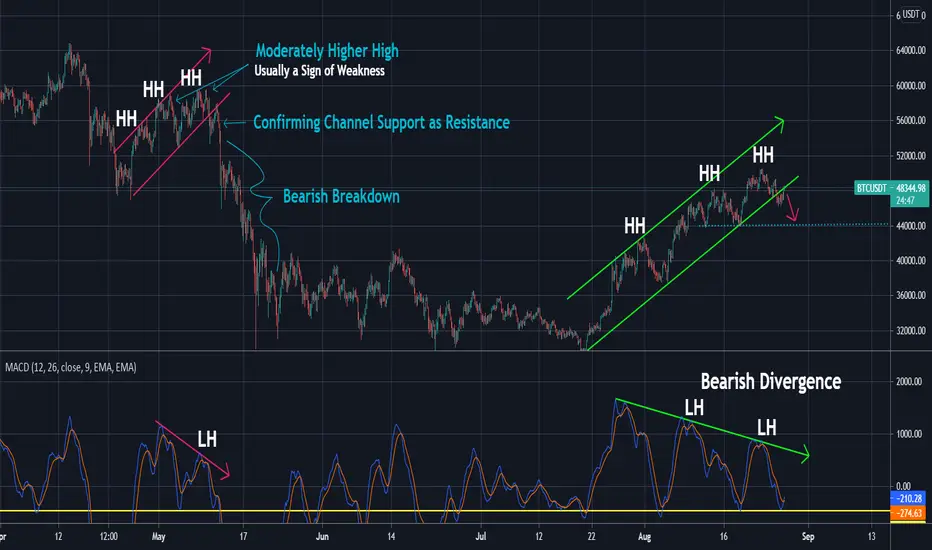
BITCOIN - Potential Breakdown After Breaking Out of Its Channel BTC fell out of its bullish ascending channel which catapulted it from $29,000 to $50,000. It is currently testing the bottom of the channel which was support, but is now acting resistance. You can see the similar channel breakdown that Bitcoin completed in May to the left. Typically this results in further movement to the downside. Bitcoin has been very bullish of late and could very well blast through this resistance and back to the channel. It's important to consider it as a possibility. But with the bearish divergence on the MACD and breakdown from the channel, it will likely head down to the next strong support area at $44k. From here, we'll assess it's strength or weakness to determine its direction.
Still short - Sorry for being repetative...Just see my linked posts - I won't repeat myself again (except for the broken trend line).
Still SL 52/56k TP30k from 46300/49500 for me.
DYOR.
NFA.
Never take the word of other as a given - and never take advise from someone without skin in the Game.
I wish you all well!

Technical analysis update: BTCUSD (25th August 2021)Many people asked us to analyze cryptocurrencies. Therefore we prepared our first bitcoin analysis for you. Recently bitcoin took off its recent lows around 29 000 USD. In the process it closed a gap between 46 620 USD and 48 370 USD. After that bitcoin peakead at 50 858 USD and then reversed lower. We think price level along the gap has an important role. We think if this gap is retraced by price back to the downside then more selling is probable for BTC. In terms of technicals RSI continues to move sideways just below 70 points. It did not cross 70 points to the upside. This is common for corrections in the strong downtrend. MACD is flattening out and it seems as if it wanted to reverse down. In addition to that price is currently far away from its 20-day Simple Moving Average. We think there is high likelihood that price of bitcoin peaked recently (or it will in the short future - around 54 000 USD) and more selling is on a way. If price breaks below its short term support then we expect bitcoin to retest its recent lows around 29 000 USD.
MACD on daily timeframe:
Disclaimer: This analysis is not intended to encourage any buying or selling of any particular securities. Furthermore, it should not serve as basis for taking any trade action by individual investor. Your own due dilligence is highly advised before entering trade.

BTC analysis+rising wedge
+bearish div
+5 green weeks in a row
+price is at 0.618 area = resistance
bulls might be tired... bears are in control in my opinion
YOUR LIKE OR COMMENT IS MY FUEL FOR NEXT ANALYSIS :) IF U HAVE ANY QUESTION REACH ME HERE
This is not a financial advice. Always do your own research and always put stoploss in your trade (SL) :) If you want more detailed info how to study and read charts or just need help with some coin, just write to me here a comment, i will try to answer to everybody... i can help you :) all for free, don't worry, BE HAPPY!

BTCUSD - Liquidity & CrashesAm I going to upset a few people?!
You can't deny the fact that liquidity likes to get hunted.
We may be leaving these areas behind for now but that doesn't mean that price won't return to them in the near future!
Let me know what you think in the comments and attack me lol!


BTC to 57K!?!?!?Good Evening all!
Back again for another round of updates this week!
Since we last spoke, we've seen BTC move through the level of Supply we had outlined all last week, with huge upside potential as a result, but we still have some liquidity to the left to overcome ...
Does BTC have the capacity to move to the Zone we all are waiting for?
Let us know!

Triple DIV on Daily as well - Take profit/shortHi folks!
As those of you who have followed my predictions for a while now are aware of, I have a massive bearish bias these days
- while my predictions in the last weeks have yet to become a reality, my stated short positions are still alive and well.
This is first and foremost due to the extremely scary macroeconomic state (and thus fragility of the financial markets),
but also the fact that we have had massive Bearish Divergence on both RSI, MACD and (most importantly) Volume in almost asset classes.
Today, the triple DIV played out in BTCUSD on the daily as well, piling on to my bearishness.
My position placed today is Short BTCUSD at 49500, SL 56000, TP 30000 - adding to my short from 46300 with SL 52000 and TP 30000.
For the record, I also hold over 30% of my portfolio in VIX futures (@VIXY) due to the mentioned macro picture.
The reason is a combination of systemic overvaluation in addition to the fact that liquidity is evaporating from the markets (just check trading volume and decrease in margin debt).
I would state that shorting is a risky business, and that just taking profits and/or buy volatility contracts might be a preferable option here.
I would never recommend shorting to anyone unless one feels extremely confident in the probability distribution and you know how to manage risks -
I just state my position to let you know that I put my money where my mouth is.
DYOR.
NFA.
Never take the word of others as a given - and never take advise from someone who has no skin in the game.
I wish you all well.

BTC ... Volume is still TOO LOW!Evening all!
Back again for our fair share of market updates!
Talking about the PA & market structure in comparison to the low volume levels that we're observing ...
Let us know what you think in the comments!

Largest ALT Season In History Setting Up?MartyBoots here. I have been trading for 14 - 15 years and I am here to share my ideas with you to help the Crypto space.
Bitcoin & ALT Coins are Setting up for a HUGE bounce and we in CryptoCheck intend to make lifechanging money
------------------------------------------------------------------------------------------------------------------------------------------------------------
If you want help trading Bitcoin or any other ALT coins hit me up , We will improve your trading . Have a look at the link below
------------------------------------------------------------------------------------------------------------------------------------------------------------

btcusd no more bitcoin below 50 000There were many rallies between halvings of Bitcoin but the trend line between halving is holding.
Means there will be no more bitcoin below 50 000 anymore.

Update - Really bad BTCUSD Technicals!Hi folks!
See my previous posts - I just marked the concurrent divergences in RSI and MACD that leads to my long(blue)/short(red) signals.
If someone think the market structure is bullish - please let med know!
My position is the same as in the last post: .
See my linked post regarding the VIX for an idea of a good R/R bet right now*
DYOR.
NFA.
Never take the word of others as a given - and never take advise from someone who does not walk the talk!
I wish you all well!
