BTC: Long Idea (Consolidation Phase) - Aug. 21, 2020This is a BTC long idea that we believe can bring BTC to higher levels on the weekly chart just based on the parallel channel that it has created. Nevertheless, we still believe a slight pullback would be helpful for BTC's continuation to all time highs.
Trade Safe.
BTCEUR

BTC: Short Idea (Alt Season Imminent?) - Aug 21, 2020BTC can be seeing a correction if this gravestone DOJI comes into play. This can be a possible opportunity for bears to take over the situation and drive price down to our major fib level at around $9,800, which lines almost perfectly with our previous CME gap that we mentioned at $9,700 USD.
We would like to make sure everyone know that a retrace to sub 10K levels would be actually a very healthy thing as it would fill the void for BTC's notorious CME gap, and also give a chance to retest support before the next big swing up to new highs.
Trade Safe.

btceur Ascending triangle formed. Break out will set directionAscending triangle is formed in Bitcoin chart.
Breakout in this week will be the decision maker and set the direction where the travel goes.
Break above 10500 €uro ~ 12500 $ will start the pump rally.
Will bitcoin not hold the 10000 till Monday, the crush will start.

Bitcoin Can Explode Higher - Be Prepared + Make Money MartyBoots here. I have been trading for 13-14 years and I am here to share my ideas with you to help the crypto space.
I think it would be a bad idea to sleep on Bitcoin right now .
If you want help trading it or any other coins hit me up in the link below or message me

Some things should appear now ..👍
HEY Bitcoin lovers💕
I'm with you again after a long time.I haven't worked too hard on this sketch but I wanted to share with you because it's a thought I have been claiming for a long time.I will share the 4 hour signals with you.Your motivated likes will make me happy. Plenty of earnings for all..

Bitcoin: Possible retrace to fill the CME Gap? (Aug. 19)X Force provides quality content provided by experienced traders who would like to make charting more simple for the general public. If you love our content, please make sure to give us a 'like', we would highly appreciate it.
BTC is currently facing two scenarios and has been hit with a wall of resistance at 12K levels. A breakout occurred in the previous days, but that has printed a new rising wedge which is now considered to be semi bearish and may bring the bears back in control to drive price back down to the CME gap we have mentioned previously. Please have a look at why CME gaps are truly important in BTC price action in our previous analysis:
Bullish case:
1. BTC would break out of this rising wedge, and recover from yesterday's drop - we must stay above 12K.
2. A major trend reversal back into overbought territories is needed for breaking last years (2019) high.
Bearish case:
1. Currently bears seem to be trying to take semi-control of the situation with this rising wedge that we are seeing in our chart. This can mean a breakdown would confirm a small downtrend in the short term and 12K stays as minor resistance for the time being.
2. A break below 11K is setting up a higher probability for the CME gap at 9.7K to be filled faster than we anticipated.
Here's a previous analysis why we think Bitcoin is on a bullrun on the LONGER timeframe:
Either way, Bitcoin seems to be bullish in our long term perspective, and we believe that whatever position you take, our analysis is showing that you can profit both from a shorting and longing perspective.
Trade Safe.
X Force.

BTC/USD BITCOIN - SWING - 19. AUGU. 2020Hello Traders Welcome Back.
***
Here is the full analysis for this pair, let me know in the comment section below if you have any questions, the entry will be taken only if all rules of the strategies will be satisfied. I suggest you keep this pair on your watchlist and see if the rules of your strategy are satisfied.
***

btcusd rally if price will hold above 10000 for 4 more Weeks There are only 49 Days every year when one can sell bitcoin above 10 000.
If this time it will hold longer than 49 Days, then this would be a new rally to new ATH highs.
Otherwise there will be a crush till 4000

Bitcoin: Understanding CME Gaps - A Full Perspective and GuideX Force Global Analysis:
If you find our analysis to be helpful, make sure to support us by dropping a ‘like’
------
In this analysis, we take a look at Bitcoin's rather peculiar tendency to fill CME gaps. What are CME gaps, and why do they occur?
First of all, Bitcoin does not trade 24/7 on one specific market, which is the CME market. This means that at a certain point in the day, the market closes and trading stops altogether - just like in traditional stock markets.
When looking at these CME gaps, an investor might conclude that they will be filled quickly within the next few days. And based on this reason alone, many traders will take a long or short position based on the gaps produced. If a gap is produced while price is moving up rapidly, a trader might conclude on taking a short position with the notion that the gap will eventually fill. While this is fundamentally true and a good trade setup because gaps have traditionally filled 100% of the time via Bitcoin's history, it can be still dangerous if the trader does not know how to execute the trade properly, especially if the trader is in a leveraged position. A basic understanding of major trend shifts, then taking CME gaps into the trader's strategy is a recipe for success.
From a technical stand point, when a gap appears within the charts, it removes the immediate support or resistance and creates the tendency for most traders to notice this, which may be the reason why the new tradition of 'gap filling' has been a part of Bitcoin's price action since the introduction of the CME market. Either way, if price action moves further away from the gap, the higher probability of a stronger drop/pump will be, which may or may be bad for both bulls and bears.
For our viewers sake, we have done the calculations to show 2019's high to current price on how long it has taken to fill. The average has been 63 days.
Will Bitcoin's CME gap be filled before we reach new highs? Or will we see the gap fill, then run towards new highs? We leave that up to you.
How to trade CME Gaps?
Trading CME Gaps can be very tricky, especially if you take a position too early. As we have stated earlier, all of Bitcoin's CME gaps have been filled 100% of the time. This current gap we are seeing may be no different. It's a matter of WHEN, not IF. With that being said, the best possible way to trade this is to understand basic support and resistances. We are currently facing strong resistance at 12K, and if broken, we face the possibility of a longer wait time for the gap to be filled. This can be a good or bad thing:
Good: BTC will be breaking major legacy resistances, and show sign of growth in the immediate future.
Bad: BTC will be further deviated away from the current CME gap below major psychological resistance at 10K, and may further put bulls in disparity once the gap does fill.
Bitcoin has retested major trend support technically twice, and it may desirable to retest it a third time before we can show true strength in BTC's trend. This can mean a longer accumulation phase and an possible impulse waves that will make Bitcoin's drop more severe based on our CME gap theory.
Trade Safe.
X Force.

BTC ANALYSIS AND FORECAST FOR THE NEXT WEEK The bitcoin will go down to touch the black trendline,
Please share with me your thoughts,
Regards


BTC/USD : Falling into force buyingBitcoin needs to fall into the purchasing power zone in order to rise again to stronger levels

Bitcoin - Bullish, Bearish, and Neutral Scenarios Played OutHey team! As I was charting on the different time frames, I wanted to give my thoughts on the bullish, bearish, and neutral scenarios of Bitcoin and what it could mean for the market as a whole.
BULLISH SCENARIO
First, let's start with the bullish scenario and point out the obvious bullish triangle in blue. Notice how I placed my support lines on the candle bodies of the price action? I did this to emphasize the buyer support creating those wicks on the price. Buyers are scooping up cheaper BTC every time it dumps. To me, this is the real support area and strengthens the case for the bulls. The price action in the short-term, however, is far from bullish. If we continue to the downside I think $11,000 will be the bulls area of support. This area is right in line with the pink uptrend that has support BTC and pushed it higher. Given Bitcoin's demonstrated buyer support on lower prices, I think a bear trap could likely outcome so be aware bears! Bitcoin is in a bullish uptrend and it broke the All-Time HIgh resistance, a trend it has never broken. Sticking with the trend, the bulls have the advantage.
NEUTRAL SCENARIO
Let's be honest, Bitcoin can't grow forever. And as Bitcoin has been going sideways, the alts have been jumping and showing the best signs of life since 2017. I think that Bitcoin remains sideways and above the All-Time High trend, this is bullish for the alt market. If BTC starts moving into Bullish or Bearish territory, it might be best to leave the alts and stick to BTC or USD.
BEARISH SCENARIO
The situation that Bitcoin currently finds itself in, however, is a great chance for the Bears to take the reins and push BTC lower. I see a big head and shoulders pattern with a head height of $1,000. The reason $11,000 is a key area for the Bears is because this is the neckline for the HS pattern and it's also where the pink uptrend is acting support. If this were breached, the All-Time High trend would be the last hope against the bears. If this head and shoulders pattern were to complete, its target price would be around ~$10,100 which is well below the all-time high trend. Bitcoin has been following the DJIA . Be aware that a crash in the stock market would likely cause the Bitcoin market to follow suit. I am most definitely keeping my eye on the DJIA and other indices in case another April dump comes. If it does, I will have my bear hat back on and will be shorting the market hard.
My bias: I am biased to the bullish/neutral scenarios at the moment. It's hard to favor the bears with Bitcoin being so bullish. Although I know the stock indices will soon crash and I believe it will take the crypto market with it, I have to stick with the trend until the bears demonstrate they're a threat. So until then, MOON BITCOIN MOON!

BTC/USD : On the upsideBitcoin is heading to rise 12995 when it broke resistance that became a new support.

How To Make Life Changing Money In Crypto MartyBoots here. I have been trading for 13-14 years and I am here to share my ideas with you to help the crypto space.
This market is going to EXPLODE higher and we are all going to make life changing money
If you need help trading it let me know , hit me up

Bitcoin Idea IntradayIdea for bitcoin intraday
Could be a bear flag or a symmetrical triangle you decide
Heavy clusters around 0.5 and 0.382
I'd buy


SHORT TERM: ASCENDING TRIANGLE ON BTC/EURIN THE SHORT TERM WE COULD SEE A CONTINUATION OF THE TREND. IF WE BRAKE TO THE UPSIDE WE CAN EXPECT A PRICE TARGET OF €10165. HOWEVER, WE CAN ALSO EXPERIENCE STRONG RESISTANCE AT THE 0.5 FIBO LEVEL. IF WE BREAK DOWN WE COULD REACH A PRICE TARGET OF €8900. THIS PERFECTLY COVERS WITH THE STRONG RESISTANCE OF $10500. HOPEFULLY, WE CAN TURN THIS RESISTANCE INTO SUPPORT... WHAT DO YOU THINK?

Long Bitcoin Nearterm (2% Allocated) My position in this is around 2% of my account. I have no connection and don't follow it-- there's plenty for yall on here--either way it's a great way to shown a disdain for the U.S. gov't spending. With the more trillion dollar fiscal stimulus that get's injected, why fight gold or bitcoin , as they are looked at as alternatives. However, until bitcoins market cap i above $500b, it won't take it seriously. It's just a easy way to speculate with no more than 2% of my account. Do not speculate on this with more than 2% of your accounts value, as it's not a "currency", and moves sometimes 30% in a day. (which takes something like gold a few months to go down -17%).
13:25:48 (UTC)
Tue Jul 28, 2020

ridethepig | The Nature of the Work Breakouts and impulsive swings
📌 @ridethepig
June Map
Buyers had the move and played to exchange at the key support lows, which despite the length of compression can also be expressed in an impulsive breakup in no other terms than: Buyers in full control and gunning to take out the highs in the compression range.
I managed to carry out the deeply laid plan towards the second target although it should have been broken on the first test in my opinion as was well within reach. I see no other ending here than for BTC to outperform, the 'ideal asset' for a time when confidence in the public sector is diminishing by the hour.
Things proceed as follows: buyers load the 9012.x lows and accumulation begins. And now that we are finished with this phase we can clear the way for buyers to test 10,800.x into August. Here the only prevention can come from state bans on exchanges although the inevitable outcome in this case would be, as many know, private markets and auctions.
In the swing cooking here, buyers are liberated from the grips of compression, an interesting setup! How keenly will buyers attempt to achieve the ground? Where are sellers stops? Why? For those wanting to further the conversation we can track the inner flows together in the comments below.
Thanks as usual for keeping the feedback coming 👍 or 👎

Is BTC/USD bullish ? Current Daily Chart OverviewHi there,
In my last analysis I commented that there weren't enough reasons to justify that Bitcoin was going to have a bearish scenario soon since the price action was still positive.
I wouldn't be looking for facts like inflated action of the SPX500 to justify Bitcoin is holding very well at 9k levels. For me price is everything, i know this can change very quickly to a bearish scenario if price drops. However, I do not have a crystal ball and i cant be talking about bearish scenario will happen until price movement suggest it.
Daily Timeframe
- Breakout of the triangle formation and testing MA50 in daily timeframe. Price should pullback in 9250 area to make another leg up and stay above MA50. If this happen, then we could have a good LONG entry for futures/margin traders and we could be looking for 10k+ price
- CCI next to enter in a green territory
- RSI higher lows + Breakout
- MACD crossing + STOCH RSI upward movement
- Volume is really TINY. I would like to see more volume in order to confirm upward movement.
Any false breakout and price rejected by MA50 could drive price below 9100$ being dangerous for Bitcoin. Be ready for any scenario if price turns!
Mike

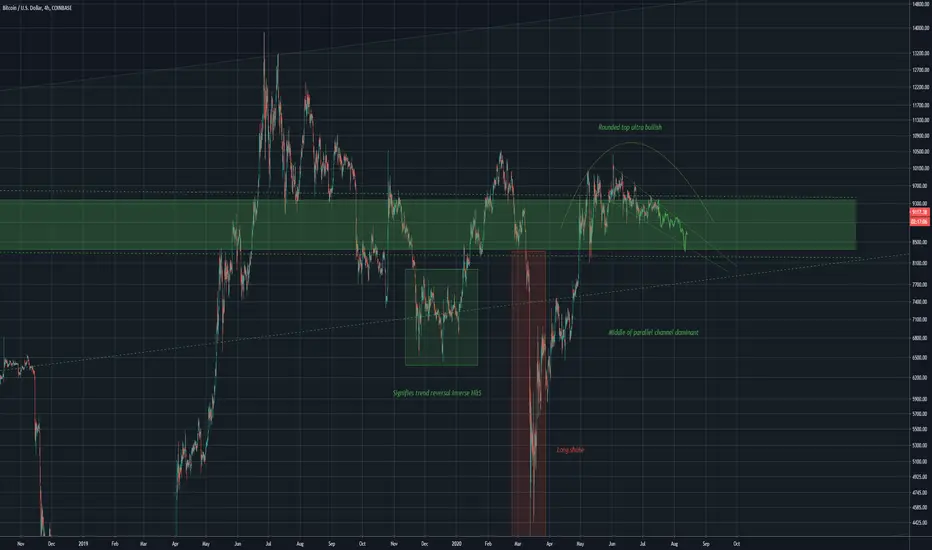
How i see this formation playing out BTCRounded top formation
these formations from experience tend to blow up sharply to the upside once completed
Here is the formation on GAMEBTC and the result
Go long, remove risk!
BTC/EUR distribution patternas we can see BTC vs EURO trap into a descending triangle as a distribution pattern for 4 months. due to this pattern and low volatility we can see, there would be a short opportunity here.
This trade idea has a 2.5 risk to reward ratio.
COINBASE:BTCEUR
