As Bitcoins downtrend ageing.Hello again, as uptrend channel broke in advance of my previous TA, bearish Wickoff developing and DXY is stronger than ever we imagined,
let's see how low this bullish Falling wedge oscillate before breakdown.
I am rather staying neutral on sideways ...I do not think, Stock market bottomed so let's see what near future bring. This will create great long-term opportunities to all of us.
In my opinion, uptrend won't start until September ending. Maybe... Here's some major Fibo levels to watch.That 's why I used 4h chart to monitor.
Take care, Emvo.
*This is not any financial advice.
BTCEUR

Bitcoin - Not worth the current priceOver the past few days, Bitcoin drifted lower toward the 19 000 USD price tag. Because of the persistence of bearish fundamental and technical factors we maintain our price target for BTCUSD at 17 500 USD and 15 000 USD.
Technical analysis - daily time frame
RSI, MACD, Stochastic, DM+, and DM- are all bearish. Overall, the daily time frame is bearish.
Illustration 1.01
The picture above shows the weekly chart of BTCUSD. Two moving averages, 20-week SMA and 50-week SMA, continue to confirm the medium-term/long-term bearish trend.
Technical analysis - weekly time frame
The weekly time frame coincides with the daily time frame. RSI, MACD, Stochastic, DM+, and DM- are all bearish. Overall, the weekly time frame is bearish.
Please feel free to express your ideas and thoughts in the comment section.
DISCLAIMER: This analysis is not intended to encourage any buying or selling of any particular securities. Furthermore, it should not be a basis for taking any trade action by an individual investor. Therefore, your own due diligence is highly advised before entering a trade.

Bullish Scenarios for Bitcoin going into Fed Announcement After the CPI Report was released this morning, everything dumped. However, BTC fully recovered back above support within the bear flag. Most trader sentiment is short and given the oversold conditions, this makes for an ideal contrarian long play until the Fed announcement on July 26th. I have three price areas that I am targeting.
TP 1: $23,000 - top of the bear flag
TP 2: $24,000-$26,000 - Most traders will be holding for $30k, so a reversal here could leave a lot of bag holders
TP 3: $28,000 - $30,000 - The ideal outcome for the bulls. I will probably cash out a little before $30k
The Fed is expected to announce a substantial rate hike to curb inflation, which will likely send all markets tanking. I will be out of this long trade before the 26th. But if BTC fails to this support level, I will exit. We are at an inflection point here at $20k so whichever way we decide to go, we should move quickly.

BTC in depth analysis The most meaningful analysis I have about BTC/USD, both on a technical and a fundamental level. You're welcome.

Nostradamus 101: BTC EUR 3 months aheadThis is an update to the previous forecast see link below.
Based on what we have seen, we are now effectively in a battleground. The same 'big' holders who are on the verge of selling their crypto assets are the same people asking us to HODL.
Bitcoin, I believe in you, but, you are not worth your money. You are worth our money, just not this much, and as the environmental implications become more imposing, so will the
need for regulation, taxation and audit of miners; so will the need for celebrities to turn our attention to another crypto gimmick; so will the need for other distractions cloud our
judgement as those who have pre-mined" spill their guts. Good for them. You got us. Why all this mad nonsense you ask? Because, we are a second away from midnight when it
comes to BTC (in particular), and hopefully it stays "your crazy to say that", but am I? are we? Haven't we read all the books, watched all the movies, seen all the news, learned
about all the shady after 50 years of declassified documents? Haven't we? "You're a conspirator!" Relax, facts are facts, just like the fact that there are closed "open meetings
that happen in Switzerland once a year under a mountain that control the majority of our everyday lives "Haha" You say? One Jeff Bezos will make millions of teens squirm. One Jeff.
And this meeting is no Jeff, possibly worst, possibly better, who knows, what we know, is that we're not in the club, because if we were, money would never be an issue.
Watch out guys, safe trading. Good luck have fun. Peace.

Nostradamus 101: BTC EUR 1 year aheadI made this observation for myself to see what a year in crypto really looks like, let's see how right or wrong one can be, tread carefully. Personally, see it going to 30k, but that is speculation. Safe trading.
#Theywillwanttoflushthemarketbeforerealadoption
#Nothingiseverwhatitseemswhenbigmoneyisinvolved
Divide it all.

Nostradamus 101: BTC Correction goes Brrr until Jan 2023?A global recession is right around the corner fellas (any weekend now we will have a repeat of 2008, but worst), because this time around we all went out of our minds.
We all signed up to the "earnings don't justify the valuation" gig, and now the big boys are cashing out. Same shit different year, different people murdered in the background, but the same ol play.
Nothing is ever what it seems. Watch out. Metals, Food and Energy are possibly your safest bet. DYOR. This is not financial advice. This chart I make for myself to reflect upon.
Looks like correction followed by 3-6 months of sideways action. We'll see. Safe trading.

How BTC Gets To $500k - BE PREPARED MartyBoots here. I have been trading for 16 years and I am here to share my ideas with you to help the Crypto space.
This is how BTC gets to $500k, This will also be when its amazing to accumulate ALTs
BE PREPARED and DO NOT MISS THIS OPPORTUNITY
------------------------------------------------------------------------------------------------------------------------------------------------------------
If you want help trading Bitcoin or any other ALT coins hit me up , We will improve your trading . Have a look at the link below
------------------------------------------------------------------------------------------------------------------------------------------------------------

BTC Hitting Confluence of Support - Possible Reversal AreaTaking a look at the weekly chart for BTC, you can see that Bitcoin is hitting a confluence of support from 1) the 2017 all-time high and 2) long-term uptrend originating from Jan 2015. We are also repeating the same price action fractal from 2017-2020. If this support holds, this could be the ideal entry point for the next bull run. However, a breach of this support area could be very bad for the crypto space. Get your buys ready on the chance we bounce here. Otherwise, I will be looking to re-load much lower.

Bitcoin - BTCUSD due to revisit lows once the rally endsBitcoin's bear market rally shows the first signs of weakness and exhaustion. We still pay close attention to 20-day and 50-day SMAs; in the short-term, BTCUSD may attempt to retrace toward these levels (before breaking down and revisiting lows). Accordingly, we remain neutral/slightly bullish in the short-term. However, in the long-term, we remain bearish. Therefore, we will look for clues hinting at the rally's end.
Fundamental factors
Bearish fundamental factors continue to persist. The prospect of another rate hike by the FED in July 2022 diminishes the chances of Bitcoin's rally continuation. In fact, it threatens global markets and risk assets like cryptocurrencies. The same applies to the economic tightening, which will put substantial pressure on the economy and drag it lower. In addition to that, the upcoming regulation of cryptocurrencies will tighten the market conditions even further. We view mentioned factors as very damaging to the price of Bitcoin.
Illustration 1.01
Volume has declined over the past few days. That is positive for BTCUSD as it hints at the cooling off within the selling pressure. In the short-term, the price will likely attempt to retrace toward its 20-day and 50-day SMAs, representing a correction of the downtrend.
Technical analysis - daily time frame
RSI and Stochastic are bullish. MACD points to the upside. DM+ and DM- are flatenning. Overall, the daily time frame is neutral/slightly bullish.
Illustration 1.02
The total cryptocurrency market-cap remains below 1 trillion USD in valuation.
Technical analysis - weekly time frame
RSI is in oversold territory. MACD, Stochastic, DM+, and DM- are all bearish. Overall, the weekly time frame stays bearish.
Illustration 1.03
The picture shows simple support and resistance levels for BTCUSD.
Please feel free to express your ideas and thoughts in the comment section.
DISCLAIMER: This analysis is not intended to encourage any buying or selling of any particular securities. Furthermore, it should not be a basis for taking any trade action by an individual investor. Therefore, your own due diligence is highly advised before entering a trade.

Bitcoin - Not bullish yetAfter hitting a low near 17 500 USD and reversing back above 21 000 USD, Bitcoin has been trading mostly sideways. So far, it has failed to move above the 22 000 USD price tag, which hints at a loss of momentum within the bear market rally. Despite that, we remain neutral and abstain from setting a price target for BTCUSD. However, we are growing inclined toward the notion that Bitcoin has not formed a bottom yet. Therefore, we will monitor its price action closely and look for more clues as to the resumption of the selling pressure.
Fundamental factors
We foresee bearish fundamental factors like higher interest rates and less money printing as damaging for the U.S. economy and cryptocurrencies. As a result, we expect these issues to weigh on the price of Bitcoin and drag it lower.
Illustration 1.01
Illustration 1.01 shows simple support and resistance levels for BTCUSD.
Technical analysis - daily time frame
RSI and Stochastic are bullish. MACD points to the upside as it remains in the bearish zone. DM+ and DM- are bearish. Overall, the daily time frame is neutral/slightly bullish.
Illustration 1.02
The idea above shows the potential setup for BTCUSD.
Technical analysis - weekly time frame
RSI, MACD, Stochastic, DM+, and DM- are all bearish. Overall, the weekly time frame stays bearish.
Please feel free to express your ideas and thoughts in the comment section.
DISCLAIMER: This analysis is not intended to encourage any buying or selling of any particular securities. Furthermore, it should not be a basis for taking any trade action by an individual investor. Therefore, your own due diligence is highly advised before entering a trade.

3 to 1 short BTC trade idea for today, 24 June 2022Risk is 3 times the reward on this short Bitcoin trade idea. Keep it simple.

Bitcoin - The best time to start taking profits off the tableOver the weekend, on Saturday, Bitcoin dropped as low as 17 592.78 USD, missing our price target by 92.78 USD. Then, within 24 hours, Bitcoin erased its losses and dropped below 20 000 USD again. Currently, it trades slightly below the 20 000 USD price tag. At the moment, we are not entirely sure where BTCUSD is headed next; as a result, we would like to abandon 17 500 USD. We expect a relief in the stock market and cryptocurrencies; however, what we are seeing now in the market might be actually it. In our opinion, now is the best time for investors to take profits off the table if they went short Bitcoin and exploited the trend. Although, we have to note that fundamental factors weighing on BTC did not change. Therefore, we speculate it is possible we still have not seen a bottom in the price of BTCUSD. We will monitor the price action closely and update our thoughts soon.
Illustration 1.01
The picture shows Bitcoin reaching the 2018 price level.
Technical analysis - daily time frame
RSI, MACD, Stochastic, DM+, and DM- are all bearish. Overall, the daily time frame is bearish.
Illustration 1.02
The declining volume hints at a cooling off in the selling pressure. In our opinion, that might foreshadow a temporary rally toward the 20-day SMA.
Technical analysis - weekly time frame
RSI, MACD, Stochastic, DM+, and DM- are all bearish. Overall, the daily time frame is bearish.
Please feel free to express your ideas and thoughts in the comment section.
DISCLAIMER: This analysis is not intended to encourage any buying or selling of any particular securities. Furthermore, it should not be a basis for taking any trade action by an individual investor. Therefore, your own due diligence is highly advised before entering a trade.

Bitcoin - The downfall of the cryptocurrency marketNews outlets report that institutions are selling their assets at a record pace and Bitcoin made a new low at 20 074.50 USD. Nevertheless, we continue to maintain our short-term price target of 20 000 USD. Additionally, we would like to set a medium-term price target at 17 500 USD. Our reasoning is detailed below and in the attached articles.
Fundamental factors
Today, the FED is likely to raise interest rates by 75-100 bps. If it proceeds with 100bps, then that would be the biggest rate hike since the 1990s. We expect this to weigh on the economy and drag it lower. Additionally, we expect the same from the reduction of the FED's balance sheet. As a result, this will lead to risk aversion and a subsequent drop in the price of cryptocurrencies.
Technical analysis - daily time frame
RSI, MACD, Stochastic, DM+, and DM- are all bearish. Overall, the daily time frame is bearish.
Another threat on the horizon
The post above is our previous idea on Tether and the issue with Bitfinex and the backing of their token.
Technical analysis - weekly time frame
RSI, MACD, Stochastic, DM+, and DM- are all bearish. Overall, the weekly time frame is bearish.
Please feel free to express your ideas and thoughts in the comment section.
DISCLAIMER: This analysis is not intended to encourage any buying or selling of any particular securities. Furthermore, it should not be a basis for taking any trade action by an individual investor. Therefore, your own due diligence is highly advised before entering a trade.

Bitcoin - The "Mashinksy" crash and the "panic mode"In the past 24 hours, Bitcoin fell an astounding 20%, marking a new low at 20 816.35 USD. Since then, Bitcoin bounced above 23 000 USD and continues to trade within its proximity. Yesterday, an important piece of news came out when the Celsius Network, run by Alex Mashinsky, paused withdrawals, swaps, and transfers on its platform. That is a substantial blow to over 1.7 million platform users, leaving their 151 534 BTC locked away. The company's statement says:
“Due to extreme market conditions, today we are announcing that Celsius is pausing all withdrawals, Swap, and transfers between accounts. We are taking this action today to put Celsius in a better position to honor, over time, its withdrawal obligations.”
That is yet another significant development in the cryptocurrency world after just a recent fallout with the Luna stablecoin token. In our view, this will lead to more scrutiny over cryptocurrencies from the U.S. regulators, creating even tighter conditions in the market. Furthermore, we expect the FOMC meeting on 15 June 2022 to accomplish the same. In our opinion, higher interest rates and economic tightening threaten the price of risk assets like cryptocurrencies. Additionally, we think that substantial cracks start to appear in the sector, which will culminate even in more panic selling. Therefore, we maintain our bearish stance on BTCUSD, and our price target stays at 20 000 USD.
*Total cryptocurrency marketcap dips below 1trn. USD!*
Illustration 1.01
The price of BTCUSD approaches crucial support levels from 2017 and 2019. If these levels are penetrated to the downside, that will be a very bearish development.
Technical analysis - daily time frame
RSI, MACD, Stochastic, DM+, and DM- are bearish. Overall, the daily time frame is extremely bearish.
Illustration 1.02
20-day SMA and 50-day SMA continue to confirm the downtrend. However, at the moment, the price traveled too far from its 20-day SMA; in case of a correction, we would be looking for a retracement toward this moving average.
Technical analysis - weekly time frame
RSI, MACD, Stochastic, DM+, and DM- are bearish. Overall, the weekly time frame is extremely bearish.
Illustration 1.03
The picture shows panic selling in Bitcoin. Additionally, increasing volume hints at increasing selling pressure. The market continues to show characteristic signs of the downtrend with strong bounces and even stronger selloffs.
Please feel free to express your ideas and thoughts in the comment section.
DISCLAIMER: This analysis is not intended to encourage any buying or selling of any particular securities. Furthermore, it should not be a basis for taking any trade action by an individual investor. Therefore, your own due diligence is highly advised before entering a trade.

Bitcoin - 25k USD taken out and what is next?!Over the past few weeks, despite the numerous calls for the bottom and trend reversal, we kept our bearish stance on Bitcoin. Today it has plunged below 25 000 USD, hitting our price target and constituting a new low. We continue to maintain a bearish stance on Bitcoin. As a result, we would like to update the short-term price target for BTCUSD to 23 000 USD and the medium-term price target to 20 000 USD. Our views are drawn from bearish fundamental and technical factors, which are detailed below.
Fundamental factors
On 15th June 2022, the FOMC meeting is set to take place. We expect higher interest rates to impact the cryptocurrency market negatively. Furthermore, we expect the same from the economic tightening combined with reducing the balance sheet that belongs to the FED. Therefore, we foresee more pressure from the weakening stock market (to which BTCUSD is highly correlated) and a lack of appetite for risk assets. In addition to that, we view increasing scrutiny into cryptocurrencies (by the SEC and other governmental entities) as very harmful to the sector. In our opinion, the upcoming regulation after the fallout Luna stablecoin token will lead to an even tighter market.
Illustration 1.01
The picture shows two recent bearish breakouts leading to the formation of a new low in the price of BTCUSD.
Technical analysis - daily time frame
RSI, MACD, Stochastic, DM+, and DM- are all bearish. Overall, the daily time frame is very bearish.
Illustration 1.02
A volume tells a story of increasing selling pressure.
Technical analysis - weekly time frame
RSI, MACD, Stochastic, DM+, and DM- are all bearish. Overall, the weekly time frame is very bearish.
Illustration 1.03
Illustration 1.03 shows additional simple support and resistance levels.
Please feel free to express your ideas and thoughts in the comment section.
DISCLAIMER: This analysis is not intended to encourage any buying or selling of any particular securities. Furthermore, it should not be a basis for taking any trade action by an individual investor. Therefore, your own due diligence is highly advised before entering a trade.

Bitcoin - The stock market provides a temporary lifeline for BTCOur latest post hinted at similarities between the structures of Bitcoin and Ethereum. We warned that Bitcoin was likely to follow the Ethereum's breakout below the support, which occurred a few hours later, and Bitcoin made a low at 28 003 USD. Then Bitcoin reversed back into the neutral zone and continued to climb higher over the weekend. Currently, BTCUSD trades around 30 600 USD. Despite that, we remain bearish on BTCUSD, and our price target stays at 25 000 USD. However, at the moment, we will pay close attention to the 31 411.18 USD support level. If the breakout above this level occurs, then BTCUSD is likely to continue higher - especially if the stock market continues its own “bear market rally.”; in our opinion, that would provide a further lifeline for cryptocurrencies in the short term, and as a result, BTCUSD could rise as high as 36 000 USD before resuming a downfall.
Illustration 1.01
Illustration 1.01 shows the recent breakout to the downside from the neutral zone.
Technical analysis - daily time frame
RSI and Stochastic are bullish. MACD also points to the upside. DM+ and DM- remain bearish. The ADX started to decline, which is reflected in the choppy price action of BTC. Overall, the daily time frame is neutral/slightly bullish.
Illustration 1.02
We will also pay close attention to the volume. We will monitor it to see if it will be sufficient to sustain a rally in a case of a bullish breakout. Insufficient volume accompanying the bullish breakout would suggest a bull trap.
Technical analysis - weekly time frame
RSI, MACD, and Stochastic are all bearish. DM+ and DM- are bearish too. The ADX increases, which points to a strengthening trend. Overall, the weekly time frame remains bearish. The same also applies to the monthly time frame.
Please feel free to express your ideas and thoughts in the comment section.
DISCLAIMER: This analysis is not intended to encourage any buying or selling of any particular securities. Furthermore, it should not serve as a basis for taking any trade action by an individual investor. Therefore, your own due diligence is highly advised before entering a trade.

Bitcoin - The bullish breakout and potential bull trapYesterday, Bitcoin broke above its resistance at 31 411.48 USD. In our last post on BTCUSD, we noted that this would be a bullish development. However, we also said we would pay close attention to volume if the breakout occurred. Currently, the volume does not seem sufficient to sustain the rally from the breakout zone (31 411.48 USD). In addition to that, the stock market shows weakness which weighs on the price of Bitcoin. At the same time, we also foresee pressure from fundamental factors like higher interest rates and economic tightening. As a result, we have no reason to change our bearish outlook for BTCUSD; we still expect it to make new lows.
*Although, in the short-term, if the stock market erases losses and continues to march higher, it will provide a further lifeline for BTC (temporarily).
Illustration 1.01
The picture above shows a bullish breakout above the resistance at 31 411.48 USD. However, in our opinion, a low volume raises caution, hinting at a potential bull trap.
Technical analysis - daily time frame
RSI, Stochastics, and MACD point to the upside. However, we expect them to start reversing soon. DM+ and DM- are due to perform a bullish crossover; if they fail, it will bolster the bearish case for BTC. Overall, the daily time frame is bearish.
Technical analysis - weekly time frame
RSI, MACD, and Stochastic are bearish. The same applies to DM+ and DM-. Overall, the weekly time frame is bearish.
Please feel free to express your ideas and thoughts in the comment section.
DISCLAIMER: This analysis is not intended to encourage any buying or selling of any particular securities. Furthermore, it should not serve as a basis for taking any trade action by an individual investor. Therefore, your own due diligence is highly advised before entering a trade.

Bitcoin - BTCUSD eyes 25 000 USD againWith the recent developments in BTCUSD, we do not need to change our bearish bias. Therefore, our price target stays at 25 000 USD.
Negative fundamental factors
Among the fundamental negative factors weighing on the higher price of Bitcoin is the prospect of the FED pursuing more rate hikes in the U.S. and its reduction of the balance sheet. We expect these factors to strengthen USD and, as a result, weaken BTCUSD. Additionally, we still foresee the weakness in the stock market to which the price of Bitcoin is highly correlated; with more declines, we expect risk appetite to drop even further.
Technical analysis - daily time frame
MACD is flattening. Stochastic and RSI are bearish. DM+ and DM- are bearish too. Overall, the daily time frame is bearish.
Illustration 1.01
The picture above shows the bull trap we hinted at two days ago. Since then, the price of BTCUSD fell over 9%. Currently, BTCUSD trades around 29 400 USD; favorably, we would like to see a plunge below 28 600 USD. That would further bolster the bearish case for Bitcoin.
Technical analysis - weekly time frame
RSI, MACD, Stochastic, DM+, and DM- are all bearish. Overall, the weekly time frame is bearish.
Illustration 1.02
The picture shows how Bitcoin failed to penetrate the sloping resistance; instead, it reversed to the downside.
Please feel free to express your ideas and thoughts in the comment section.
DISCLAIMER: This analysis is not intended to encourage any buying or selling of any particular securities. Furthermore, it should not serve as a basis for taking any trade action by an individual investor. Therefore, your own due diligence is highly advised before entering a trade.

Bitcoin - We have not seen a capitulation yetAs fast as the odds of the bounce increased yesterday, they faltered right away after Bitcoin retraced below 31 411.48 USD. After that, Bitcoin erased most of its prior gains and halted a decline at 29 184.25 USD. Currently, it trades near the 26 600 USD price tag. We maintain our bearish stance and price target of 25 000 USD.
The market sentiment and fundamental factors
The retail sector exhibits exuberant bullishness as we continue to see an immense attempt of lay traders to call a bottom in the market. That suggests we have not seen a capitulation yet. Additionally, all this continues to occur despite persistent bearish fundamental factors like higher interest rates in the U.S. and economic tightening. Meanwhile, other problems for the cryptocurrency market also start to mount. The recent fallout with the Luna token will lead to stricter regulations in the cryptocurrency market, which will see many cryptocurrency projects disappear in the future. Further, the SEC launched a probe into Binance over its BNB token, which raises more uncertainty in an already uncertain market. These are just a few factors that we consider to support our bearish thesis.
Illustration 1.01
The picture shows BTCUSD gaining market dominance since the start of 2022. That suggests that many smaller altcoins are left behind, and money flows into Bitcoin.
Technical analysis - daily time frame
RSI is bearish. MACD and Stochastic are neutral. DM+ and DM- performed bearish crossover. Overall, the daily time frame is bearish.
Illustration 1.02
Illustration 1.02 shows the hourly chart and simple support/resistance levels.
Technical analysis - weekly time frame
RSI, MACD, Stochastic, DM+, and DM- are all bearish. Overall, the weekly time frame is bearish.
Please feel free to express your ideas and thoughts in the comment section.
DISCLAIMER: This analysis is not intended to encourage any buying or selling of any particular securities. Furthermore, it should not serve as a basis for taking any trade action by an individual investor. Therefore, your own due diligence is highly advised before entering a trade.

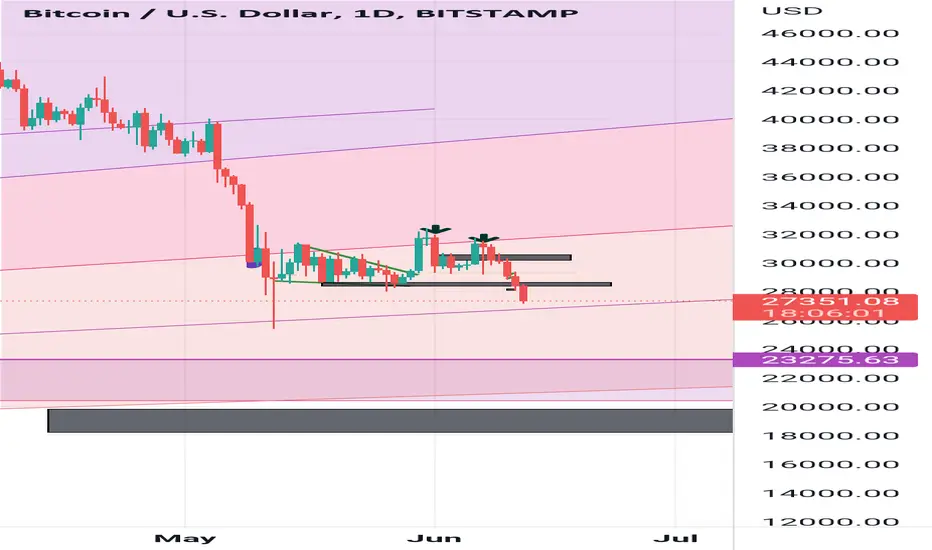
Bitcoin - Higher interest rates pose threat to BTCUSDBitcoin continues to move within the range between 28 615.23 USD and 31 411.48 USD. We still maintain a bearish notion on it as we expect the FED to move ahead with its economic tightening next week and pursue demand destruction. As a result, we expect the stock market to reverse the bear market rally and start drifting lower. Simultaneously, we expect this selling pressure and risk aversion to spill into the cryptocurrency market. Accordingly, we expect BTCUSD to be dragged lower by the declining stock market and rising USD. Therefore, we have no reason to change our bearish stance on BTCUSD; our price target stays at 25 000 USD.
Technical analysis - daily time frame
RSI is neutral. The same applies to MACD. Stochastic turned bearish. DM+ and DM- are neutral. ADX suggests the trend is turning neutral. Overall, the daily time frame is slightly bearish.
Illustration 1.01
The picture above shows two recent false breakouts above the short-term resistance.
Technical analysis - weekly time frame
RSI, MACD, Stochastic, DM+, and DM- are all bearish. Overall, the weekly time frame is bearish.
Please feel free to express your ideas and thoughts in the comment section.
DISCLAIMER: This analysis is not intended to encourage any buying or selling of any particular securities. Furthermore, it should not serve as a basis for taking any trade action by an individual investor. Therefore, your own due diligence is highly advised before entering a trade.

Btc updateWe are just beginning. Previous structure has been broken, sentiment is still bearish. There could be a retest into 28k region but it's not gonna happen now. The market has to cool a little bit for is to see the retest, and based on price reaction on the retest, we could short from there.
BtcusdWell what do you say here ser.
Price still respecting the gann fann. Possibility is going down is pretty high.
