HUGE Cup & Handle On BTC/GOLDAre we in the same situation as in 2017? At that time, BTC followed with a 500% rally. Do you think history is repeating itself?
If we use the same percentages, we'll have a BTC/GOLD rally of 600%. This would mean that BTC could make 250%.
Btcgold

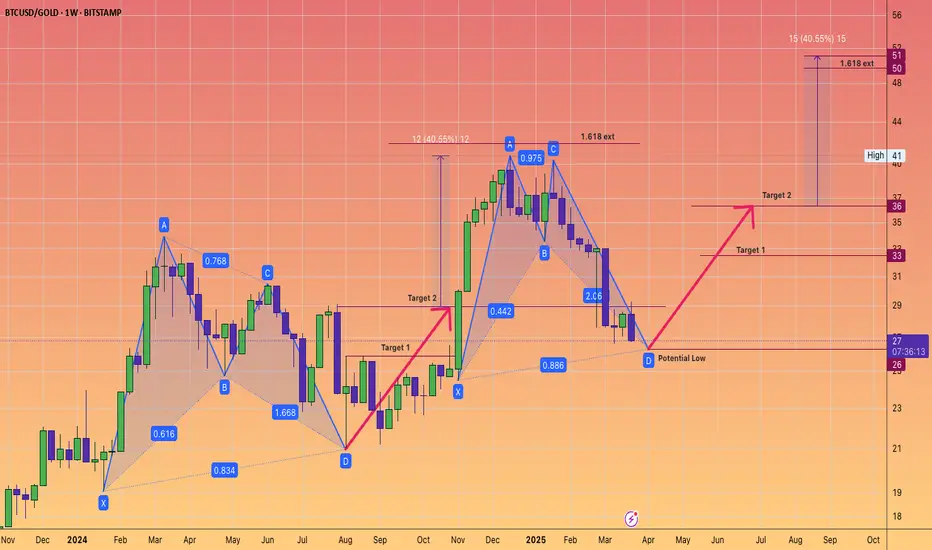
Bitcoin harmonic pattern. Back to back Gartley. BTCGOLD ratio.The BTC/GOLD ratio has experienced a significant correction, currently standing at 27 gold ounces per 1 Bitcoin, down from a peak of 41, representing a decline of 34%.
Gold, priced at $3,114 in US Federal Reserve notes, is in a sustained bull market.
It is reasonable to anticipate that the digital equivalent of gold will gain traction once gold stabilizes at a higher price point.
The Gartley pattern is recognized as the most prevalent harmonic chart pattern.
Harmonic patterns are based on the idea that Fibonacci sequences can be utilized to create geometric formations, which include price breakouts and retracements.
The Gartley pattern illustrated indicates an upward movement from point X to point A, followed by a price reversal at point A. According to Fibonacci ratios, the retracement from point X to point B is expected to be 61.8%.
At point B, the price reverses again towards point C, which should reflect a retracement of either 38.2% or 88.6% from point A.
From point C, the price then reverses to point D. At point D, the pattern is considered complete, generating buy signals with an upside target that aligns with points C and A, as well as a final price target of a 161.8% increase from point A.
Often, point 0 serves as a stop-loss level for the entire trade. While these Fibonacci levels do not have to be precise, greater proximity enhances the reliability of the pattern.
Will these consecutive Gartley patterns succeed in bolstering Bitcoin's strength? We will soon discover the answer.
Bitcoin will overperform Gold in lower time frame?When i looked into BTC/GOLD chart (BTCXAU), i saw 2 things. The gap has been filled and BTC bounced against GOLD over the trend line support. If this is a retest of bullish continuation, then things will be positive for BTC price. Losing this support zone of 30 - 31 is the invalidation.

Later, Bitcoin!Bitcoin remains in a long-term bullish trend, but it currently appears significantly overvalued relative to gold. The recent breakout, followed by a re-test of the upsloping wedge formation, suggests that bullish momentum may be waning. This could indicate that capital is beginning to rotate out of Bitcoin. As a result, it may be more prudent to revisit the market in one to two years ahead. This shift may also mark the beginning of a potential altcoin season.

Gold - Bitcoin Close to a Vital Ray. Volatility Alert.Gold, in terms of Bitcoin, is getting close to an important ray that crosses through the two significant tops.
Should we expect a strong reaction?
If we take a look at the third rejection from the bottom, we can see that it was able to get below the bottom ray but quickly reversed upward. So, we should definitely expect a strong reaction to the upper ray. Especially, as the BTCUSD price was reject at the linear ray that connected the last two bull peaks, this should be treated as seriously.
The 1 day EMA400 is above the MA400, which means that price is likely to rise to hit it, although it has entered the KC (Keltner Channels/EMA Bands), so I wouldn't count on the EMA400 being hit.
Saying that, it will act as resistance at about the same place as the upper ray.
What should we expect?
If gold breaks the upper ray, then we could be in for a very significant rise in price (BTC).
If gold is rejected, then we should expect a decision on direction by the start of August at the latest. If it takes that long, then we should expect to see gold drop to about 0.0248BTC.
We can look for clues in the RSI, depending on which way it breaks out. On the weekly chart, the RSI peaked at 65, not yet in overbought territory.
What to do?
As gold, and charts in general, do not offer a BTC pairing yet (with the exception of tethered gold on a crypto exchange), you'll have to use this chart as a guide and watch both Gold and BTC priced in something like USD or, the oldest currency still in use, GBP.
Gold has been up for a significant amount of time , is overbought and recently hit a Fibonacci Retracement level when priced in USD. If gold cools off and Bitcoin rises then the lower ray won't take long to encounter.
Gold in BTC could pump very up very high and reverse. This would seem likely caused by BTC crashing in that scenario, however, Bitcoin might be entering a bear market. I suspect it will either be very short or very long, based on the 6M and 12M RSI.
Main takeaways:
The gold and bitcoin markets are about to get very volatile, so take caution/avoid high or any leverage.
Use the GOLDUSD chart and change the currency to BTC for clues on direction in the coming days or weeks.
This could lead to a long term direction, but unfortunately, you cannot add alerts to a chart with an altered pairing, so perhaps use the PAXGBTC chart and add alerts there.
[*}BTCUSD hit the 1 day MA/EMA400 at the bottom and is getting close on this chart. I suggest adding BB400 (at various SDs) and KC400 to your charts, even if you use BB20.
You might want to use HLC Area instead of candles/bars as price appears to jump around willy-nilly else.
When you find a chart difficult to read, try swapping to BTC for more clues. If the chart is Tesla, then you might even want to try Dogecoin!
In addition to these charts, the BTC Dominance chart shows that BTC has hit the same pitchfork line that it hit when the first alt season began! So, I expect a strong move there too.
So, if BTC does rise then we might get an alt season very soon.
This is my first Idea that I've published, so please forgive any mistakes, omissions or poor formatting. I am open to critical feedback.
I just wanted to put this out there as I haven't seen anyone cover this online. If you have or know of related ideas, then please
share, as I am always interested in finding ways to predict major market moves.

TC/GOLD: Could 1 BTC Reach 6,000 oz of Gold by 2027 ($19.2M US)The chart tracks Bitcoin (BTC) priced in ounces of gold (oz) on a logarithmic scale, revealing its historical growth and a speculative projection. As of April 2025, 1 BTC equals approximately 25 oz of gold, which translates to $80,000 per BTC at an implied gold price of $3,200/oz (derived from the projection).
The chart forecasts a dramatic rise to 6,000 oz of gold by 2027, a 240x increase from the current level. At $3,200/oz for gold, this would value 1 BTC at $19.2M, resulting in a market cap of $378 trillion (19.7M BTC in circulation). Historically, Bitcoin has shown exponential growth, with significant spikes during bull cycles (e.g., 2017-2018 and 2024-2025, as circled). Factors like Bitcoin’s capped supply, post-2024 halving scarcity, and potential for increased adoption as "digital gold" could support such a run.
What are your thoughts? Could Bitcoin achieve this monumental target, or is the projection too optimistic? Let’s discuss!
TL;DR: BTC/GOLD ratio is set to ****ing pump! From 25 oz now to 6,000 oz by 2027—1 BTC could hit $19.2M. Buckle up for a wild ride!

BTC & GOLD (XAU) CorrelationWith this idea I am not trying to prove anything.
Recently I bumped into the idea about Bitcoin and Precious metals correlation and BTC/GOLD looks interesting.
Topic is open for discussions, what you think ? Do we still have a room for further price surge in terms of Bitcoin ?
Please share your ideas in comments.
Good Luck everyone on this choppy market.

Bitcoin's previous ATH in gold termsBitcoin hasn't broken out the previous (2021) ATH in gold terms.
Assuming diminishing returns, a 75% gain would take us to $183K.
A repeat of 2021, considering it was a muted bull market (FTX) with a 150% gain, would take us to $270K.

BTC/Gold Ratio forming an inverted H&S patternWatch for the closing price penetration of the right shoulder high as an indication that Bitcoin will go on a run against Gold.

Bitcoin to continue outshining Gold In 2024Bitcoin (“BTC”) – the millennial gold - continues to outshine traditional gold. BTC prices have climbed higher after the listing of spot ETFs. A wider bull rally in the cryptocurrency markets is also underway. ETH touched its highest level since 2022. The total cryptocurrency market cap is 14% higher YTD.
A diverging outlook between BTC and Gold is emerging. After reaching all-time-high in December 2023, gold prices have pulled back this year. Stronger dollar fuelled by delayed rate cut expectations are taking shine off gold.
Halving event and bullishness from spot ETFs make for shining prospects ahead for BTC. In sharp contrast, macro backdrop dragging gold down leading to potentially lacklustre price performance. Collectively, this makes for a compelling spread positioning comprising long BTC and short Gold.
BTC RALLY HAS MORE STEAM
BTC is 12% higher YTD. It has marched higher with solid momentum post the spot ETF launch. Multiple factors point to further gains in store. For one, sustained net inflows to spot ETFs signal strong demand from US investors for BTC.
Volumes in spot ETFs reached its highest level since its launch on 21 February 2024. Participation was broad across several investors with 32,000 individual trades (sixty times the average), indicating widespread demand across investors.
BTC halving is due in a little less than a month, fuelling additional bullish sentiment. Lower supply of newly mined coins is expected to drive prices even higher.
BTC is currently trading 15% below its production cost, calculated by Capriole Investment using power consumption figures from the Cambridge Bitcoin Electricity Consumption Index . This index has served as a strong price floor over several years. Miners are unlikely to sell their BTC holdings below their cost of production, consequently reducing selling pressure below this key support level.
While BTC production cost acts as an indicative support level, BTC may continue to trade below this level. For one, miners have built up BTC holdings over the past year, which they can opt to sell for a substantial profit below the new production cost.
The surge in BTC over 2023 has started to spill over to other digital assets. A broader digital asset rally is under play with ETH retesting its highest level since 2022 this month.
The potential for further appreciation in BTC is high if markets are currently at the cusp of a wider crypto rally.
Finally, traders have been avoiding substantial short positions. As Bitfinex highlighted , the short-squeeze ratio is lower this year, compared to previous years which suggests large whale investors have not been taking substantial short positions.
However, institutional positioning in CME BTC futures paints a contrasting picture. Asset managers have built up record long positioning while leveraged funds have built up record short positioning on CME BTC futures.
DELAYED RATE CUTS TAKING SHINE OFF GOLD
Delayed rate cut expectations have led to a resurgence in the dollar causing a pull-back in gold prices.
Gold faces a double whammy in terms of asset rotation as both equities and the dollar remain strong.
RECESSION IS OFF THE CARDS
Mint Finance described gold performance during recessions and soft-landings in a previous paper . In summary, while gold prices rally sharply during recessions, performance is flat during soft landings, a situation where inflation subsides, and economic growth remains resilient. Over the past two soft landings, gold delivered flat returns.
While a soft landing is yet to be realized as both inflation and rate outlook for 2024 remains uncertain, a recession in the US has become a remote possibility. In fact, the Consumer Board has abandoned its long-running call for a recession in the US.
Consumer Board’s (“CB”) Leading Economic Indicator (LEI) signals turning points in business cycles and near term economic outlook. Since July 2022, the LEI signalled a US recession with the LEI in decline.
LEI fell to 102.7 in January 2024, its lowest level since 2020, yet CB has stated that it no longer anticipates a recession in the US.
CB still anticipates a slowdown this year with growth expected to be near zero in Q2 and Q3. Yet several LEI components have turned positive over the last six months, including equity performance.
An overly hawkish Fed makes the much expected Fed pivot less likely, for now, but the strength in the broader economy across businesses and consumers makes a slowdown unlikely.
FUND FLOWS – TALE OF TWO ETFs
Fund flows for BTC and Gold ETFs also suggest a vastly diverging picture. Investors have responded exceedingly well to spot ETFs. Cumulative flows for spot ETFs have exceeded USD 3 billion in a month.
For reference, it took GLD - the first Gold ETF - two years to get to this point. Though, as a counterpoint, the ETF market and money supply are much larger now compared to when GLD was launched.
Net fund flows for BTC ETFs were close to zero for the first few days after launch as GBTC outflows shifted towards lower-cost ETFs. Since February, inflows to spot ETFs (excluding GBTC) have accelerated while GBTC outflows have slowed. The result is sharp growth in net inflows suggesting strong and positive investor response to spot ETFs.
Data Source: TradingView and ETFDB
While BTC Spot ETFs has been enjoying consistent net inflows, Gold ETFs have been awash with fund withdrawals and redemptions.
Data Source: TradingView
Contrasting cumulative net flows into BTC ETFs & Gold ETFs shows a stark divergence in expectations ahead for the price of these two similar assets.
Data Source: TradingView and ETFDB
Outflows from gold ETF’s represent asset rotation out of gold with some of those assets going towards equities and bonds.
HYPOTHETICAL TRADE SETUP
An unfavorable macro outlook is weighing on gold while BTC faces a positive outlook with tailwinds likely to push prices higher. A position combining a long position in BTC and a short position in Gold benefits from both rising BTC and falling gold prices.
This spread does not compromise on performance as past rallies have yielded similar performance in the BTC/Gold ratio. BTC/Gold spread has not been an effective hedge as the ratio does not perform better during downturns.
A hypothetical spread trade consists of long four lots of Micro Bitcoin futures (MBTH2024) and short one lot of Micro Gold futures (MGCJ2024).
This position requires margin of 4 x USD 1,120 (=USD 4,480) on the BTC leg and USD 830 on the gold leg:
• Entry: 25.32
• Target: 30.60
• Stop Loss: 21.30
• Profit at Target: USD 4,310
• Loss at Stop: USD 3,285
• Reward/Risk: 1.3x
MARKET DATA
CME Real-time Market Data helps identify trading set-ups and express market views better. If you have futures in your trading portfolio, you can check out on CME Group data plans available that suit your trading needs www.tradingview.com
DISCLAIMER
This case study is for educational purposes only and does not constitute investment recommendations or advice. Nor are they used to promote any specific products, or services.
Trading or investment ideas cited here are for illustration only, as an integral part of a case study to demonstrate the fundamental concepts in risk management or trading under the market scenarios being discussed. Please read the FULL DISCLAIMER the link to which is provided in our profile description.

Gold Bear Case - Wyckoff Distribution Pattern - Posting for funThis chart is for entertainment purposes only and setups up a possible bear scenario. I'm not an expert at distribution patterns but I thought it would be fun to see if this might fit the pattern.
I don't think gold is excluded from the 'everything bubble' that the Fed is trying to pop. The Fed has been very clear that interest rates are going to go higher and stay higher for a long time. Gold does not yield interest payments and so people are going to put their money in things that do (e.g. treasury bills paying 4-5% for a low risk return).
I would not be surprised to see a large correction in gold to prices below or at $1k.
I'm neither bearish or bullish on gold.
Enjoy.

BITCOIN - Greed Is In the Air With Bearish Signs of ReversalI'm watching the market cautiously at the moment. BTC is up almost 50% since its last low in December without even a 6% correction. We have had 5 consecutive higher highs, but the MACD has conversely made all consecutive lower highs. Taking a look a previous times this has happened in 2022, we had precipitous drops. Volume is also decreasing despite making higher highs. I am not sure how much more this run has left, but the risk reward favors the downside to me.
Given the Fed's announcement, there is a lot of excitement in the air. With BTC pumping and holding over $20k for 2 weeks now (on bearish news of increased US regulation on crypto and the Genesis bankruptcy announcement no less), it's seems ripe for a rug pull. $21k is the first support level I would look to see how the bulls respond if we dip. But that is only the .382 Fib retracement level and BTC loves the .618 which would be $19,300. That is quite the correction. This run may hit $25,000, but it may not. Erring on the side of caution and history, I think BTC will likely test $20k-$21k before it moves on to $30k, so I'll be waiting for the correction. Trade cautiously.

Bitcoin vs GoldPlease 1st of all click the boost🚀 button if you want me to post more ideas and follow me to support my work! It's absolutely for free.
This is comparison of Bitcoin (BTC) versus Gold (XAU) , so if the:
*price is going up, it means BTC is stronger than XAU
*price is going down, it means BTC is weaker than XAU
After strong initial impulse down the pair has been consolidating for almost 5 months and formed this triangle📐. Now the price is breaking down out of this triangle and if it really breaks, I think there is chance for drop to 7.5. TARGET being height of the triangle projected from midpoint of the local range (pink). So this call is predicting that Bitcoin will lose -30% against the Gold .
As you know recently it was a total carnage for crypto market because of the FTX fail. Actually I predicted this FTT extreme drop 2 months ago in the idea down below:
The current situation between Binance and FTX being also a reason why I think the investors will move the funds from crypto to precious metals - safe haven. Let me know your thoughts!
Check my other stuff in related ideas.
Please boost🚀, comment🗣️, follow me✒️, enjoy📺!
⚠️Disclaimer: I'm not financial advisor. This is not a financial advice. Do your own due dilingence.


BTC manipulation at its max.As i have stated yesterday about the btc prices been bearish. BITSTAMP:BTCUSD
as you can see the price movement yesterday was ridiculous, tricking many, many people going into long positions.
the buy volume was so little but with a massive green candle is corporate funds exiting the position after jacking up the price for retail investors.
Dont fall for it next time when you see little buy volume with a large green candle.
we are still on track for the short position i have stated yesterday at the 23233 area when it breaks we trade.

Bitcoin support resistance in gold terms.There is confluence with the idea that we could see BTCUSD visit $16K levels (twitter). If that is the case, I would say high 16s would be the target. Possibly with a longer and fast wick mid 16s are plausible. But anything slower would breach the 300gr level ($16.6K at the moment) which would let the next level come into play. That is the 200gr level ($11K at the moment).
When looking at this idea, the mentioned USD levels aren't important remember those fluctuate as the price of gold changes. So, we would be looking for the $16k and $11k support levels to shift upwards or downwards.

Gold vs BTC, which one will make the next move? XAUBTC is one of my favorite indicators to decide if bitcoin's big crash or big pump is over! The rivalry between GOLD and BTC is worth watching and being careful about.
It seems that bitcoin will suffer a little more depreciation against gold and will lose more value until it reaches the next resistance zone, I mean between 0.1 to 0.11. After the touch and a few days of range on the area, either the red or the green scenario is going to happen and it's too soon to talk about it. But in the case of the green scenario which leads BTC to gain value against gold, I'm expecting a sharp reject because there is no obstacle to reaching 0.06 on the chart and it means a nice pump for the bitcoin.
DO YOUR OWN ANALYSIS.
DO NOT FORGET MONEY MANAGEMENT.

BTC ROI IS DEAD 0_0 XBITCOIN has done nearly a 3,470,256% increase over the past 10 years, how much could you really make after its gone up so high!
- I personally own 0 BTC not even a SATOSHI!
- If BTC reaches $1,000,000 (£789k) then that would be a return of around 34 X LOL (So if I put £1,000 I only get back £34k) MEH BORING!
- I am here for 100-1,000 X GAINS!
- The only projects I see doing that are: XRP, XLM, ALGO, QNT, HBAR, VET, CSPR, CSC & AGIX!

BTC is Still in the ChannelBTC is going to continue in this channel permanently. I fully expect to see the collapse of the dollar, the rise of silver and gold and the steady increase of BTC.

Bitcoin to Gold - Expect the top in 5 months not 5 weeks!Trying to make sense of Bitcoin's move, we should probably look at Bitcoin to Gold chart. Why? I think US Dollar has lost it's credibility as unit of account due to massive amount of newly printed dollars. Bitcoin to Gold shows an ascending triangle taking shape at the moment. Now the question is how we can predict when we will see the Bitcoin's top for this bull market cycle (halving cycle). If bitcoin follows the same pattern that is followed in late 2017, we should see the top in 5 weeks (end of Dec 2021 or early Jan 2022), but it has played out differently this time and there are some factors to consider.
The last cycle was fuelled by retail investors, but this cycle's drive is mainly institutional investors, which I believe they are delayed in entering the market and might take few months to see FOMO in institutional level. So this time we might see the top around May 2022. What news will cause the market crash? Probably Mt Gox bitcoin distributions. The top for this cycle, could be around 100oz Gold which might be around 200k-250k USD. I believe in the next cycle we will see the governments and central banks competing to get their hands on enough Bitcoin to not to lose their power. We can see USD $1 million in the next cycle top.
Yes. Bitcoin will become a global currency with $20 trillion dollar market cap by 2026 and we will see other countries copy El Salvador's move in making Bitcoin legal tender.
Back to the topic, here is the prediction. We sill see the top in this cycle around May 2022 due to the nature of decision making in companies which is more time consuming than the decision making process by retail investors. and we will see bitcoin hits 100oz gold per 1 BTC.

BTGUSD Symmetrical Triangle BreakoutThis is the daily chart for BTG
As can be seen a symmetrical triangle has formed
Price has moved up out of the triangle while maintaining the lower ascending trendline
This is a good sign for a potential breakout
Very cheap BTG !!

Bitcoin ATH retest in gold terms.In grams of gold terms, bitcoin has already bounced off its previous all-time high. So if it can flip the $42K area to support, the next area to look for a new ATH, in gold terms, would be about $68K.

Gold ON a SELLIt's another fall SETUP for GOLD
Well this time it will move more down 1715, but before that it should touch resistance of 1772 and 1775. It will be good to place order blow 1770.
Price shouldn't go above 1782, this will change the flow.
Look at 4H chart and see for strong chandle that make sense.
Our target is 1715 and 1668.
If you like this just follow and comment down
