BTC/USD LONG (SNIPER ENTRY TO THE MOON)he pair ascended above a multi-day trading range late last week after traders were able to push the pair above the 8973.45 level to the 9182.08 area, its strongest print in several days. Stops were elected above the 9117.19 level, a downside price objective related to the pair’s sell-off from the 10030 area that commenced on 24 February. This previous area of technical support became technical resistance, and the move above this area refocused traders on the 100-bar MA (4-hourly). The next upside levels related to the 10030 area include the 9291, 9465, and 9681 areas. Downside price objectives include the 7987.25, 7793.31, 7265.95, and 6613.45 levels.
Price activity is nearest the 50-bar MA (4-hourly) at 8812.91 and the 200-bar MA (Hourly) at 8825.30.
Technical Support is expected around 8062.04/ 7987.25/ 7793.31 with Stops expected below.
Technical Resistance is expected around 9121.40/ 9370.00/ 10534.04 with Stops expected above.
On 4-Hourly chart, SlowK is Bullishly above SlowD while MACD is Bearishly below MACDAverage.
On 60-minute chart, SlowK is Bearishly below SlowD while MACD is Bearishly below MACDAverage.
Btcidea

BITCOIN Long Term Bearish CrabBitcoin has formed a strange formation, a bearish crab. This may lead to the rise of other alt coins in future. As bitcoin loses market share to major alt coins, post halving. I expect a pump following halving however I don't believe we will see anything like the parabolic rally to 20k in 2017. This links back to my first post on this site, 'I believe Ethereum will gain significant cryptocurrency market cap during 2018, as the current marketable applications of Ether outweigh that of Bitcoin on the blockchain network' Obviously it didn't happen in 2018 but the time may be near. Caution for all of those buying bitcoin as many major alt coins including many ERC-20 tokens are much better alternatives to un bank the banked. Apologies if the crab isn't perfect, was difficult working around this timeframe and I have never really worked with crabs.

Bitcoin #hope low quality pattern but real
Bitcoin donation for the king #hope
1JPR5YpBUvHNxHF3ereochCxXZKspeb2Ce


BTCUSD IDEA: Short Term DownBTCUSD IDEA: Short Term Down: Btc at in daily support area zone and it's in rang mode. now near in rang resistance area, possibility down from rang resistance to support area.


BTC Fractal at play?? Bulls vs BearsCharts are showing eerie similarities to a BTC Rally which had bulls in a frenzy back in 2018 upon testing of the 200dMA. As we can see from back testing, the 200dMA is a very accurate indicator of bullish vs bearish trends for BTC. Under the given circumstances, RSI is overbought and has printed what seems to be a hidden bearish divergence in the making as rejection from the 200dMA overhead is building. I have reason to believe we will reject here (printing a lower high) and take a trip down to the 200wMA (BTCs strongest known support) before officially breaking out of this downward channel, leading a rally into halving.
Break and support on the 200dMA would invalidate this idea


Bitcoin - Important - Why are we stuck in a small price rangeWhen we find ourselves in a range is because very strong forces are restricting the movement of price, in this case, there is a legit reason why we just can't get above a certain price and don't drop below a certain price as well. We are currently trapped between $7800 and $8600. Why these two prices? $8600 is where the 200MA stops momentum and then returns to the $7800 which is where strong support currently is. Your job as a trader is to identify the upcoming battleground between support and resistance early on and plan for it. In my case, I don't plan on doing much in this latest battle, the range is too tight and no chance to make a good and safe profit. Price can go as high as $9600 (which is the 50MA, now offering major resistance) before coming back down to support.
So what exactly is BTC doing right now? Bitcoin is on a secondary downtrend (It has been for months now) and it is testing the latest support (which is very strong) The white line goes back months acting as support and that is what makes it very strong. Also, the green line was the historic support from June to November of last year, so both of these lines combined make a really hard to beat support system. So when do we know if we are going up for sure? Once we defeat the 50MA we should try to jump in during a pull-back. Follow me and I will indicate exactly where to jump in and where to set your stop loss.
It is important to remember that nothing is scripted, BTC does not owe us a stop at 7K or 4K, and at any given time support can act as bottom and up we go quickly. The key is that we have tools to jump into the bandwagon early and safe without missing out on much profit if it goes up violently. In short, as long as price does not go above $9600 we are still looking to go down. Lastly, that support from hell will break if we don't get over and stay over the 200MA very soon.
Lastly, a lot of money came into crypto since yesterday. Check out the chart below. In 2 days about 20 billion dollars were pumped in. It is worth noting that there is a death cross forming in this chart and someone or something is trying to prevent it. I hope you all have a handful of alts already just in case we go up from here.
Wisdom
In investment banking, there is a secret called the "90/90/90 Rule" which means that 90% of investors will lose 90% of their money in just 90 days. Just remember that large institutions are after your money, so don't make greedy unplanned moves, they are counting on you doing just that.
NOW, THE LEGEND;
Support trendlines are green
Resistance trendlines are Red
Horizontal support lines are white, the thicker the stronger the support
50 Moving Average is yellow
200 Moving Average is white
THE TREND: Still going down until we make a "higher high."
THE OUTLOOK: Not safe to buy BTC but we are near the bottom.


BTC divergence hunter daily scalpI hate intraday chart trading, because always sucking me out.
But this one, I think may good.
I'm using my HTF account to play this out.
TRADE SETUP
Entry : 10.461$
Margin :x10
Target1: 10.625$ (fib 0.23) - 15% profit
Target2: 10.800$ (fib 0.5) - 30% profit
Stop: 10.422$ ~5% loss with fees
Causes here, read my related educational content:
How to making LOT of MONEY - Hunting Divergence


BTC game over or continueIn this idea we will look at 2 potential scenarios:
1. Game continue
2. Game over
In case if that was top i expect strong correction 21 EMA can provide for us good support.
Also on that level we got our favorite number 0.618.


BTC potential scenario!With strong fundamentals like:
FOMO.
Fidelity Investments.
Facebook Softens Policy on Crypto and Blockchain Ads.
A New Crypto ETF Has Just Been Filed With the U.S. SEC and others.
This can be true!


BTC FA vs TA who is strongerFrom TA point of view we need correction but fundamentals are really strong. They can push price much more higher! social media definitely can help it.
"Fidelity Investments’ new cryptocurrency company will offer trading for institutional customers in a few weeks, Bloomberg reported Monday MAY 6
Betting that the cryptocurrency bear market will turn around, Fidelity created its cryptocurrency platform Fidelity Digital Assets in October. The new company began a custody service to securely store bitcoin for its customers in March, CNBC reported. Now, it will be letting customers buy and sell the cryptocurrency in the upcoming weeks, according to people familiar with the matter.
Fidelity, a roughly 72-year-old family controlled firm, is primarily known for managing retirement plans and mutual funds. But it also spends $2.5 billion per year on technologies like artificial intelligence and blockchain.
Forty-seven percent of institutional investors think digital assets are worth investing in, according to a survey released by Fidelity on May 2.
Further, of the 450 institutions interviewed by Fidelity for research for its new company, everyone from wealthy families to hedge funds to pensions, 22% of respondents already owned a cryptocurrency." CNBC

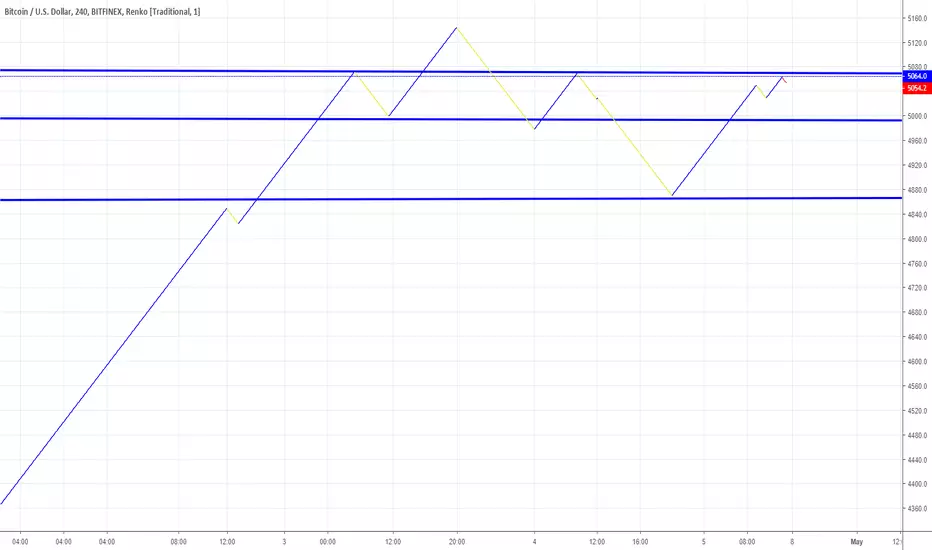
BCTUSD SHORT at decision point 5.4. 5.00 pm NY time
Hello to all who watch my charts.
Here is the current situation in Bitcoin.
After the impressive rally on
over 5000 Bitcoin is now in my oppionion in a short position
We have lower lows and lower highs, which is clearly proven since the fall below my middle blue line at around 5000 points.
Interestingly, the BTCUSD comes back, right up to my top blue colored line
which in recent times has forced to turn down 2 times.
You could see that very well here in the chart.
What will happen now?
Either Bitcoin rises above 5065 on the basis of the 4 HR chart and probably rises above 5145 to reach new highs and move to a long position,
or
Bitcoin BTCUSD turns south again on my blue line and remains in a short position.
We have to watch closely for the next few days
Good trades

BTC. Positive scenario. 8200 by the end of the year.If we consider that the correction ended in late June, then in August the stage of the set of positions in the range of 6250-6500 $ began. If buyers keep this price zone, I expect growth to 8200 before the end of the year. Otherwise there will be a negative scenario that will be published after the breakdown of this price zone.

Bitcoin Bear Market Done, Turtles Lets Flip Bullish Again!Well Bitcoin retraced as we expected it to retrace so now we are having a reversal and we are flipping bullish again! Now we have EMA 20 crossed EMA 200, EMA 50 crossed 100 and soon EMA 20 will cross EMA 200 which is an extremely bullish sign so we have a downtrend line meeting us at 7kish area however this time I think we do have the potential of breaking this trend line last time we didn't even get close to it. But lets not guess and see how the first waves of this bull cycle goes so far I only see bullish signs maybe some short term retracement after the bounce we had from 6.1k area but generally the cycle is bullish. We have EWO exiting the and already exited the bearish divergence we had with the last green wave we had, 4h STOCH is soon flipping overbought again and we are starting a green wave and continuing it on EWO on 4h timeframe. 1D chart is as juicy as it gets with STOCH moving from oversold area and EWO showing a bullish divergence on 1D too!
So congrats everyone who went USD/USDT and was waiting for a re-entry , the time has come another rally up before we go down again!
Good Luck, Traders! #moon #mooncommunity #turtlestyletrading ;)
Be a turtle my friend © Farhad Jafarov

Bitcoin Weekend Bearish Flag completion or Rally ?Bitcoin positive start to the day, though the lack of an early relief rally leaving the Bitcoin bears firmly in control going into the weekend.
Bitcoin Technical Overview
Day Trading Range: $6230 - $6650
Key Resistance: $6455 - $6528 - $6580 -$6635 - $6680
Key Support: $6378 - $6320 - $6278 - $6220 - $6170
Most Likely Scenario Long above $6400 with target $6480 & $6550 in extension.
Alternative Scenario Short below $6300 with target $6245 & $6170 in extension.
Technical Indicator:
MACD: MacD shows in 4H lower strength for short, getting power for coming Bullish scenario.
Moving Avg: SMA200 ($6646) strong resistance for the day & SMA100 ($6851) trading also resistance area.
Overall, Plenty of headwinds remain, including the SEC’s review of the 9 Bitcoin ETF applications that comes in the wake of the latest suggestion of market manipulation, a sizeable short position ahead of the Goldman Sachs news that hit the wires midweek.
Sentiment is particularly bearish and while there has been some upside early on, the gains are of little relief, investors needing to protect the downside ahead of next week’s EU gathering.
For the day ahead, holding above $6,410 through the morning would support a run at $6,528 levels and the day’s first major resistance level at $6,545 later in the day, though Bitcoin will need to break out of its current ranges early, else face the prospects of a reversal, investors somewhat bruised from the losses through the week.
Thanks
YoCryptoManic

BTC. Need correction.After a 2-week consolidation in the range of 6300-6500 buyers checked the price range of 7300-7500. Consolidation was in larger volumes than the previous one, which lasted from June 12 to July 16. Yesterday, when buyers tried to break through 7300-7500 - the market went a lot of volume sellers. The margin shorts chart confirms this.
Therefore, I think without correction there will be no extension of growth.
The previous growth was fast not because of the high interest of buyers in the BTC. The fact is that local high on margin shorts were in the price zone of 5800-6700.
Having broken through this price zone, buyers were panicked for the closure of sellers' positions.
This time the situation is the same.
I see two variants of correction.
The first, positive, is that buyers will keep the price zone 6700-6800 and from it will be an attempt to grow. Then you need to look carefully at what volumes buyers are trying to break through to 7300-7500.
The second scenario is the continuation of consolidation in the big triangle and an attempt to break through 5500-5800. with a target of $ 4,300-4,000. In this case, buyers should not hold 6700.
So I'll wait for the price to come to the price zone of 6700-6800, after which I will continue my forecast.
