Bitcoin (BTC/USDT) – Daily Chart Analysis. Bitcoin (BTC/USDT) – Daily Chart Analysis
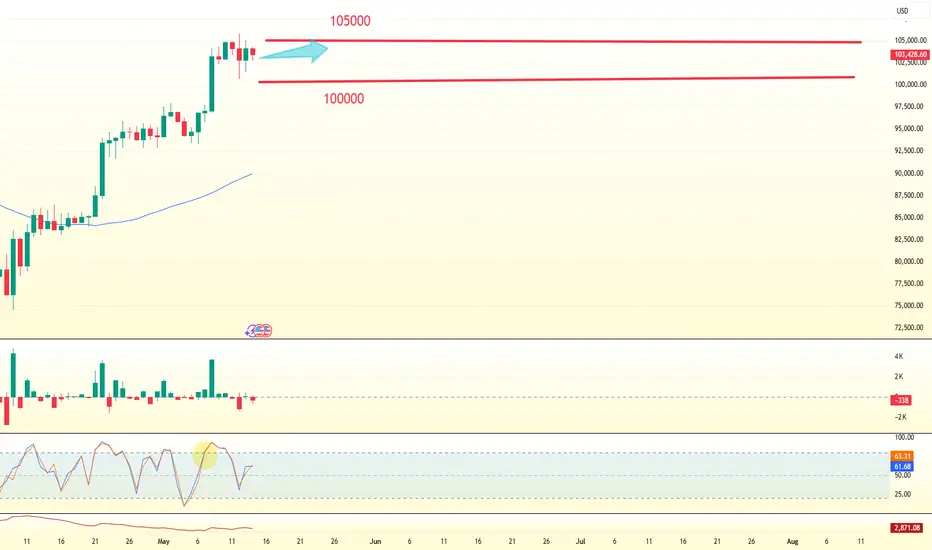
Bitcoin has tested the overhead resistance and is currently retracing towards the $104k–$105k support area.
Moving Average (MA 25):
The price is slightly above the moving average, indicating that the medium-term trend is still bullish but faces resistance.
Pattern Formation:
There is a clear breakout from the inverted “V” pattern, and now the price appears to be retesting the breakout zone.
Scenario:
If BTC maintains support at ~$105k and bounces off again, a potential push towards $112k—$115k can be seen.
If the support fails, a deeper pullback towards $100k or below could occur.
Thanks for your support!
DYOR. NFA
Btclong

BTC breakout soon and return to ATH💎 Update Plan BTC (May 29)
Notable news about BTC:
The overall cryptocurrency market capitalization has remained relatively stable over the past 24 hours, hovering near the $3.42 trillion level. Digital assets appear largely indifferent to the recent rally in equities, as gains in traditional markets are driven by corporate earnings and tariff-related developments rather than shifts in monetary policy or liquidity conditions. Meanwhile, the US Dollar is strengthening for a third consecutive session, adding further pressure.
Bitcoin (BTC) has pulled back from the upper end of its recent trading range near $110,000, settling closer to the $107,000 mark. This pause near previous highs has helped ease short-term market overheating. As institutional participation in Bitcoin deepens, its price behavior is increasingly mirroring that of traditional financial instruments like equities and commodities—marked by more tempered momentum and fewer fear-driven surges.
Technical analysis angle
It is still a 107k bumper area that brings profits to Buyer. But the worrying thing here is that the vertices of BTC are lower.
We will have two scenarios for BTC:
) First within the next 1 week, the organizers still go in this flag model and gradually narrow towards the top. If the price line follows this model, it will be negative for BTC and investors
) Secondly: BTC price will breakout area 109k, the target will go straight to 113k-115k and lower boundary if Breakout area 107k will return to 102k-100k
🔥BTC 4H is currently in the adjustment phase, this time will cause a lot of traders, Future - Margin to lose money, this rhythm will last long
At this time, whether new or old, should spend more time to practice, load more knowledge about the PTKT, as well as find knowledge posts at the channel ..., to strengthen the solid foundation, as well as avoid losing money at this time offline
==> Comments for trend reference. Wishing investors successfully trading

BTC/USDT 1DAY CHART UPDATE !!BTC/USDT Chart Analysis
The price has broken above a key resistance area (~$104,000–$105,000) and is now retesting it as support.
The 50-day (red) and 200-day (green) moving averages slope upward, indicating bullish momentum.
Price activity consolidates just above the key resistance-to-support area, indicating accumulation ahead of a potential breakout.
If the price sustains above $104,000, we could see continuation towards $120,000–$125,000.
A break below $104,000 could see the price retest lower support areas near $100,000 or even $97,000–$98,000.
Conclusion:
Bullish bias above $104,000.
If support fails, a bearish move is possible, but momentum is in the bulls’ favor right now.
Stay tuned for updates and key levels to watch!
Thanks for your support!
DYOR. NFA

Bitcoin (BTCUSDT) - Consolidation Above Support Trendline -DailyBitcoin (BTCUSDT) price is currently consolidating above a trendline support level (between $107,000 and $109,000).
Bitcoin price has been in an uptrend throughout May 2025.
If Bitcoin price closes below $106,000 a pullback could occur down to $104,000 and $100,000.
Support Levels: $107K, $105K, $103K, $100K, $95K, $90K.
Resistance Levels: $110K, $112K, $120K, $130, $136K, $150.
Stock market correlations and corporate earnings could affect short-term price action for Bitcoin (e.g. S&P500, Nasdaq, Dow Jones, Nvidia, Dell, Marvell, etc).
Breaking News, corporate earnings and announcements, presidential and government law changes, and consumer sentiment can all affect the price of Bitcoin.

Bitcoin Market Update – May 26, 2025📅 Bitcoin Market Update – May 26, 2025
🚀 BTC Price: $110,157 (+2.95% 24h)
Bitcoin continues its upward trend, showing strong momentum and bullish sentiment across the market.
📊 Technical Snapshot:
• Range: $106,801 – $110,157
• Support: $107K – $108K
• Resistance: $111K – $112K
• Trend: Bullish
🔗 On-Chain Metrics:
• Short Squeeze Pressure: Rising on Binance
• ETF Inflows: $934M → Strong institutional interest
• Sentiment: Extreme Greed (Index 78)
🧭 Fundamentals:
• Major ETF inflows show growing trust from big players.
• Market sentiment remains highly optimistic.
📈 Forecasts:
• Short-Term: $110K – $112K
• Mid-Term: $112K – $125K
• Long-Term: Up to $140K (depending on macro conditions)
Keep an eye on 103k and 97k supporting levels as liquidity zones.
✅ Summary:
BTC remains bullish with key resistance at $112K.A breakout could open room for further upside. Stay tuned and manage risk wisely.
#Bitcoin #BTC #Crypto #SorooshX

Accumulate waiting for the next new ATH, BTC 💎 Update Plan BTC (May 26)
Notable news about BTC:
Bitcoin (BTC) is trading above $109,000 as of Monday, staging a solid rebound after Friday’s sharp pullback. The recovery has been largely driven by renewed optimism following US President Donald Trump’s decision to postpone the implementation of a 50% tariff on European Union imports. This move helped calm market jitters and reignited investor appetite for risk assets, including digital currencies.
Institutional interest in Bitcoin also appears to be gaining momentum, with the latest data showing the strongest weekly inflows since late April—an encouraging sign that confidence in the asset remains resilient despite recent volatility.
Trump’s tariff delay spurs BTC bounce
In a post on his Truth Social platform, President Trump announced an extension of the EU tariff deadline to July 9, backing away from the previously scheduled June 1 hike. This announcement came just days after he criticized the lack of progress in negotiations with Brussels, which had rattled markets and led to a 3.9% drop in BTC on Friday. The policy reversal helped restore calm and provided a tailwind for Bitcoin’s upward move to start the week.
Technical analysis angle
The question that investors most interested now is when BTC will have 120k?
Congratulations to the investors. BTC goes on our analysis. Although the price is sideways, we still earn 3000 prices from this coin.
Note that the 113k region can be an important price area for adjustment before 120k and even higher
🔥BTC 4H is currently in the adjustment phase, this time will cause a lot of traders, Future - Margin to lose money, this rhythm will last long
At this time, whether new or old, should spend more time to practice, load more knowledge about the PTKT, as well as find knowledge posts at the channel ..., to strengthen the solid foundation, as well as avoid losing money at this time offline
==> Comments for trend reference. Wishing investors successfully trading

Bitcoin: Bullish Flag Breakout Targeting $114K Zonehello guys!
Bitcoin has been riding nicely inside an ascending channel, and it just broke out of a clean bullish flag on the 4H chart (classic continuation setup).
The move looks strong, and the target for this flag breakout sits around the $114,000–$115,000 zone (gray area). There’s a chance BTC pushes straight into that target if momentum holds, but we should also be ready for a possible pullback to the channel’s lower trendline before the next leg up.
That lower boundary would be a spot to watch for bullish reactions if the market cools off short term.
What I see:
Pattern: Bullish Flag within Ascending Channel
Breakout Confirmed: Strong momentum after flag breakout
Target Zone: $114,000–$115,000
Scenarios:
Direct move to target
Retest of channel support (~$106,000–$107,000) before continuation
Invalidation: A Break below the channel support would invalidate the bullish setup

waiting for ATH BTC, the inevitable will come💎 Update Plan BTC (May 20)
Notable news about BTC:
After briefly surging to 107k, Bitcoin (BTC) has retreated into consolidation, hovering within the familiar 102k–105k range that has defined the past 10 days. Market focus remains fixated on the 109.5k level and the potential for fresh all-time highs.
Mounting concerns over U.S. fiscal stability have bolstered BTC’s recovery to 105k, following Moody’s decision to downgrade the U.S. sovereign credit rating—making it the third major agency to do so. The downgrade, which cut the rating from Aaa to Aa1, highlights growing risks associated with U.S. government debt, now exceeding $36 trillion, and casts doubt on the long-held perception of U.S. Treasuries as the ultimate safe-haven asset.
Adding to fiscal worries, former President Trump’s proposed “big and beautiful” tax legislation—if passed—could further inflate the national debt. The bill, recently advanced by a congressional committee, has sparked fears of significantly widening the federal deficit, with estimates projecting trillions in additional debt over the coming decade. While the White House maintains that the bill will spur growth without increasing the deficit, rising long-term borrowing costs suggest markets remain unconvinced.
Technical analysis angle
The question that investors most interested now is when BTC will have 120k?
Looking at TF H4 will see the repetition of the trend (accumulating => increase)
In the coming time, pay attention to 107k and 110k obstacles, these will be two milestones before the price reaches 120k
Canh Long around the 103k price in the near future
🔥BTC 4H is currently in the adjustment phase, this time will cause a lot of traders, Future - Margin to lose money, this beat will last until 21-22/5
==> Comments for trend reference. Wishing investors successfully trading

Bitcoin Breaks Wedge! Correction Coming Before Next Leg?The bitcoin spot ETF has seen net inflows for 20 consecutive days. BlackRock's IBIT has attracted more than $69 million in a single day, and the total inflow scale has exceeded $5 billion. The strong institutional allocation demand provides strong support for the price of bitcoin. The 4 - hour - level RSI (49) is approaching the neutral zone and shows a pattern of lower highs, indicating that the buying momentum is weakening. The MACD histogram remains negative, indicating short - term correction pressure. At the same time, the price has formed a double - top pattern near $105,000, and the Fibonacci resistance at $109,396 suppresses the upward space. Market expectations for a rate cut in June have cooled (with a probability of 65%). If the relevant economic data exceeds expectations, a stronger US dollar may suppress the price of bitcoin.
you are currently struggling with losses, or are unsure which of the numerous trading strategies to follow, at this moment, you can choose to observe the operations within our channel.
BTCUSDT - 4H - POSSIBLE SHSBTCUSDT - 4H - POSSIBLE SHS
TRADEX BOT NEWS:
In addition to the automated execution of individual trading strategies, we are working on enabling the bot to perform COPY TRADING STRATEGIES.
We want Trading View developers to be able to monetize their INDICATORS and STRATEGIES by allowing COPY TRADING STRATEGIES.
If the indicator generates profits, the developer will collect a percentage of the profits generated.
We will soon have the first version of the TradeX BOT, which will function as a second-layer Order Book on CEX markets, hiding our greed (TP) and fear (SL) from exchanges.
More news soon!
Thank you!
_______________________________________________________
BTCUSDT - 4H - POSSIBLE SHS
LEVELS:
Resistance: 105k
DYNAMIC SL: 101k
2nd SHOULDER: 91k - 92k
Why could BTC make a SHS breakout?
It seems BTC is again topping out at 105k (coinciding with the horizontal shoulder line).
We have a SELL signal at these levels.
And third, we have a GAP at 92k in the Chicago FUTURES.
If BTC makes this correction, we would have a bullish SHS pattern that could take BTC to 140k.
To be successful in trading, it is essential to be faithful to our strategy. Be clear about where we are, where we want to go, and when it is best to be liquid. __________________________________________________
Automated cryptocurrency trading bots: All of these strategic alternatives can be configured with TradeX BoT, as it allows you to position in both directions without having to lock any amount per position. All that's required is for the conditions, either up or down, to be met for the orders to be executed in either direction, withdrawing the necessary deposits from the portfolio.
TradeX BoT (in development): Tool for automating trading strategies designed in TradingView. It works with indicators and technical drawing tools: parallel channels, trend lines, supports, resistances, etc. It allows you to easily set SL (%), TP (%), Trailing SL, multiple strategies on different securities, simultaneous buy and sell orders, and conditional orders.
This tool is in development, and the beta version will be available soon for testing.
FOLLOW ME and I'll keep you informed of our progress.
I share with you my technical analysis assessments on certain securities that I follow as part of the strategies I design for my portfolio, but I do not recommend trading with these indicators. Get informed, educate yourself, and create your own investment strategies. I hope my comments help you on your journey :)

Can BTC reach new high?Notable news about BTC:
A sudden sell-off in cryptocurrency markets late Monday wiped out earlier gains, with over $500 million in long positions liquidated as Bitcoin (BTC) retreated from weekend highs. The downturn followed easing U.S.-China trade tensions, which appeared to shift investor sentiment away from risk assets.
According to Coinglass, more than $530 million in leveraged long positions were liquidated over the past 24 hours. Bitcoin-related futures accounted for nearly $200 million of that total, while Ether (ETH) products saw around $170 million in liquidations.
Liquidations occur when an exchange forcefully closes a trader’s leveraged position due to a drop in collateral value, typically triggered by sharp market moves. This mechanism kicks in when traders can no longer meet the required margin to sustain their open positions.
Technical analysis angle
As analyzed earlier after the price of BTC breaking the 96k landmark has returned to the period over 100k
Currently, the BTC price is still passing in the 105k resistance stage and the important trend of the trend of increasing at 98k
About 98k continues to consume the trend of this currency
With the current news and price lines, it will still be supporting the increase in the trend
==> Comments for trend reference. Wishing investors successfully trading

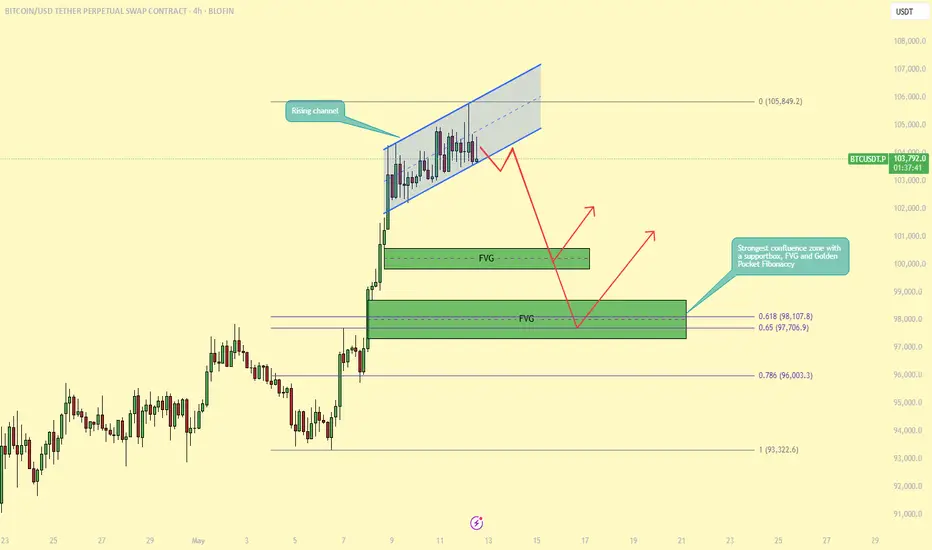
BTC Approaches All-Time High — But Signs of Weakness Emerge!BTC is once again approaching its all-time high (ATH) on the daily timeframe, generating excitement across the market. However, a closer look at the lower timeframes reveals signs of potential exhaustion as BTC encounters strong resistance. This suggests a pullback could occur before any continuation higher.
On the 4-hour and 1-hour charts, BTC is currently trading within a rising channel, which is often considered a bearish continuation pattern, especially when it forms directly below a key resistance level like the ATH. Price action within this structure is starting to lose momentum, and the presence of bearish divergences and decreasing volume further supports the likelihood of a near-term correction.
Where Could We Buy the Dip?
A pullback may offer a strategic entry opportunity for traders looking to ride the next leg up. Notably, two fair value gaps (FVGs) were created during the recent upward move. The first FVG could provide a minor bounce, but the second one is more compelling for a higher-probability long setup.
This second FVG aligns with a well-established support zone and coincides with the Golden Pocket of the Fibonacci retracement (between the 0.618 and 0.65 levels). This confluence of technical factors makes it a strong area of interest for bulls, and a potential springboard for price to retest, and possibly break, the ATH.
In summary, while BTC is showing strength on the higher timeframes, lower timeframe patterns suggest that a healthy correction is likely. Patience and proper level selection will be key. Watching how price reacts around the second FVG and the Golden Pocket zone may present one of the best opportunities for re-entry.
-------------------------------
Thanks for your support.
- Make sure to follow me so you don't miss out on the next analysis!
- Drop a like and leave a comment!
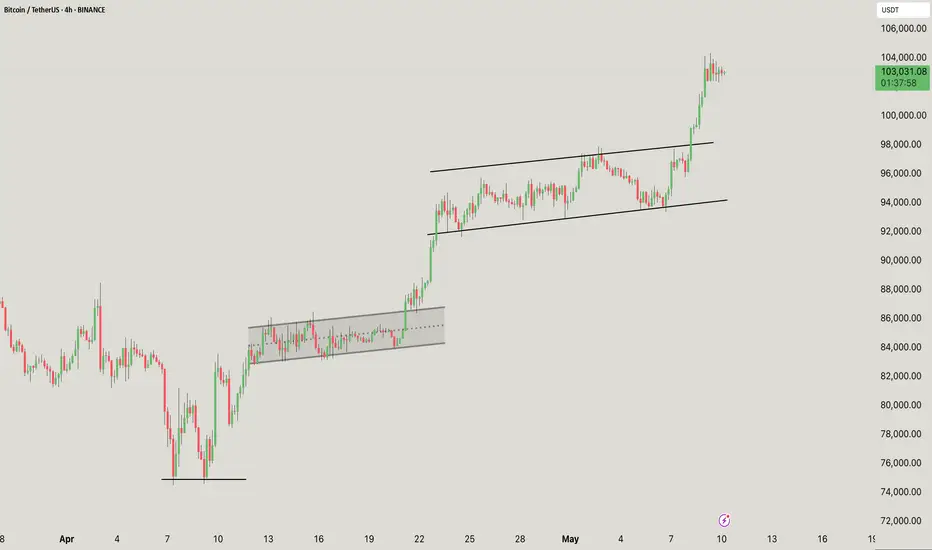
BTC/USDT Analysis – 4H Chart
This chart shows classic bullish continuation through ascending channels and consolidation breakouts:
A solid double-bottom structure was formed in early April
Marked the start of the uptrend
First consolidation box (~$90K–$93K)
Horizontal accumulation (highlighted gray box)
Resulted in a clean breakout and continuation
Rising channel (~$94K–$99K)
Rising Mid-trend consolidation wedge/channel
Price respected both trendlines
Eventually broke out to the upside → Strong momentum candle followed
Current Status (~$103K)
Price has broken above the rising channel
Now forming a new mini flag or consolidation at the top
Momentum is still in favor of the bulls
If you found this analysis helpful, hit the Like button and share your thoughts or questions in the comments below. Your feedback matters!
Thanks for your support!
DYOR. NFA
BTC/USDT – Weekly Chart Analysis (Long-Term View)BTC/USDT Chart Pattern: Multi-Year Cup and Handle Formation
The chart shows a textbook “cup and handle” formation, a highly reliable bullish continuation pattern. This pattern has played out over several years (2021-2025), indicating long-term accumulation and a breakout attempt.
Cup Phase:
Extended from mid-2021 to early 2024.
Formed a deep and rounded base, often indicating institutional accumulation.
The rounded lows reflect a gradual sentiment recovery from the 2022-2023 bear market.
Handle Phase:
A short-term consolidation after moving above the $70,000-$74,000 resistance area.
Price action pulled back marginally after hitting $110,000, forming higher lows near $85,000.
The structure resembles a bull flag or pennant, which is usually seen before the next upward move.
Key Support and Resistance Areas:
Key Support $70,000–$74,000. Previous resistance turned into support
Psychological Support $85,000 Local Retracement Low
Immediate Resistance $100,000–$110,000 Near ATH, selling pressure area
Long-term Target $130,000+ Measured move from cup pattern
Volume: Volume was high during the breakout from late 2024 to early 2025, which validates the breakout from the cup resistance area.
If BTC breaks above $100,000–$110,000 with strong volumes, we can expect continuation towards:
$130,000 (short-term target)
$150,000–$180,000 (extension based on pattern symmetry)
Bearish Risks:
Failure to hold $85,000 could lead to a retest of the $70K support area.
Sustained breakdown below $70K would invalidate the bullish pattern, but this seems unlikely given the strong fundamentals and macro structure.
If you found this analysis helpful, hit the Like button and share your thoughts or questions in the comments below. Your feedback matters!
Thanks for your support!
DYOR. NFA

BUY BTCUSD ScalpI am buying BTCUSD 96000, lets try this for a short scalp. This is my personal bias, practice at your own. No any financial advise just for learning purpose.

BTC REBOUND? 〉$140,000 NEXTAs illustrated, I'm visualizing what the next impulsive wave could look like.
Price has broken out of a major daily trend line.
It makes sense for the week to have started trading lower to find it's low and potentially bounce with strength sometime this coming up week and into the next.
The next pivot area is between the $82,000 - $80,000 range based on previous week's lows and daily low levels.
An interesting buy opportunity is forming and the potential entry is illustrated as the "pivot area" marked in yellow.
Then we have a major pivot range near the $100,000 psychological price.
.
This could be a price where some short term traders get out "in case it's just a pull back before a collapse" type of decision.
We can't ignore how much price consolidated between 100,000 and 96,000; and so that is the next stepping stone for BTC before breaking to ATH's of at least $120,000.
My personal target is set at the 161.8% extension level as illustrated.
--
GOOD LUCK!
Persa

BTC/USDT Technical Analysis. Current Price: ~$94,600
BTC has cleanly broken above the descending trendline resistance, a structure that capped price since mid-February.
This breakout was accompanied by a surge in volume and momentum — a strong bullish sign.
Golden Cross Area
A key technical confluence occurred where the 50-day MA (red) and the 200-day MA (green) were tested simultaneously, marked by the blue circle.
Price moved sharply upward after reclaiming both MAs, suggesting increased buying confidence — a textbook golden cross behavior, even if not a perfect cross yet.
Support & Resistance Flip
Previous resistance at the GETTEX:92K —$93K zone (highlighted in yellow) has now become support.
As long as BTC holds this zone, it suggests healthy consolidation and potential for a continued move up.
Trend Indicators:
50-Day MA (Red): Now curving upward — short-term bullish momentum is building.
200-Day MA (Green): Flattening and starting to rise, showing early signs of a shift in long-term trend direction.
The price is currently above both MAs, which is a key bullish condition.
Key Levels to Watch:
Immediate Resistance: $96,000–$97,500
Major Psychological Barrier: $100,000
Support Zone: $91,500–$92,500
Stronger Support (if broken): $84,000–$85,000 near the MAs
If the price continues to hold above the breakout zone and consolidates well, the next upside target will be $ 100 K.
Failing to hold the GETTEX:92K zone could invite a pullback toward the MAs around $85K — a zone where bulls may step in again.
Final Thoughts:
BTC is showing signs of renewed bullish momentum after breaking key resistance and reclaiming critical MAs. However, confirmation through consolidation and volume is essential to sustain higher levels.
Structure remains bullish unless we see a breakdown below ~$85K with volume.
DYOR. NFA. Stay sharp.

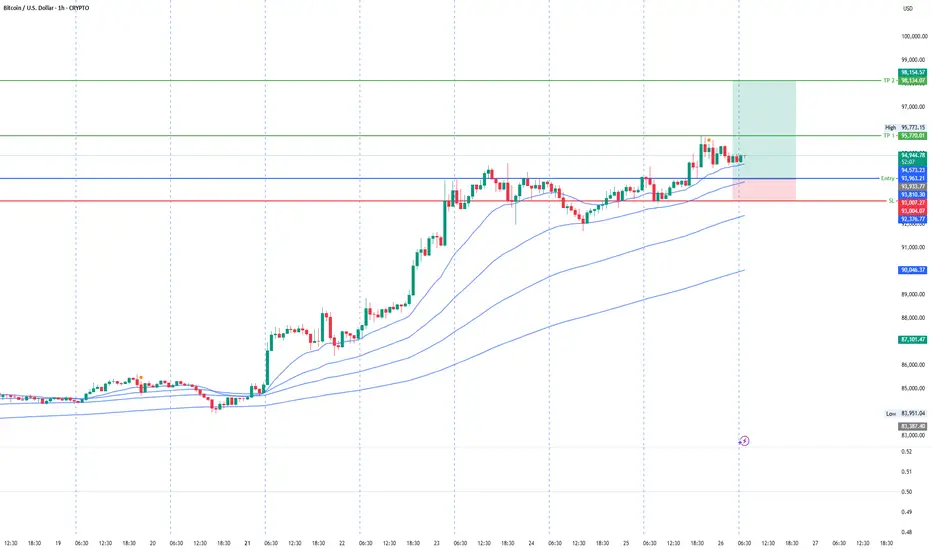
Bullish Trend Continues upto 98KUnder current market conditions, the area near 93929 has been identified as a critical support zone, where the AI model detects a high-probability trade setup.
Suppose the market demonstrates increased volume and price stability above key moving averages in the 93929 area. In that case, traders are advised to monitor for trend-continuation entry opportunities in alignment with the prevailing momentum.
Profit targets are defined at 95764 and 98143, corresponding to logical technical resistance zones. These levels are designed for staged profit-taking across different trade management styles. Stop-loss should be strictly enforced at the designated level; once breached, the strategy is considered invalidated to limit potential downside.
BTC NEXT MOVE ANALYSIS Bitcoin is showing strong bullish momentum, with a potential pullback setup forming. We are currently watching the $93,300 zone for short term reaction, but our primary interest lies lower.
A buy limit is planned at $90,500, aligning with a high-probability demand zone and market structure support. This area could provide an optimal entry for a continued push toward the draw of liquidity near $96,500.
Stay patient any dip toward this zone is a buying opportunity.
Setup is valid unless price closes below $90,000.
Stay Tuned For More 🤝🎖️🫡

The Road to The Mooni like to make some graphs like that when peoples are in Dispair mode.
- i used a modified ADX indicator with a Monthly Timeframe ( thanks to the creator by the way )
- Look at the Mountains and tell me when in past bullruns we stopped at 100 ? - Never -
- The Highest Point is 160+
That said my advice for now is : " You don't really care if TheKing will back to 20k, what you have to care is the Highest point TheKing will reach! "
- Don't Think it's the end of this bullrun
- Don't Listen Fuders
- Use indicators for the Long Term
- Believe in Trends and cycles movements
- Believe in the future of cryptos
- Believe in TheKing because Theking cannot die.
Happy Tr4Ding !

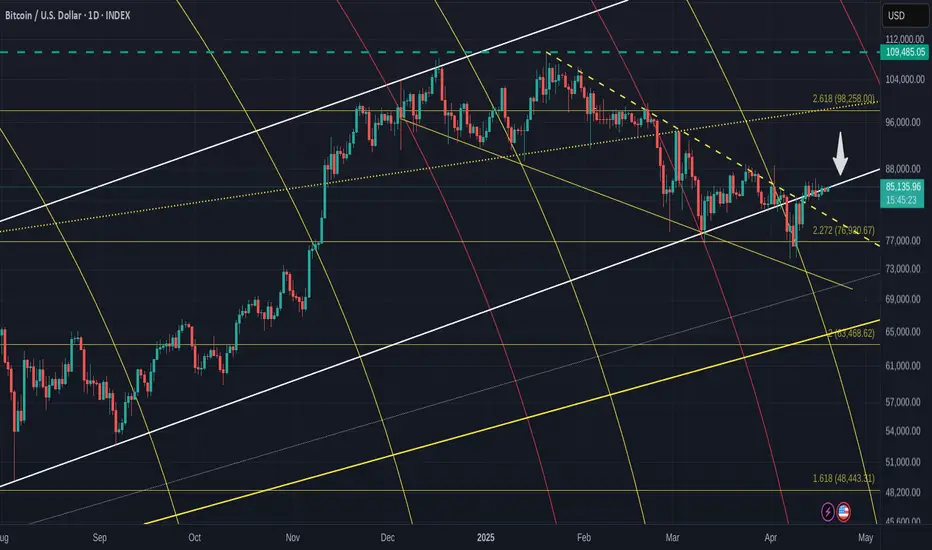
Where is Bitcoin Now ? Daily and 4 hour chart - BULLISH
On this chart, the Bold While rising lines are the upper and Lower Trendlines of the Ascending channel
The Blue Dashed line is tha current ATH line
PA finally reached the Lower trend line having spent Months in a controlled descent from the ATH in January. PA attempted to rise over the Local line of resistance ( dashed white line) on a number of occasions but was defeated.
This is probably duwe to the Bulls as that Fib circle we were heading towards was possibly Strong and they wanted to wait until we had the support of the Lower rising Trend line.
And, as you can see, we still got defeated when that Fib circle Met the rising line of support and PA Fell below..But thankfully, we had that 2.272 Fib extension to bounce off.
The battle we now have, is trying to reclaim that rising line as Support. ( Arrow)
And for Days now, we have attempted , Failed, reattempted.
The BEARS are determined.
However, Bitcoin Bulls have the advantage here.
The 4 hour shows more detail
This weekend offers the best chance of reclaiming this line as support.
PA has the strength of a Neutral MACD on the weekly, a Strong RSI and turning Sentment
LETS GO
Bitcoin is currently trading around 85,269.35 USDT. Bitcoin is currently trading around 85,269.35 USDT.
Support Zone: A crucial support zone marked in green suggests strong buying interest between 80,000 and 81,000 USDT.
Resistance: The upper trend line indicates resistance; if Bitcoin can break it, it could target levels close to 88,000 USDT.
Bullish Case: A breakout above the upper trend line could lead to an upward rally towards 88,000 USDT or above.
Bearish Case: If the price breaks below the support zone, a downward move towards 75,000 USDT can be expected.
Monitor the trade closely to see how it reacts around these crucial levels. Adjust your strategy accordingly based on the price action. If you have further questions or need analysis on specific indicators, feel free to ask!
If you found this analysis helpful, hit the Like button and share your thoughts or questions in the comments below. Your feedback matters!
Thanks for your support!
DYOR. NFA

Bitcoin 4h in Consodilation / BullishBitcoin is in consolidation since last couple of days. Once channel will be broken upside, we can buy Bitcoin with target
Target 1 : 86000
Target 2 : 87000
Target 3 : 88000
Target 4 : 89000
