BTC with Elliott Theory 💥Hello i would to share my price prediction for BTC, we are still in the correction and now we could see move to the upside where we can complete our running flat correction pattern (ABC) , and after this we could see the last fall down to the bottom 10600$. follow me for more updates.
- RSI Divergence
Btclong

Important Event Today - Bitcoin Ready To Move On Both sidesBitcoin/4H In a bear flag pattern with low volume
With the pattern and volume bitcoin is doing tells us that a BIG move is comin which potentially we could touch the origin of the dump which is around 23.6 consolidate and build more longs , then K-Boom goes down around 20500 ( top of the CME gap)
A less potential move is because of more shorts we could legdown a little bit first ~ 22k or 21.7 then it goes all the way back up to 23.6 which in this case the upside should be very intense due to the liquidity to the upside
Reminder: As a Trader We should always have levels on both side so we dont miss any moves

BTC/USD 1DAY UPDATE BY CRYPTO SANDERS !!Hello, welcome to this BITCOIN /USD update by CRYPTO SANDERS.
CHART ANALYSIS:-Bitcoin ( BTC ) started the week in consolidation, ahead of a key week of economic data from the United States.
Following a high of $22,497.00 on Sunday, BTC/USD slipped to an intraday low of $22,331.31 earlier in the session.
As a result of the move, the world’s largest cryptocurrency sank closer to a recent support point at the $22,300 zone.
Overall, the recent rise in bearish sentiment has caused bitcoin to fall by as much as 5% in the last seven-day period.
A downward crossover between the 10-day (red), and 25-day (blue) moving averages has also transpired, which could be a sign of further sell-offs to come.
One positive comes in the form of the 14-day relative strength index (RSI), which is currently tracking above a floor at the 42.00 mark.
I have tried to bring the best possible outcome to this chart.
Hit the like button if you like it and share your charts in the comments section.
Thank you.

Btc Higher timeframes analysis Falling Wedge breakout has Already Confirmed In # days Tf
Forming Inverted Heads & Shoulders To Incase Of neck Line breakout Expecting Sharp move Towards 45 to 50K area

BTC Ready for the next run we have waited for Hi guys, this is just my view.
We have an HH, HL, HH, HL and now i'm expecting HH and breakout

BTCUSDLooking for a rebound on BTC for the weeks ahead to create one last bullish drive to the upside to 24500 or 26300 which depends on the current BTC rebound as highlighted with arrows
Then creating an opportunity around the area for the big bearish run all the way to the origin of the current bull run or even creating a new low on BTC
BTC Long-Term Perspective

BTC is Preparing to retest 24800$🔥Hello Traders🖐🏿
After touching the strong support zone in 22300$ price, BTC is preparing to retest the 24800$.
In 4H TF, MACD showing that a sharp candle is incoming.
An MA ribbons showing a upward move in next candles.
In addition to these, we have a voluminous shadow box in 22300$ as a great support zone, and in 24800$ as a great resistance zone.
Its just my idea, not a financial advice.
Good luck 👊🏿

BTC 1D SUPPORTBTC 1D support is now at ~$20800
Try to set some BUY orders near the support zone
If BTC stays above the trendline,
the Take-Profit target would be 5%, 10%, and 15% from your entry
Cheers

Bitcoin Try to regain 23.7 On WeekendBitcoin legdown around 5% and bounced back from the yellow support line which it touched before ( on the first dump)
Please support and motivate me by Boost,Follow,Comment
Usually a Friday dump into weekend does not tell me a real move , meaning this could be retraced and even go higher but if it loses 22K more downside is way more possible than up side.
The liquidation around 24K is now 5M and high leverage is around 2M around 22.8
Detailed explanation on video
Also if you want to talk about trades leave a comment
Thanks for watching

BTC/USD 1DAY UPDATE BY CRYPTO SANDERS !!Hello, welcome to this BITCOIN /USD update by CRYPTO SANDERS.
CHART ANALYSIS:-Bitcoin ( BTC ) plunged further into the red on Friday, as markets reacted to fallout surrounding Silvergate.
The crypto bank recently announced that it wouldn’t be able to file its annual report to the Security and Exchange committee, whilst hinting at its “ability to continue (operating).”
BTC/USD slipped to an intraday low of $22,241.78 earlier in the day, less than 24 hours after trading at a high of $23,540.16.
As a result of the move, bitcoin has now fallen to its weakest position since Valentines day, on February 14.
However, instead of a pool of roses, Friday’s red wave has washed through the markets, leading to a huge shift in price strength.
At the time of writing, the relative strength index (RSI) is tracking at 42.91, which is its lowest point since January 1.
I have tried to bring the best possible outcome to this chart.
Hit the like button if you like it and share your charts in the comments section.
Thank you.

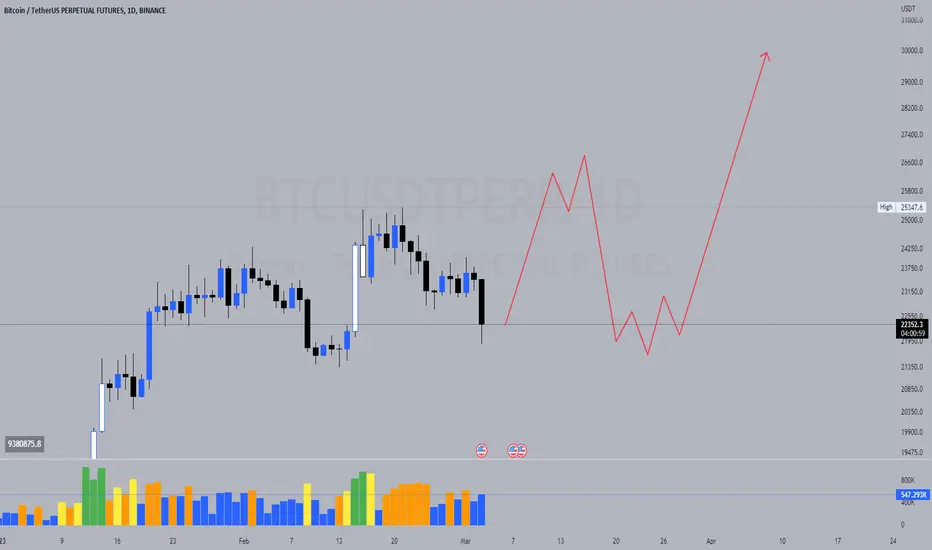
#BTC Bullish ScenarioIn Daily Timeframe, this is a bullish scenario for Bitcoin
In case BTC hold above $22,000 this move i expect price to move UP toward $30,000
USDT.D decline and market growth | ABCDIn the microwaves of USDT.D, we see abc correction and it is 100% price and time complete
The big wave A has broken the previous bottom and BC has corrected
I expect wave D to be completed in the future
Falling USDT.D means rising cryptocurrency market and BTC

Long on BTC$ and also short BTCIf the price wants to continue down it should touch the PSY Low then it will get rejected and it will dump but then it could possibly pump above the PSY Low which isn't a bad thing for BTC$ but then time will tell if it is a fake move or it will retest the PSY High as a support.

BTC/USD 1DAY UPDATE BY CRYPTO SANDERS !!Hello, welcome to this BITCOIN /USD update by CRYPTO SANDERS.
CHART ANALYSIS:-Bitcoin ( BTC ) rebounded on Wednesday, which comes in the aftermath of the latest U.S. consumer confidence report.
Confidence fell to a reading of 102.9 in February, less than the 108.5 sum that markets had anticipated.
Following a low of $23,077.65 on Tuesday, BTC/USD surged to an intraday peak of $23,880.63 earlier in the day.
The move pushed bitcoin marginally past a long-term resistance level at $23,800, hitting a five-day high in the process.
Another slight breakout occurred on the 14-day relative strength index (RSI), which climbed beyond a ceiling at 54.00.
At the time of writing, the index is tracking at 55.02, with the next visible resistance zone at the 60.00 level.
I have tried to bring the best possible outcome to this chart.
Hit the like button if you like it and share your charts in the comments section.
Thank you.

BTC the SAME pattern This is my best simple trade set-up. After we took range low liquidity, price gonna hunt for range high liquidity. Also, a good confluence for me is optimal trade entry 0,62 Fib.
Short term I am bullish until we hit range equal highs.
Thank you for attention, have a good profit!
Not a financial recommendation.

BTC/USD 1DAY UPDATE BY CRYPTO SANDERS !!Hello, welcome to this BITCOIN /USD update by CRYPTO SANDERS.
CHART ANALYSIS:-Bitcoin ( BTC ) fell for a second straight session on Tuesday, as prices flirted with a breakout below $23,000.
BTC/USD moved to an intraday low of $23,205.88 earlier in today’s session, which comes less than 24 hours after hitting a high of $23,857.89.
The move comes after bulls were unable to jump back above the $24,000 mark on Monday, with bears using this as an opportunity to reenter.
Looking at the chart, the 14-day relative strength index (RSI) also failed to break out of the resistance of its own at 53.00
At the time of writing, the index is trading at 52.46, with bitcoin slightly higher than its earlier low.
BTC is now trading at $23,466.92, with a move back toward $23,800 still on the cards.
I have tried to bring the best possible outcome to this chart.
Hit the like button if you like it and share your charts in the comments section.
Thank you.

Btcusdt(based on NEo wave)I think after this correction pattern it can makes an impulse wave for 28K.
Be patient and wait for 21400.
Also for ahort term you can have short positions. But be careful and get yours confirmations for opening the positions.

BTC 1H BUYBTC 1H support is now at ~$23340
Enter 50% at the current price
and try to set some BUY orders near the support zone
If BTC stays above the trendline,
the Take-Profit target would be 5%, 10%, and 15% from your entry
Cheers

major battle to hold 23500major battle to hold 23500 but I'm thinking over the next couple days. these macd level - 400 on the 4h plays out the same way as the last 2 times.

BTC next wave BTC next wave to the moon should start from this price this is a good opportunity in my opinion
btc long@ 14000
sl@ 9500
tp: 69000

BTC today glance!A major trend is a downside, but at the moment I just want to gamble on Long for a short period.
This is very risk move so I minimize the portion to only 20%

BTC can break resistance line of channel and continue to growHello traders, I want share with you my opinion about Bitcoin. When observing the chart, we can see how Bitcoin entered the downward channel and is currently trading inside. Inside the channel, the price created a buyer zone, which it tested several times, bounced off it and begin to move up. Now the price is close to the resistance line of the channel and can continue to rise and break through it. After a possible braekout resistance line of channel, the price can continue to move upwards. So, based on this analysis, I see 2 goals for Bitcoin at level 23785 and resistance area 24450-24590. Please share this idea with your friends and click Boost 🚀

BTC scalping Short postionHello bro
My way of trading is scalping.
support and Resistance
tp 23250~23300
sp:23130
