BITCOIN: LONG ON BITFINEXHi guys, can you imagine the smell when the BtcUsdLongBitfinex will fall?
Let's see.
Btclong

#BTC/USDT 2hour update !!Hello and welcome to this BTC /USDT chart update by Crypto Sanders.
I have tried to bring the best possible result in this chart.
Chart Analysis:- as we can see the middle trend line of btc parallel channel where is acting as 100ma support I think btc may bounce from here and go back to 24200 and if breaks the 100ma chart will be invalid
This is not a piece of financial advice.
Hit the like button if you like it and share your chart in the comment section.
Thank you


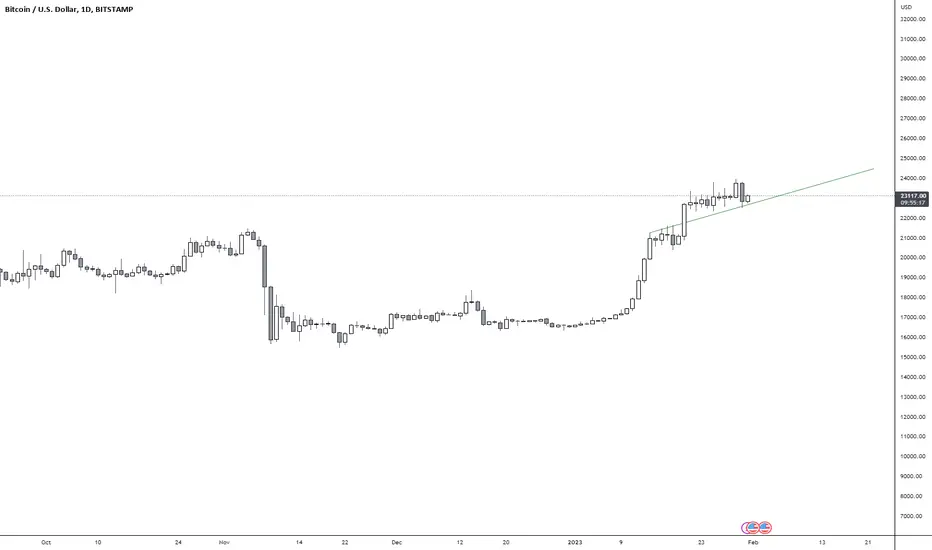
BTC/USD 1DAY UPDATE BY CRYPTO SANDERS !!Hello, welcome to this BITCOIN /USD update by CRYPTO SANDERS.
CHART ANALYSIS:-Bitcoin ( BTC ) fell lower on Friday, as market volatility rose ahead of the latest U.S. non-farm payrolls (NFP) report.
Following a high of $24,091.54 on Thursday, BTC/USD dropped to an intraday low of $23,390.38 earlier today.
Friday’s fall comes as BTC bulls were unable to sustain a breakout of a key resistance level at $24,000.
One of the reasons behind this was the 14-day relative strength index (RSI), which also failed to break out of a recent ceiling at 74.00
As of writing this, the index is now tracking at 69.48, which is slightly above the support level at the 68.00 mark.
Should this floor fail to hold during today’s session, then there is a strong chance that BTC will move below $23,000.
I have tried to bring the best possible outcome to this chart.
Hit the like button if you like it and share your charts in the comments section.
Thank you

Bitcoin Prediction Next 10 years
I belive strongly we will hit 26K and drop to 13k in the near future. From then we work our way to 32K then up to 52k. we would drop to 21k before hovering around 22k and 34k. From there we do a Bart Simpson pattern at 37k to 42k back down to 37k. Then after that we haul all the way up to 107k and take a steep drop to 64k. from the low we will pump to around 420,420(because our current all time high is at 69.6k it makes sense we will hit 420,420. Then we crash all the way to 84k before hovering between there and 122k. We run up to 177k then to 112k before ripping booty to 1.9m. A correction to 1.2m and then we will fly up to 3.1m before crashing to 469k. FUD is widespread institutions are crapping themselves. Tim Cook who bought 40 Billion bittys at 2 million is crying at his stock bonuses disappearing before the launch of the Iphone 23. He capitulates at 1.7 Million. Then Bitcoin Flys after Tim and many other companies capitulate. We Melt Faces on our way up to 10 Million before dropping to 4.1m and back up to 10.5 Million. Again the companies bought the top and overleveraged and capitulate many bitcoin at the bottom. The cycle continues. (Not real TA i really pulled this out my A** lmao)

BTC/USDT 4HOUR UPDATEHello and welcome to this BTC /USDT chart update by Crypto Sanders.
I have tried to bring the best possible result in this chart.
Chart Analysis:- BTC again attempted to break the horizontal resistance of the rectangular channel but could not close the candle above it and ended up as Faked Out.
It now holds itself above its horizontal support. Further consolidation can be expected inside the rectangular channel.
Now it is again trading below the horizontal resistance. Further consolidation inside the rectangular channel can be expected until a solid breakout or breakdown occurs.
A successful breakout of the rectangular channel will confirm a bullish move in the market. In contrast, a solid breakdown will confirm a descending push toward the horizontal support at $21,350 from where we can expect the market to bounce higher.
This is not a piece of financial advice.
Hit the like button if you like it and share your chart in the comment section.
Thank you

BTC/USDT 1DAY UPDATE BY CRYPTOSANDERSHello, welcome to this BITCOIN /USD update by CRYPTO SANDERS.
CHART ANALYSIS:-Bitcoin ( BTC ) rose to a six-month high on Thursday, with prices climbing above $24,000 for the first time since August.
The move came as the Federal Reserve opted to increase interest rates by 25 basis points in its latest policy meeting.
As a result, BTC/USD rose to an intraday high of $24,167.21, less than 24 hours after it was trading at a low of $22,877.75.
Thursday’s surge saw the world’s largest cryptocurrency climb to its strongest point since August 16, when prices reached a peak of $24,448.
This took place as the 14-day relative strength index (RSI) moved away from a recent floor of 68.00, and is now tracking at 74.10.
Should price strength continue on this course, a resistance level of 77.00 will likely be a target for current bulls.
I have tried to bring the best possible outcome to this chart.
Hit the like button if you like it and share your charts in the comments section.
Thank you

Bitcoin to leg up?Bitcoin - 24h expiry - We look to Buy a break of 24011 (stop at 23379)
Our short term bias remains positive.
There is no clear indication that the upward move is coming to an end.
A break of the recent high at 23956 should result in a further move higher.
We are trading at overbought extremes.
Daily signals are bullish.
Our profit targets will be 25641 and 25941
Resistance: 23100 / 23500 / 23923
Support: 22700 / 22500 / 22300
Please be advised that the information presented on TradingView is provided to Vantage (‘Vantage Global Limited’, ‘we’) by a third-party provider (‘Signal Centre’). Please be reminded that you are solely responsible for the trading decisions on your account. There is a very high degree of risk involved in trading. Any information and/or content is intended entirely for research, educational and informational purposes only and does not constitute investment or consultation advice or investment strategy. The information is not tailored to the investment needs of any specific person and therefore does not involve a consideration of any of the investment objectives, financial situation or needs of any viewer that may receive it. Kindly also note that past performance is not a reliable indicator of future results. Actual results may differ materially from those anticipated in forward-looking or past performance statements. We assume no liability as to the accuracy or completeness of any of the information and/or content provided herein and the Company cannot be held responsible for any omission, mistake nor for any loss or damage including without limitation to any loss of profit which may arise from reliance on any information supplied by Signal Centre.

BTC/USD 1DAY UPDATE BY CRYPTO SANDERS !!Hello, welcome to this BITCOIN /USD update by CRYPTO SANDERS.
CHART ANALYSIS:-Bitcoin ( BTC ) was back above $23,000 in today's session as traders focused on the afternoon FOMC meeting.
After registering a low of $22,874.43 on Tuesday, BTC/USD rose to a one-day high of $23,225.02 earlier today.
Today's move briefly saw the world's largest cryptocurrency from an interim range at the $23.200 level.
However, with higher volatility today due to the Fed meeting, the price has recovered from this point and is currently trading at $22.802.
This happened as the 14-day Relative Strength Index (RSI) continued to hover near a floor at 68.00.
As of writing, the index is tracking at 69.83 and may remain around this mark until the Fed meeting ends.
I have tried to bring the best possible outcome to this chart.
Hit the like button if you like it and share your charts in the comments section.
Thank you

Bitcoin - THIS Support MUST HOLD❗Hi Traders, Investors and Speculators of the Charts 📈📉
Here's a quick 3min video for a potential long-setup on Bitcoin with an entry point, a take profit point and a stop loss point.
Here's my previous analysis on near term price action on BTC, which played out almost exactly:
_______________________
📢Follow us here on TradingView for daily updates and trade ideas on crypto , stocks and commodities 💎Hit like & Follow 👍
We thank you for your support !
CryptoCheck

BTCUSD - Broken Long-Term and Short-Term Trends on the Upside?BTCUSD has recently received a buy signal from Crypto Tipster v2 Indicator after breaking through two descending trend line levels. This could be seen as a bullish signal and suggests that the cryptocurrency may be entering an uptrend. With the recent break through of these levels, we're cautiously optimistic about BTCUSD's potential for further gains.
However, it is important to note that BTCUSD is currently facing a final consolidation level before reaching potential gains of 20%. This means that the cryptocurrency is experiencing a period of stability or a pause in the current trend. It's important to keep an eye on this final level and monitor market conditions to determine whether BTCUSD will be able to break through and reach gains of 20%.

BTCUSD, I still have my eye on 30K! Evening all!
You know the drill by now!
Let's have a chat, BTC is a loose canon but we can get on the right side!
Leave us your thoughts below!

BTC 4H SUPPORTBTC >40% since our last trading idea below
BTC 4H support is now at ~$22700
Enter 50% at the current price
and try to set some BUY orders near the support zone
If BTC stays above the trendline,
the Take-Profit target would be 5%, 10%, and 15% from your entry
Cheers

BTC/USD 1DAY UPDATE BY CRYPTO SANDERS !!Hello, welcome to this BITCOIN /USD update by CRYPTO SANDERS.
CHART ANALYSIS:-Bitcoin ( BTC ) retreated from a recent five-month high on Tuesday, with prices falling below the $23,000 mark in today’s session.
BTC/USD fell to a low of $22,657.58 earlier in the day, less than 24 hours after hitting a high of $23,296.53.
The move comes as traders appear to have secured gains from recent surges in price, and ahead of the upcoming Federal Reserve policy decision.
As can be seen from the chart, today’s drop saw BTC move closer to a price floor at $22,500, with the relative strength index (RSI) hitting a floor of its own.
Currently, the index is now tracking at 68.78, which is marginally above its long-term support point of 68.00.
Although a ceiling of 77.00 could be the target for bulls who rejected an earlier breakout, it is likely that prices could consolidate until the dust settles from this week’s fundamentals.
I have tried to bring the best possible outcome to this chart.
Hit the like button if you like it and share your charts in the comments section.
Thank you

BTC Scalp LongIm looking at a inverted head and shoulder quick 125x leverage trade opportunity.
ENTRY
23066.19
SL
22966
TP
23666

btc macro swing | 5 waves | $40k by julysimilar to eth, still looking for the blow off top. somewhere between $25-26k.
think we retrace a good portion of this move and trade sideways for the remainder of Q1. retracing towards 19k would be healthy for the macro picture.
i'd avoid trading for feb/march as i think it will be big downward chop.
long for now, then we're flipping short for wave 2.

Shorters about to get REKTKeep shorting and apply at McDonalds Chads.
Vertical accumulation again and again.
but muh 12k bids.... ye keep waiting.
BTC/USDT HOURLY UPDATE BY CRYPTOSANDERSHello and welcome to this BTC /USDT chart update by Crypto Sanders.
I have tried to bring the best possible result in this chart.
Chart Analysis:-Bitcoin is forming a broad uptrend channel. The boom can be seen from here. A break below $22,500 will invalidate the pattern and we could see a dump toward the $21,000-$21,200 support area.
This is not a piece of financial advice.
Hit the like button if you like it and share your chart in the comment section.
Thank you

BTC/USDT WEEKLY UPDATE BY CRYPTOSANDERSHello, welcome to this BITCOIN WEEKLY update by CRYPTO SANDERS.
CHART ANALYSIS:-The bitcoin weekly candle closed above descending trendline resistance. Bulls reclaimed 2017 bull run highs after bouncing off historic trendline support, demonstrating bull strength.
BTC was rejected from the horizontal resistance and is now above the $22.6K support.
BTC hunted for downside liquidity and retested the descending channel.
A significant bullish rally will be confirmed by an effective retest of the descending channel and a solid breakout of $25,500.
I have tried to bring the best possible outcome to this chart.
Hit the like button if you like it and share your charts in the comments section.
Thank you

BTC - WE GOING LONG BOIIIIIIIIS WHY NOTTHIS IS NOT A FINANCIAL ADVICE....this video is provided for educational, informational, and entertainment purposes only, without any express or implied warranty of any kind, including warranties of accuracy, completeness, or fitness for any particular purpose.
Thinking to hold still for BTC for now. Hitting that 25k grab will be legit fun!

BTC/USD 1DAY UPDATE BY CRYPTO SANDERS !!Hello, welcome to this BITCOIN /USD update by CRYPTO SANDERS.
CHART ANALYSIS:-Bitcoin ( BTC ) remained near a five-month high on Monday, following a strong rally towards $24,000 over the weekend.
Following a high of $23,919.89 on Sunday, BTC/USD fell to a low of $23,166.83 to start the week.
Sunday’s surge saw BTC bulls push prices to their strongest point since August 26, however, these same traders have already begun to retreat.
Looking at the chart, the decline commenced following a failed breakout of a ceiling at 85.00 on the 14-day relative strength index (RSI).
As of writing, the index is now tracking at 72.19, with a floor at 65.00 the only current visible target for bears.
Should this zone be hit, it is highly likely that BTC will be trading close to a support point at $22,500.
I have tried to bring the best possible outcome to this chart.
Hit the like button if you like it and share your charts in the comments section.
Thank you

BTC - WE GOING LONG BOIIIIIIIISJust a little break down of how I feel for BTC in the coming days and future.
THIS IS NOT A FINANCIAL ADVICE....this video is provided for educational, informational, and entertainment purposes only, without any express or implied warranty of any kind, including warranties of accuracy, completeness, or fitness for any particular purpose.

BTC Breakout LongIm currently looking for the bounce points off this triangle, i see Bitcoins last bullish bounce point off of 23053 an hourly orderblock, i will be going in at 125x leverage.
ENTRY 23052.1
SL 22940
TP 24317
