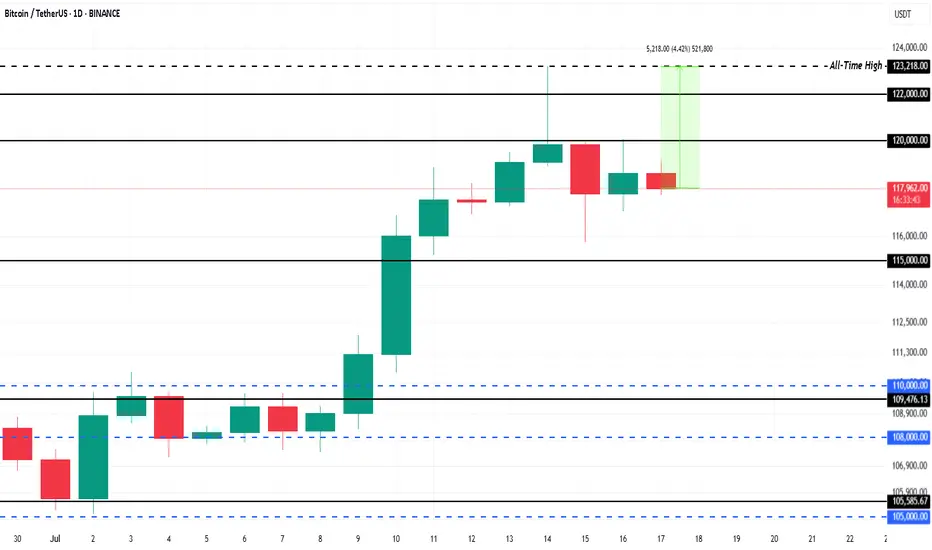
$1.5 Billion ETF Inflows Could Push Bitcoin Price 4% to New ATHBINANCE:BTCUSDT is currently trading at $118,325, facing resistance at the $120,000 level. This resistance is crucial for Bitcoin if it wants to break back to its ATH of $123,218 . The 4.4% gap to reach the ATH indicates potential for growth, but Bitcoin needs to secure support above $120,000 for this to happen.
This week, spot BINANCE:BTCUSDT exchange-traded funds (ETFs) saw over $1.5 billion in inflows , a significant portion of which occurred in the last 48 hours during Bitcoin’s dip.
The influx of institutional money highlights that investors are confident in Bitcoin’s potential despite the market cooling. If this trend persists, it could propel BINANCE:BTCUSDT price upward, as institutional support provides stability.
If BINANCE:BTCUSDT can hold above $120,000 and push past $122,000, it could continue its ascent toward new all-time highs. The current market conditions and ETF inflows support a bullish outlook, with a significant chance of breaking the resistance.
However, the risk of profit-taking remains , which could lead to a price drop. If BINANCE:BTCUSDT faces selling pressure, it could fall back to $115,000 , erasing a portion of recent gains. This would invalidate the bullish thesis, causing Bitcoin to retest lower support levels.
Btcprice
Bitcoin Awaits Breakout Above $114K🪙 Current Price: ~$109,500
📈 Trend: Bullish but facing strong resistance at $114,000
📉 Support: $106,000–$107,000
📌 Outlook: Breakout above $114K could lead to $130K+. Otherwise, possible pullback to $106K.
📊 Key Drivers: ETF inflows, Fed rate cut expectations, weak USD.
💡 Strategy:
🔺 Buy: $107,000 – $107,500 → TP $114,000 | SL $106,000
🔻 Sell (take profit): $114,000 – $115,000 → SL if closes below $112,000

₿itcoin: Continuing B WaveBitcoin has recently reclaimed the key $106,000 level. Under our primary scenario, we anticipate continued increases into the blue Target Zone between $117,553 and $130,891 – where green wave B is expected to conclude. From that corrective peak, we project a significant move lower in wave C, which should ultimately pull prices into the lower blue Target Zone between $62,395 and $51,323. This range is expected to mark the completion of orange wave a. We then foresee a brief corrective rally before wave (ii) completes its broader correction with a final sell-off.
📈 Over 190 precise analyses, clear entry points, and defined Target Zones - that's what we do.

BTC in 17 April 2025Potential Major Move on Thursday, April 17, 2025 📍
📊 Based on an analysis of historical Bitcoin chart averages and similar patterns, there is a likelihood of a significant price movement on this date.
This analysis is conducted using technical analysis and a detailed examination of Bitcoin’s movement averages. It suggests that approximately every 150 days after the start of a neutral trend, we can expect a sharp upward or downward move that sets the stage for the main trend in the future.
📅 As of the current date, March 29, 2025, there are about 18 days left until this significant event.
You can follow the results of this analysis and the conducted review on TradingView on the specified date.

HolderStat | BTC daily digestBitcoin price today ~ FWB:83K (-5% 24h). BTC futures open interest down ~7%, funding +0.006% 📉
Wider market 🌐: Altcoins fell too (ETH -6%, SOL -12%). Sentiment is split – some shout #BuyTheDip, others urge caution.
📰 CoinDesk: Tariff news spooked crypto markets, fueling BTC’s drop. Meanwhile, whales (big holders) bought this dip 🐳 – a bullish sign.
🔍 Analysis: Traders remain cautious, but whale dip-buying shows big players bullish. Expect crypto bulls 🐂 and bears 🐻 to battle it out for now.
_____________________
📊 Want more useful analytics? Like and subscribe to stay up to date with the most relevant trading ideas!
Always DYOR! 🔬

Bitcoin Following 2013-2017 Fractal UPDATE 2We can see from the chart above that PA has now fallen below the Fractal for the first time since July 2023
This is itself was expected as we can see from previous posts on this Idea
PA was overbought and so HAS to cool off
However, we have targets as to when PA may try and recover.
initially, the circle in End of May was my expected "turn around" point
Things have progressed faster and so now, we have possibilities opening up for a move higher, sooner, maybe around end of April 2925
However until the weekly MACD is on Neutral, these would be short lived - hopefully.
For a sustainable move higher, PA needs to have the ability to maintain the push
the Weekly MACD shown above needs till end of April before any significant move can be maintained. PA has bounced of Neutral previously. But MACD can , obviously, Drop below this point, wait till May, or later, and move then.
For me, the line of the arrow higher is becoming the more realistic ideal path
But the longer we wait, the Steeper the rise has to be to maintain the idea of Cycle ATH in Q4, as per cycle trends.
And to conitnue to follow this Fractal.
The Time WILL come were we break away from this Fractal but as I have been saying for years, we are still on it......many things point towards that continuing.
But as I have mentioned in a post earlier today, These Trends may be changing.
Bitcoin is Maturing
All we can do is watch, react and learn
HAVE A PLAN FOR ALL OUTCOMES but also understand, the idea of Bitcoin collapsing is becoming more and more unrealistic...
The outlook is BULLISH noi matter what
I expect to remain on the fractal path till Next cycle ATH
Time will tell

BTC → Bitcoin Retrace to $69,500? Or Bounce to $150,000?The short version, the probability that Bitcoin tests the breakout price around $69,500 is very high. That's simply the nature of breakouts; bulls take profits (sell orders) until the previous high is reached, at which point the bulls start buying again, and the bears take their profits (buy orders), driving the market up for another leg.
The question is, what is our next move as traders? Or even Bitcoin investors?
How do we trade this? 🤔
Let's zoom out to the Monthly chart. Bitcoin is resting on the 9EMA, a support area we've closed above it since September of 2023. Our current context is we've broken out of the 2021 cycle high of $69,500 and reached a new high just shy of $110,000. It's clear we're in pullback mode right now, so far-reaching down to $78,000.
Fundamentally, there aren't many catalysts for bullish activity. Bulls are simply taking profit at the first 6-figure Bitcoin price, which is both a psychological and technical price for selling. Monetary policy is still in a state of qualitative tightening, inflation has been slowly rising since September 2024, from 2.4% to 3%. Not a dramatic move, which certainly isn't helping Bitcoin move to the upside. Bitcoin seems to respond more to monetary policy than inflation rates and while the rates have steadily climbed, it's not enough to shock the market, while monetary policy has largely stayed the same.
Technical analysis shows TOTAL, TOTAL2, and TOTAL3 crypto market cap charts all were rejected at key resistance areas in early December. Bitcoin broke the 2021 right shoulder around $46,000 to $73,000, then had a measured move up to $109,000, about a 55% move each, give or take. We're simply in a state where we've reached a key resistance level after a breakout while the market as a whole is in a state of uncertainty. I believe that uncertainty will lead to a capitulation down to the high $ 60,000s, even if it's a quick wick. This would likely lead to a $1,500 ETH, $1.50 XRP, it may look ugly. But take a look at past cycles; a 30-40% pullback for Bitcoin is just another Thursday in the crypto market. The alts can pull back as much as 50%-60%.
I think we wait for the buy signal. Look for a pullback to the breakout area at $69,500, and wait for the market to tell us that we found the buy zone with a strong candle close on or near its high on the Daily chart, likely somewhere around $75,000. Then I believe $150,000 is the area for this cycle high based on the Lifetime Resistance and measured move target. The measured move shows a 57% move up after the breakout; if we take that 57% move up and stack it on the mid-price of the current trading range at $91,000, that takes us to right around $150,000. Anything beyond that is a bonus. I think from there, it makes a second attempt to breach the high, followed by our 12-18 month bear market as shown in the chart.
💡 Trade Idea 💡
Long Entry: $75,000
🟥 Stop Loss: $55,000
✅ Take Profit #1: $105,000
✅ Take Profit #2: $135,000
⚖️ Risk/Reward Ratio: 1:3
🔑 Key Takeaways 🔑
1. Breakout above 2021 Cycle High $69,500
2. Psychological and technical high of $100,000 reached
3. Pullback phase has been in motion since December, breakout zone is the buy target
4. Wait for a two-legged pullback toward the Monthly 30EMA (breakout zone), look for strong buy signal, large bull candle closing on or near its high.
5. RSI is near 64.00 and below the Moving Average. Wait for contact and a drop toward 60.00 in concurrence with the price action to enter.
💰 Trading Tip 💰
It's reasonable to take half profits at the first resistance target in a long trade, or the first support target in a short trade. Using a 1:1 Risk/Reward Ratio for your first target, you can move your stop loss up to your entry price, locking in profits. This allows you to watch the rest of the trade execute without worry of losing money. This helps improve trading psychology and the equity in your account.
⚠️ Risk Warning! ⚠️
Past performance is not necessarily indicative of future results. You are solely responsible for your trades. Trade at your own risk!
Like 👍 and Follow to learn more about:
1. Reading Price Action
2. Chart Analysis
3. Trade Management
4. Trading Psychology

Bitcoin: 74k-72k Line in the Sand!Hello everyone!
First of all happy international women's day to all the ladies out there! (Don't forget to get flowers guys)
Bitcoin is approaching a key area
with extremely strong support, but several indicators also mark the line in the sand for the current bullmarket for Bitcoin.
Weekly
- Fib: 38.2% of the complete trend retracement (15.5k - 109.4k)
- MA: 50 SMA (75.4k)
- S/R: 70k-74k Strong supply/resistance area
A consistent pattern emerges on Bitcoin's chart: breaks below the 50-week SMA (black line) after an all-time high (red arrows) have reliably indicated bear markets. Similarly, reclaiming the 50-week SMA (green arrows) has historically confirmed bull runs toward fresh all-time highs.
3D
- Fib: 61.8% of the retracement from previous range low to current high (49.5k - 109.4k)
- MA: 100 SMA (77k)
On the 3-day chart, the 100 SMA has acted as strong support during this bull market. Bitcoin revisited the moving average on 5 individual occasions and bounced off it. Despite briefly closing below it twice, BTC quickly reclaimed it with the following candle.
A potential correction to $70,000 is possible for Bitcoin. To maintain the bull market, it's crucial for bulls to find support there and drive the price back above the 3-day 100 SMA and the weekly 50 SMA.
Happy trading!
Pat

MARA ($MARA) Q4—$214.4M HAUL STUNS MARKETMARA ( NASDAQ:MARA ) Q4—$214.4M HAUL STUNS MARKET
(1/9)
Good Morning, TradingView! MARA Holdings ( NASDAQ:MARA ) smashed Q4 ‘24 with $ 214.4M revenue, up 37% YoY 🌍 Bitcoin hoard hits $ 3.94B—let’s unpack this mining beast! 💰
(2/9) – REVENUE SURGE
• Q4 Take: $ 214.4M, 37% up from $ 156.8M 📈
• Net Income: $ 528.3M, 248% leap 🌟
• BTC Price: 132% boost adds $ 119.9M 💸
NASDAQ:MARA ’s cashing in—halving? What halving?
(3/9) – BLOCKS BUZZ
• Blocks Won: 703, up 25% from 562 🚗
• Hashrate: 53.2 EH/s, 115% jump 🔧
• EPS: $ 1.24, beats $ 0.32 loss call 🌞
NASDAQ:MARA ’s grinding—blocks stack, stock pops!
(4/9) – BTC HOARD
• Stash: 45,659 BTC, $ 3.94B haul 🌍
• Growth: 197% since Jan ‘24—22,065 bought 💼
• Bitdeer: $ 532M loss—ouch 😕
NASDAQ:MARA ’s stacking—rival’s stumbling!
(5/9) – RISKS IN SIGHT
• Costs: $ 127.4M energy, up 70% ⚠️
• Volatility: BTC swings sting 🐻
• Halving: $ 64.2M output hit 🔒
NASDAQ:MARA ’s hot—can it dodge the chill?
(6/9) – SWOT: STRENGTHS
• Haul: $ 214.4M, profit beast 💪
• Blocks: 25% more—mining grit 🏋️
• Hoard: $ 3.94B BTC—stack king 🌱
NASDAQ:MARA ’s tough—built to last!
(7/9) – SWOT: WEAKNESSES & OPPORTUNITIES
• Weaknesses: Energy costs bite 🙈
• Opportunities: BTC price, AI pivot—zing 🌏
Can NASDAQ:MARA vault past the snags?
(8/9) – NASDAQ:MARA ’s $ 214.4M Q4, what’s your vibe?
1️⃣ Bullish, $ 20+ stacks up 😎
2️⃣ Neutral, Solid, risks linger 🤷
3️⃣ Bearish, Costs clip it 😞
Vote below! 🗳️👇
(9/9) – FINAL TAKEAWAY
NASDAQ:MARA ’s $ 214.4M Q4 and $ 3.94B BTC pile stun—mining hauler Costs creep, but grit shines—gem or bust?

BITCOIN ($BTC) DIPS TO $82K—FEAR OR FORTUNE?BITCOIN ( CRYPTOCAP:BTC ) DIPS TO GETTEX:82K —FEAR OR FORTUNE?
(1/9)
Good Morning, TradingView! Bitcoin ( CRYPTOCAP:BTC ) slumped to $ 82,000, lowest since Nov ‘24 💰 Market’s glum, let’s unpack this crypto dip! 🌐
(2/9) – PRICE SLIDE
• Drop: $ 82K, 20% off $ 109K high 📊
• Month: Altcoins down 30%+ 💧
• Fear Index: 10/100, rock bottom 😟
CRYPTOCAP:BTC ’s shivering, gloom’s thick!
(3/9) – TECH TELL
• 200-Day MA: $ 81,500, support holds 🌟
• RSI: 28, oversold, bounce hint 🚀
• Past: Aug ‘24 $ 49K to $ 100K 📈
CRYPTOCAP:BTC ’s teetering, rebound or rubble?
(4/9) – MARKET MOOD
• Fear: Lowest since FTX ‘22, $ 16K 🌍
• History: Extreme fear sparks rallies 🌞
• Outflows: $ 1B from ETFs, trade woes 💼
CRYPTOCAP:BTC ’s testing, panic or patience?
(5/9) – RISKS IN PLAY
• Trump: Tariff talk, no crypto juice ⚠️
• Volatility: Bear turn stings 🐻
• Stablecoins: Inflows, sideline cash 🔒
CRYPTOCAP:BTC ’s wobbly, can it dodge the funk?
(6/9) – SWOT: STRENGTHS
• Base: $ 82K holds, tough nut 💪
• Past: Fear flips to gold, $ 100K+ 🏋️
• Liquidity: Central banks ease 🌿
CRYPTOCAP:BTC ’s gritty, battle-tested!
(7/9) – SWOT: WEAKNESSES & OPPORTUNITIES
• Weaknesses: Sentiment sinks 😕
• Opportunities: Fear buys, rate cuts 🌏
Can CRYPTOCAP:BTC vault past the blues?
(8/9) – CRYPTOCAP:BTC ’s $ 82K dip, what’s your take?
1️⃣ Bullish, $ 100K rebound soon 😎
2️⃣ Neutral, Holds, risks linger 🤷
3️⃣ Bearish, $ 70K slide looms 😞
Vote below! 🗳️👇
(9/9) – FINAL TAKEAWAY
CRYPTOCAP:BTC ’s $ 82K slump spooks, fear at 10 🪙 $ 1B ETF outflows sting, but history hints bounce, gem or gloom?

BTC - Key Zones & Liquidity InsightsBINANCE:BTCUSDT is currently oscillating within a new trading range, establishing a trustable support zone while facing a weaker resistance trendline and resistance zone. Given this setup, a breakout isn’t the primary expectation just yet.
🔹 Key Observations:
Support Zone Strength: The support zone is stronger than the resistance, making it less likely for BTC to break downward easily.
Resistance Weakness: The resistance trendline and zone appear weaker, meaning any rejection could be temporary.
Liquidity Perspective: As seen on the liquidity chart, there’s favorable liquidity above the resistance zone, increasing the probability of a short-term push higher to hunt liquidity.
💡 Potential Scenarios:
1️⃣ BTC could move toward the resistance zone, tapping into liquidity before reacting.
2️⃣ If buyers step in aggressively, a short-term liquidity grab above resistance might trigger further upside.
3️⃣ Failure to reclaim key levels could lead to continued range-bound movement.
🚀 Stay ready for the next Bitcoin move! Follow for real-time updates and professional insights! 🔔

BTC - 15m Scalp OpportunityCOINBASE:BTCUSD is consolidating within a narrow range, and a breakout could trigger a strong move. Given the sharp drop yesterday, this ascending channel may act as a bearish flag, signaling a potential continuation of the downtrend.
If BTC loses support, expect another significant fall. Watching for a breakdown confirmation!
📉 Stay alert for price action signals!

Is Bitcoin Heading to $78K? Key Patterns Explained!
''BTC/USD: Key Supply Zone in Focus''
This chart highlights a significant supply zone between $94,858.98 and $95,979.83, marked by previous price rejections (indicated by the arrows). This zone represents a key area of resistance where selling pressure has historically dominated.
If the price revisits this zone, there’s a high probability of another rejection, potentially leading to a downward movement. Traders should monitor this area closely for potential short opportunities or signs of a breakout.
👉 What’s your take on this supply zone? Will it hold, or are we breaking through? Let me know your thoughts in the comments!
"BTC/USD: Bearish Head and Shoulders Pattern"
This chart showcases a classic Head and Shoulders pattern, often regarded as a bearish signal. The price has already broken the neckline, indicating a potential continuation to the downside.
The target for this pattern lies near $78,490.59, calculated based on the height of the structure. Combined with the current price action, this setup suggests further bearish momentum could be on the horizon.
👉 Do you agree with this bearish outlook? Or do you see a reversal coming? Share your analysis in the comments below!

BTC - 1H PulllbackBitcoin has formed a bearish descending channel following a sharp bearish spike, indicating continued downward momentum. Currently, the price is showing signs of recovery and may rise towards the channel base around the $97,000 resistance zone.
This resistance zone, marked by previous rejections and high selling pressure, is a critical area to monitor. It offers a potential opportunity to enter short positions if rejection signs are observed, with expectations of further declines from that zone.
Traders should remain cautious and wait for confirmation of price action at the resistance before entering positions. Both bullish retracements and potential rejections at resistance offer opportunities for strategic trades. 🚀

BTC Target Price & Supports after 12/30/2024 structure break.BTC has broken its current market structure and is now seeking new support. I’ve identified three key support zones and a potential target price to monitor for the future. I plan to execute three trades, each with a 2% risk allocation. The exit strategy will be determined later, but for now, the target price serves as the anticipated level for evaluation.

BTC - 1H a Pullback scalp with RSI RSI divergence at the top of the ascending channel hints BINANCE:BTCUSDT may hunt liquidity at lower levels before tomorrow’s FOMC news.
BITSTAMP:BTCUSD

Bitcoin Long - Quick Short SqueezeI do believe we're in a downtrend which is far away from being over. However, I expect a short squeeze because of untested price areas in the upper range. Should be quick and dirty. Re-Short at "Panic Cover" lines.

BTC - 4H fall for nowWhen it comes to market sentiment, a popular saying is, “When everyone is on the same side, it’s time to go the other way.” This concept aligns with the contrarian trading strategy, where savvy traders often position themselves in the opposite direction of the majority. Currently, with widespread excitement and optimism about a potential BTC bull run, it’s possible that we’re setting up for a correction rather than a sustained rally.
Historically, markets tend to pull back when optimism reaches a peak. For example, in 2017, as BINANCE:BTCUSD neared $20,000, the market sentiment was overwhelmingly bullish, yet that’s when BTC took a sharp downturn. Similarly, in early 2021, when Bitcoin was approaching $64,000 with much hype around institutional buying, we saw a significant correction that shook many investors.
In this context, the chart here shows MARKETSCOM:BITCOIN touching a strong resistance zone around the $76,000 level. With sentiment bullish and many expecting a breakout, BINANCE:BTCUSDT may likely trap some of this optimism and head lower first to “clear out” the overly crowded long positions. This potential pullback could lead to a more sustainable rally later after the excess sentiment has cooled.

BTC Shark to 5-0 PatternBitcoin is currently in a weekly Shark pattern, suggesting a potential pullback to complete the 5-0 pattern. We could see a move towards the T1 zone at $45,703 - $43,000.
5-0 Pattern: This pattern often follows the Shark pattern and indicates the completion of a corrective move after the initial reversal. The 5-0 pattern has a distinct structure, starting from the end of the Shark pattern and typically leading to a trend continuation after a brief consolidation or retracement.
The last wick to $49,000 was swiftly bought up, indicating the low might already be in. However, with the SPX nearing equal highs and possible volatility around Jackson Hole, a retest of lower levels remains possible.
RSI is trending just below the 50 zone on Daily and Weekly, suggesting a decision point is approaching. A move above 50 on the weekly would indicate the low is in, setting us up for upper targets at $70,315 / $76,197. If RSI rejects at 50, expect new lows.
Key Levels:
$49,000: A retest of this zone and a break above $63,139 will confirm the low is in.
A break below $49,000 will aim for the T1 Target at $45,793.
Buy Zone/Support Range: $45,703 - $43,000
$42,233 TD Support
The next few days will be critical. If we hold above $49,000, we may avoid a deeper correction.

There will be more bull season? #Bitcoin 3M chart#Bitcoin 3M chart;
Bitcoin chart in its simplest and broadest form. 3 months.
What do you see?
Let me make my own interpretation first, then share your thoughts.
In 2022, it went to the IMB region, took its support and made its current peak.
The breakout was MSS because it closed above it while doing so. This is an uptrend signal.
And again it visited the IMB zone for support.
This candle is a June candle, so the next candle opening will be in October.
I hope this is clear enough for those who say there will be no more bulls.

Despite The BTC Price-Top 3 Reasons Why This Crypto Is Going Up Listen it is difficult to find good
plays in crypto
because there are so
many tokens out there
to trade on the crypto market
but this one is unique
because it follows this
3 step system called
"The Rocket Booster Strategy"
The price is above the 50 EMA
The price is above the 200 EMA
The price is in a gap-up trend
This 3-step system is
the 3 reasons why this crypto pair
will go up.
Remember to learn more
rocket boost this content
Disclaimer: Trading is risky you will lose
money whether you like it or not
please learn risk management
and profit-taking strategies.

BTC price will reach higher levels next weekBitcoin will likely return to higher values next week, testing at least $68,000 again.
With all the good news on the horizon, things can only get more positive fot Bitcoin.

Bitcoin WayKeep that in mind :
- More we go Down.
- More the next bullrun will go High.
- Fibonacci Law Rule.
- Happy thanksgiving to everyone! 🐔
