XBTUSD - Ranging for several daysMid-term is still bullish, short-term - no clear direction. The price is trapped in the channel $11500 - 11800, HTF support at $10.8k. I think we should see another test of $12k, but not longing at resistance.
Break of $12k -> road to $14k.
Break of $10800 -> bearish.
Hit the "LIKE" button and follow to support, thank you!
Information is just for educational purposes, never financial advice. Always do your own research.
Btcprice

Bitcoin - August 5, 2020 (Bearish)BITSTAMP:BTCUSD
Hello everyone,
... back with another update.
The take-aways of today's post are:
- Yesterday was a non-event in terms of the BTC price (O: 11,236 <> C: 11,192).
- I remain bearish
** despite the (2.7%) recovery from yesterday's low ( 11,000 <= mark that figure...); and
** because BTC is still struggling with the .50 Fib level (11,330).
Let's take a look at the 4H chart.
- Since the August 2 dump, we have been range bound between the .382 Fib (10,920) and the .50 Fib (11,330) (disregarding the local high (11,480) of August 4).
- We are currently seeing a (minor) price rally , following yesterday's 11,000 low. However:
** volume has been declining consistently;
** we haven't (convincingly) broken the .50 Fib (11,330) resistance;
** we haven't set a (local) higher high (=> for that, we need to break above 11,480).
- On the plus side: we are currently above the 21-period (4H) SMA (red curve), the 21-period (4H) EMA (blue curve) and the 50-period (4H) SMA (green curve).
** Hence, the 11,230 - 11,270 zone will likely act as a first line of support.
If we take a look at the (4H) RSI chart, we see that
- the RSI (pink curve) has bounced off the .45 level and is currently on it's way up;
- there is no (hidden) divergence; and
- the Bollinger Bands have tightened significantly .
This suggests that a (short term) burst is on the horizon.
=> Given the positive signals on the RSI, I would expect a break to the upside .
However, unless that break (1) occurs with substantial volume and (2) takes out the previous local high (11,480), I will not change my bearish stance.
___________________________________________________________________________________________________
OPINION (Unchanged): BEARISH
ANALYSIS (updated):
-----------------------------
See above

BTC still above 10k | RSI in overbought region!Market in last 24hrs
-BTCUSD above 10k, price saw a good uptrend
-Price volatility was high. Market moved ~4.8%, between $10.3k and $9.85k
Today’s Trend analysis
-Expect uptrend to continue, might see some consolidation
-Price at time of publishing: $10,248
-BTC’s market cap: $188 Billion
-Oscillator indicators are mostly neutral. RSI at 75
-Moving average indicators are biased towards uptrend. Ichimoku Cloud is neutral
-Volume indicators are indicating continuation in uptrend as green candles saw big volumes while red candles saw less than 20 candle average volume.
Price expected to continue uptrend. Most of the Oscillator indicators are neutral. MACD is postive above 187, increasing histogram is a bullish sign. RSI is trending and at 75, it is above the overbought region since the last few candles. CCI rose above 0 and is in overbought region, which is a bearish sign. Another interesting point to notice here is that price has been going above the upper bollinger band and we might expect some consolidation.
----------------------------------------------------------------------------------------
The analysis is based on signals from 28 technical indicators, out of which 17 are moving averages and remaining 11 are oscillators. These indicator values are calculated using 4 hr candles.
DM to get details of the above analysis and list of indicator & their values used to arrive at the above conclusion.
Note: Above analysis would hold true if we do not encounter sudden jump in trade volume .
----------------------------------------------------------------------------------------
If you find the analysis useful, please like and share our ideas with the community!
- Mudrex

BTCUSD - Touch 9300 next?Bitcoin price still in a tight range, but on 4h timeframe it touched $9k zone again and bounced. The price is slowly, but moving to the upper border of the range - it is logical to assume we'll touch it.
Don't really see exciting setups here, R:R is not good, maybe short from $9350. Based on this month data it was a decent place to do so.
Hit the "LIKE" button and follow to support, thank you,
Information is just for educational purposes, never financial advice. Always do your own research.

BTCUSD expected to uptrend | RSI bounces back Market in last 24hrs
-BTCUSD bounced and then continued downtrend as shown in last analysis.
-Price volatility was low. Market moved ~1.1%, between $9.05k and $9.1k
Today’s Trend analysis
-Expected Uptrend as RSI bounces
-Price at time of publishing: $9,102
-BTC’s market cap: $167 Billion
-Oscillator indicators are mostly neutral. RSI at 41
-Moving average indicators are biased towards downtrend. Ichimoku Cloud is neutral
-Volume indicators are indicating continuation in downtrend as price increase saw decreasing volume suggesting uptrend is not supported by volumes.
Price expected to continue downtrend as price increase were not supported by volume . Most of the Oscillator indicators are neutral. MACD is negative around -33, increasing histogram is a bearish sign. RSI bounced from 30, still below midline which is a weak bearish sign. CCI rose from oversold region, which is a neutral sign. Another interesting point to notice here is that in 1 hr candle we are seeing breakout after bollinger band squeeze.
----------------------------------------------------------------------------------------
The analysis is based on signals from 28 technical indicators, out of which 17 are moving averages and remaining 11 are oscillators. These indicator values are calculated using 4 hr candles.
DM to get details of the above analysis and list of indicator & their values used to arrive at the above conclusion.
Note: Above analysis would hold true if we do not encounter sudden jump in trade volume .
----------------------------------------------------------------------------------------
If you find the analysis useful, please like and share our ideas with the community!
- Mudrex

BTCUSD to continue downtrend after rebound | RSI trends down!Market in last 24hrs
-BTCUSD saw strong downtrend
-Price volatility was high. Market moved ~2.5%, between $9k and $9.23k
Today’s Trend analysis
-Downtrend to continue after rebound, RSI moving down is a bearish sign
-Price at time of publishing: $9,080
-BTC’s market cap: $167 Billion
-Oscillator indicators are mostly neutral. RSI at 33
-Moving average indicators are biased towards downtrend. Ichimoku Cloud is neutral
-Volume indicators are indicating continuation in downtrend as red candle see high volumes
Price expected to continue downtrend after a rebound as RSI trends down and bollinger band width expands indicating increased volatility. Most of the Oscillator indicators are neutral. MACD crossed below 0, increasing histogram is a bearish sign. RSI trends down and is around 33, which is a bearish sign. CCI is very negative -220 , in oversold region indicates a rebound. Another interesting point to notice here is that previous candle closed below bollinger band, indicating downtrend might continue.
----------------------------------------------------------------------------------------
The analysis is based on signals from 28 technical indicators, out of which 17 are moving averages and remaining 11 are oscillators. These indicator values are calculated using 4 hr candles.
DM to get details of the above analysis and list of indicator & their values used to arrive at the above conclusion.
Note: Above analysis would hold true if we do not encounter sudden jump in trade volume .
----------------------------------------------------------------------------------------
If you find the analysis useful, please like and share our ideas with the community!
- Mudrex

BTCUSD: Preparing Continuation SetupsBTCUSD has been consolidating above the 100% point from YTD low during the last two months. Seemingly, the pair is now getting ready to probe the sub $9k area as a failure-test. If offers dry up as price dips beyond that range, which is expected to happen if the failure-test occurs, the price action is likely to wick that area and proceed higher as a result. It seems reasonable to be looking for limit buy setups in the $8.7k area.

Daily BTC targets 07.05.2020Here are your price targets for BTC
Currently Sellers are not letting the bulls to pass by these critical resistance levels
Buyers have prepared heavy buy orders on those support levels

Bitcoin Scenarios for Halving and BreakoutCurrent scenarios on the 3 day chart:
After the big 3 day candle which closed yesterday, we're now waiting 3 days for the current candle to close. A close near current price will create a spinning top or indecision candle, which will suggest a strong move upwards (see blue box)
Alternatively as per red box: possible dip to find support around $7425 as a launching pad for breaking through long-term strong resistance trendlines above.
Shorter time-frame analyses to follow to track the scenarios as they develop.

Bitcoin Dominance Under PressureQuite revealing to look at the big picture alts vs btc. Lots of targets down as bitcoin loses dominance to a new alt coin bull market.

BITCOIN | Bullish Breakouts!Hi,
The price of Bitcoin has made a short-term "Double Bottom" inside a bullish chart pattern called "Bull Flag".
At the moment we got a breakout both of them, the last 1-hour candle made a break and close above the "Bull Flag", the "Double Bottom" is also valid because the last bullish 4-hour candle made a pretty decent climb and the last 1-hour candle made a close above the Double Bottom neckline.
This orange line has been quite a strong resistance level, which is also a round number of $7,000 - this is also cracked!
Hopefully, it is not a fake-out and to get better entries, wait for a throwback to $6,800 - $7,000 and the criteria are:
1) Break and close above the "Bull Flag", if you struggle with confirmations then wait for a 4H candle close to get more secure breakout confirmation.
2) Double bottom formation around $6,500, the neckline is broken and the pattern is valid!
3) Break above the round number of $7,000.
4) Break above the strong resistance levels which are around 7k.
5) As said, if we get a current 4H candle close also above the mentioned levels then it will be more secure and after that, the current 4H candle close above those criteria gives us also a close above EMA's 50, 100 and 200!
* The major target should be around $8,000.
A pretty decent pump from the bulls, a lot of levels have broken and to get more secure confirmation, wait for a 4H candle close!
Do your own research and please, take a second and support my effort by hitting the "LIKE" button, it is my only FEE from You!
Regards,
Vaido

BTC-USDT my idea after crona shock!After the big shock i think bitcoin need time to come back again....

Bitcoin| BTC About To BreakOut From Triangle Whats Next? 7600$?BTC Update!!!
BTC Making A Pennant Here On 4H Chart..Price Holding Now End Of The Triangle.We Can See A BreakOut Or Breakdown Soon..We Have 2 Option For Now.
BreakOut: If BTC Manage To Breakout From This Pennant Then Next Target Around 7600$ Which Was Last Time Support Level And MA200 Resistance Zone..📈
BreakDown: If BTC BreakDown( 6200$ ) From This Pennant Then We Can See Another Flash Crash Till MA50 (5500-5700$).📉
Like Us
Follow Us on telegram
t.me/cryptospecialsignal

BITCOIN | Multi-Timeframe Analysis! (Mid-, Long-Term Bias)Hi,
BTC price in this year: +9%
BTC price this month: -8,5%
Monthly Timeframe (TF)
I would like to start my deep-down analysis from the Monthly chart.
A few months ago the price action drew a strong bullish candlestick pattern. Actually, this is the most powerful bullish candlestick pattern formation I can ever imagine: the Morning Star (one of my favorite candlestick patterns) has formed on the Monthly TF - the higher is the timeframe the stronger is the candlestick pattern formations!
Morning Star consists of three candles and at the moment it took three months to print this into the chart. The good thing about this formation - it came from the level of Fibonacci retracement 62%, also known as a Golden Ratio. Perfect formation from the perfect support level.
Now, after the close of January when the pattern got confirmed, the price has made a throwback (it has moved downwards) and actually, on the Monthly TF, everything looks healthy. Healthy? It has moved downwards, how can you say it is healthy? Yes, I can! This is the normal market behavior, prices cannot go upwards with one impulse! This is a rear case of scenario and if it happens ones (Bitcoin movement on 2017), if it happens twice (Bitcoin movement on 2017 and Tesla movement on 2020), then people start to think that this is normal and it can happen on every time, but NO it cannot! The market moves on the waves and to me, this correction is healthy because the bullish candlestick pattern is valid until it hasn't reached below the pattern low. In this case, if the price falls lower than $6,400 then this bullish candlestick pattern is not valid anymore and I can say that my bias was wrong!
Summary: Monthly TF offers a bullish candlestick pattern, formed from the great support level and my mid-, long-term bias is still bullish.
Weekly Timeframe
Weekly TF offers a strong horizontal price zone , it has worked historically in several cases (as an S&R line) and it stays around $7,500. In the weekly, there is also a blue trendline which may act as a support level, around the current level is also a Fibonacci Golden ratio , plus the Weekly EMA100 . To me, this entire area around the current price (marked with green box) is actually a pretty strong support zone. It consists of multiple long-term criteria that can hold the price and considering bullish candlestick pattern on Monthly then this area can even push the price upwards!
Also, I would like to formulate a hypothesis. The current support level can be also one part of a bullish chart pattern called Inverted Head and Shoulders (IHS) , this can be a right shoulder. As we all know, the chart patterns are valid only after the price has made a breakout from them, and IHS gets ready after the price is higher than the neckline (it stays above $10,500) BUT currently, it is nice to know that the current mentioned support area can be also one part of the bullish chart pattern!
Summary: Considering bullish candlestick pattern on the Monthly, considering that marked support area ($7,000 -$8,000) on the Weekly (consists of strong criteria) then my bias remains bullish.
Daily Timeframe
Major image
The Daily TF allows drawing another trendline. To be said it is quite subjective but it has one strong criterion or even two: it touches all wicks and most importantly, this trendline has one breakout candle (on 14. Januar 2020) and it is strong(!), which allows predicting that in the future it might work perfectly as support.
In my opinion, the price might fall a bit lower because on the lower levels are stronger and the waves of AB=CD are pointed to ~$7,000-$7,300.
SUMMARY: Overall I'm mid-, long-term bullish because the Monthly bullish candlestick pattern is valid and the Weekly TF offers a strong support area.
On the Daily, I can see that the price might want to go lower but if I see a bullish candlestick pattern on the Daily TF, inside the marked area, then I'm ready to jump in a bit earlier than the mentioned low BUT I would love to see price touching $7,300-$7,000!
Do your own research and please, take a second and support my effort by hitting the "LIKE" button, it is my only FEE from You!
Regards,
Vaido

BE READY FOR THE WHAlE BREAKOUTAT BTC!! 6800 AREA COMING@!! -> GLBANK, and i say it again LBANK, where expecting the big buy volume will come from a whale.
-----> As said before in my other post, expecting bitcoin soon to 6800, remmber we already are big in red!! , and whale recovery is a must now.
--------------------> As always , i have said this at time. price now 6090 around.
And the update price did start below 6K.
Follow me for more new profit updates base on data/trends/whale effects.
# This is a expecting, nobody know the future.

BTC ABOUT TO BREAKDOWN to 7100 after new study in BTC WHALES -@@Dear BTC holders and traders,
After my btc study i found that btc still in down trend, and the whale effect are still high. i have checked the volume and trends, and did make this with data as expecting what btc price will become Next time. and yes -------------------------------------> 7100 area we can hit soon!
I expect btc will hit soon the 7100 area!
# This study made beacase of trends/news/data/whales effects at this moment are.
AGAIN AS I SAY ALWAYS, I HAVE SAY THIS AT TIME, BTC PRICE RATE NOW: 7855 USD
# THIS IS MY EXPCTING, NOBODY KNOW THE FUTURE.
IF YOU LIKE YOU MY POST, DONT FORGOT TO GIVE ME A LIKE AND TO FOLLOW ME FOR MORE NEW UPDATES.
THANK YOU

Trend in TrapHello Everyone!
This is my analysis on BTCUSD
. Black numbers (1) and (2) major resistance where (3) is Key Support
. Dotted Black Lines shows parallel channel where candles may lay for a week or half before making any clear direction for green or Red.
. major 0.382 fib rejected for now, making short spikes and deeper lows until moderation is perceived.
Every thing is drawn on chart , i hope there is no confusion.
Check my Previous analysis and thumbs up if you like the idea.
Have Safe Trades,
Good Luck! :)

CARDANO ABOUT TO BREAKOUT HIGH LEVEL ---> ADA BREAKOUT EXPECT!I expecting a breakout in cardano next time.
This depens on new updates/trends in ada.

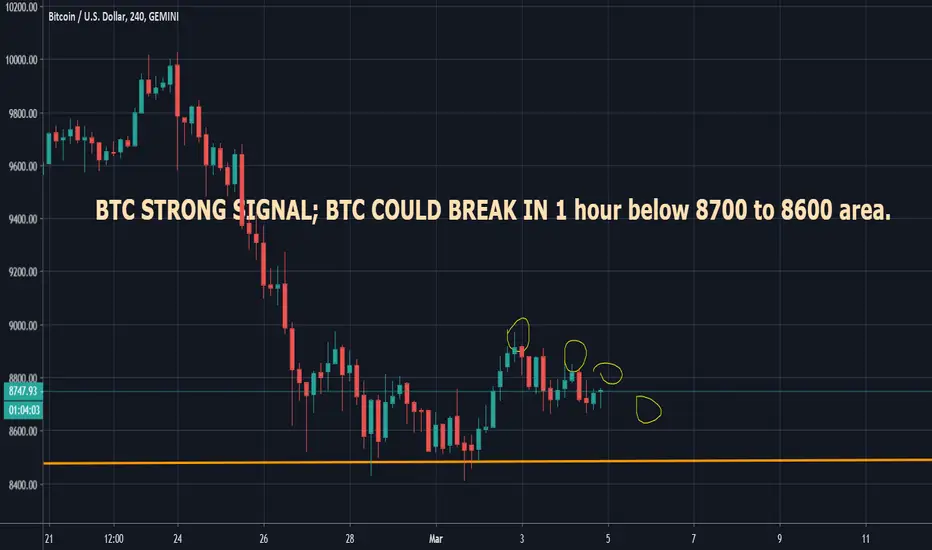
GOLD CHART!! BTC COULD BREAKDOWN THE AREA 8700 in 1 hour !Its possible that btc will breakdown the area of 8700, i have a strong signal that this are possible in this next hours.
- remember everting is possible in btc, this are only my expecting!
you know btc can change in just 1 min with bad news-or whales effect.
I expecting in 1 hour btc below 8700. ( its now around 8750)
Have good time all.
AREA 8200-8300 LOOKS COMING!Bitcoin can go soon to area 8200-8300 as it looks, but as you know guys btc can go all sides, it need only bad news, or whales and it can change.
This info you see here is just a expecting.
# Most of expectings was right.

this look Bitcoin Bull trap coming from 8900 area! GOLD CHART!!Bitcoin looks to get a bull trap, is this a real increase or a bull trap? i expect the second one.
depens on last trends/expectings/whales effects.


BTC-USDT: is it a bullish rectangle?i think it's a medium size rectangle.... what do you think?
do not forget to leave a comment even if you are not agree with me..
