BTCUSD Bouncing off 9500, trying re-entry into 10000!Our previous Crucial Point of intersection between the parabolic extension and sloping resistance has played to the 'T' with a number of Doji candles and we are now found waving sideways on the 9500 region. As it stands the bulls cannot keep a healthy run to the upside and further drops would be completely normal correction where bulls will most likely gather for the next charge at critical points 9000, 8600, and worst case scenario 7600. There is speculation that we may drop as low as 6k, anything is possible but i wouldn't bet all my cards on that kind of storm.
As always Trade Safely, Happy Trading.
Btcprice

BITCOIN | $9000, Watch It!!Hi followers,
sorry for the low count of updates and idea post, as said I'm on my vacation but I'll try to give some short-term guidelines and areas where the BTC price probably wants to go and wants to bounce ;)
First of all, thank you for the support for my last post, it was a really great call and actually, the "Sell" was also pretty nice, I could not put the idea post but at least I mentioned it that the $13,100 can be the reversal area!
I've been away from the charts pretty long time, to be said, I'm more active again on next Monday but let's jump into the charts.
Firstly, a bit of educational staff, remember what I said after the Gravestone Doji formation a couple of weeks ago on the Weekly chart. The "clean area", read about it on the 4 July post. Summary, it was a really bearish sign from the Weekly but if the wick is too high compared to other candles then there is a tendency to fill this area, it's like gaps in Forex, 80-90% of the time the market fills those gaps.
The current action and a possible bounce area.
Currently, the price is around the psychological level of $10,000. Once it has worked perfectly as a support level but now, the bigger picture and the price structure are pointed into lower levels. The BTC price has made a new lower high and the bigger downwards channel are pointed into the lower levels.
The last Weekly candle was bearish, the downwards channel indicates that the price may go into the lower levels and the new lower high in 10th July indicates that the BTC price has taken a 'correction direction'. The next leg down should get confirmed after the 4H candle close below the 10k BUT definitely, it wouldn't be high probability trading setup.
The high probability trading setup waiting for us around the $9,000. Multiple reversal price action criteria matching each other in the blue/reversal box. Actually, some of the reversal criteria matching really nicely and almost punctually on the same price level.
High probability short-term BUY setup between $8,700 - $9,000!
Here are the criteria:
1. Parallel channel lower trendline should act as a support level
2. Daily EMA 100 should work as a supporter
3. Previously worked resistance level on May 27-29 starting to act as a support level.
4. AB=CD from the top and the D point is exactly inside the blue box.
5. The round number $9,000 can play an important role on the list of the criteria
6. The black trendline, it has worked as a support level, it has worked as a resistance level and hopefully, it works currently as support. It is not the textbook trendline but definitely, it adds a bit strongness into the reversal area.
7. Fibonacci Extensions
Recently, technically those strong areas have been worked pretty nicely, hopefully, this is not an exception. ;)
SUMMARY: The downwards movement has been pretty sharp, this could lead us into the move which can drive the price a bit higher levels but it is what it is. Currently, the strongest and the highest probability short-term trading setup waiting for us just around $9,000.
Do your own research and if this matching with mine then you are ready to go!
Please, take a second and support my effort by hitting the "LIKE" button, it is my only fee from You!
Best regards,
Vaido

BITCOIN - Bullish Breakout From Three Chart Patterns!Looks like the market wants to go higher, we have already a 1H breakout confirmation and if we get also 4H confirmation then this breakout could be more secure but currently 3 hours to go and as you know things can happen quickly.
Bullish criteria:
1. The price is above the major counter trendline, this dotted line from the top. Counter trendline breakouts into the bigger trend direction have played out pretty nicely so, let's see!
2. The BTC price is above the counter trendline which is an indication that the short-term downwards movements can turn into bullish. Just some minutes ago we got a breakout from the triangle:
It is a bullish breakout but that's not all...
3. The Bitcoin price made a breakout above the bigger triangle:
4. This bigger triangle upper trendline is also an important line from another bullish chart pattern called Inverted Head & Shoulders:
5. On 1H we have EMA Golden Cross which will be a momentum indicator that the price can climb higher.
SUMMARY: The BTC price trades above the major counter trendline, it has made on 1-hour timeframe bullish breakout from the three chart patterns - from the smaller triangle, from the bigger triangle and from Inverted Head and Shoulders. The price structure and overall view on the chart are supporting that move upwards. It can possibly reach as high as $13,000.
If 4H gets a close above those patterns then it is a pretty clean breakout, haven't seen it for a while so, it would be pretty interesting to watch - do this works or not. As said, the more secure breakout would be a 4H candle close above prementioned chart patterns and if it gets a close above the $12,000 then it would be even better. Then we should get also a new short-term higher high and the road is fully open into the $13,000!
Do your own research and if this matching with one of my three options then you are ready to go!
Please, take a second and support my effort by hitting the "LIKE" button, it is my only fee from You!
Best regards,
Vaido

BITCOIN | Multi Timeframe AnalysisAnother week is over and another month is over, it's time to look; what has happened and what can happen in the future.
We have a Monthly candle close, a month which was full of emotions. Some top altcoins were very stable meanwhile BTC got pumped pretty heavily & etc. A lot of positive news, a lot of interest in Crypto, especially Bitcoin - to be said, interest in the Crypto assets has been never so high. Fundamentally everything looks great and the future looks bright, technically it doesn't look as good it looks fundamentally, especially short-term or even mid-term, anyways let's start:
Monthly timeframe:
5 months in the row the Bitcoin price has climbed upwards (5 green candles). Historically, it has shown a couple of times six months climb but "recently" 5 months has been maximum. So, July can be the month where the BTC price makes a throwback and we have also a visual similarities whit the ATH candle which has occurred in December 2017:
Basically, technical analysis and candles are based on human psychology, that's why we can rely on certain patterns. Currently, we see small similarity compared with Dec. 2018, which will indicate that end of the July we may see a red candle close, plus the Fibonacci golden ratio supporting that prementioned similarity. The rejection came from the 62% Fibo retracement level and we should all know that historically, BTC loves that level. Multiple pullbacks/throwbacks have ended exactly on this Fibo level.
Weekly timeframe:
Let's dig into the Monthly candle - Weekly chart:
The price action on Monthly timeframe wasn't so ugly as it is on the Weekly. As I mentioned the rejection came from the Fibonacci level, plus the rejection came from the strong price level which stays between $11,600 - $13,600 (blue area on the picture). The strong area has worked multiple times as a support level and as a resistance level. Only two big candles, up and down, has managed to break this level. Last week, it worked perfectly as a resistance level. The rejection from ~$13,800 ended inside the downwards channel (pulled on the line chart to remove market noise) and here comes the first difference compared with ATH price action, the last Weekly candle close gave us a bearish candlestick pattern called "Gravestone Doji".
If we add those reversal criteria, if we add those price levels where the rejection came then we should get a pretty good short, mid-term sell setup but wait for it, we need confirmations and we need those on the shorter timeframes. Let's skip Daily timeframe because it is not so informative and interesting, let's jump straight into the 4H chart.
4H timeframe, current price action:
What do we know?
- Fundamentally and interest vise, we are mid-term bullish but the market can't "fly" all the time, it has to make some throwbacks so...
- We have a throwback similarity compared with the previous ATH rally.
- We have a rejection from technically a strong area $11,600 - $13,600
- This rejection gave us a bearish candlestick pattern called "Gravestone Doji"
Technically, and fundamentally a bit mixed signs but luckily the price has drawn a pretty good pattern which can support both biases. Obviously, the move gets confirmed after the breakout from the pattern, after the 4H candle close above or below of it.
The mentioned pattern is "Descending Triangle":
Fundamental bias breakout gets confirmed after the candle close above the triangle upper trendline (counter trendline) and above the blue horizontal line - $11,433.
It has started to form also a Double Bottom chart pattern:
Chart pattern itself should start to work after the neckline breakout (blue dotted line) but currently, the bounce is supported with the trendline, with the EMA100, with previously worked support levels and Gravestone Doji has a lot of "free space" between close and the top. The price can go and fill some part of that so, the move upwards gets confirmed after the 4H candle close above $11,433 and the first target stays between $12,000 - $12,500.
Technical bias gets confirmed after the breakout below the Descending Triangle and price vise - a 4H candle close below the $10,500.
As you see, the green arrows are a little bit more transparent than red arrows. This is because of the technical bias and this is because the Descending Triangle is a bearish pattern. Yes, it is a triangle and it has both direction breakout opportunities BUT more reliable is a breakout downwards. The first target is not far because we can't forget that the strong resistance from May 2018 may act as a support, plus there are some reversal price action criteria like Fibo, round number. Overall, the bearish direction can easily look like I have shown on the image and the last downwards target is around $8,500.
SUMMARY:
- "Fundamental bias" breakout gets confirmed after a 4H candle close above the triangle upper trendline (counter trendline) and above the blue horizontal line - $11,433.
- "Technical bias" gets confirmed after the breakout below the Descending Triangle and price vise - a 4H candle close below the $10,500.
Do your own research and if this matching with mine then you are ready to go!
Please, take a second and support my effort by hitting the "LIKE" button, it is my only fee from You!
Best regards,
Vaido

pattern is a pattern is a patternWE WONT BREAK THESE TREND LINES. IF WE BREAK THOSE TREND LINES MAGICALLY THEN YOU CAN THROW A SADDLE ON ME AND CALL ME SALLY!!!

BITCOIN - A Possible Sell OpportunityWe got a pretty good rejection from the short-term strong area, which ended up with a bearish candlestick pattern called bearish Engulfing.
I have to put it up quickly. I'll make an update about what is the criteria and etc.
Stronger sell confirmation should come after the candle close below the short-term counter trendline.
EDIT:
The market situation is a bit risky but we should have a pretty good opportunity to short it. The last 1H candle gave an indication that the selling pressure may have pretty solid because the rejection came from technically a pretty strong area:
1. From Fibonacci retracement levels 38% and 50%
2. From Fibonacci Extension level 127%
3. Channel upper trendline worked as a resistance
4. AB=CD waves.
5. The round number $12,000
6. And the rejection ended up with bearish candlestick pattern called "Bearish Engulfing"
The first target should stay around $11,200-300 and the second target is $10,000.
More secure trade entry would be after the candle close below the counter trendline, below the blue line and below the $11,000. So, wait for that!
Trade becomes invalid after the price gets a 1H candle close above the orange line.
Do your own research and if this matching with mine then you are ready to go!
Please, take a second and support my idea post by hitting the "LIKE" button, it is my only fee from You!
Best regards,
Vaido

BITCOIN - Summary & Some Key Levels!I make a little overview of which areas are on my watchlist - where are the key levels, why they are key levels and etc.
After yesterday's scalp post I started to make another analysis, sadly I didn't post it but there was the key area $13,500, at least I told it to my friends :) I said that if it goes above of it then I DON'T KNOW where it may go!
From where it got a rejection?!
Usually, I don't like this historical blablablaa...but hopefully you find something educational from here.
Firstly, the channel. Drawn from the bodies and if you want to remove the market noise then the best plan is to use a line chart:
The key points are those two bottom black circles, copy paste to the ATH and we get a parallel channel. Channel upper trendline acted as a resistance.
Secondly, Fibonacci. Pulled from ATH to the 2018 bottom and the Fibonacci Golden ratio 62% matches exactly with the channel upper trendline:
Thirdly, the strong area. Those orange lines, on the image above, mark an area where the price has made a daily low 9 times.
The Bitcoin price dropped $2,500 and those were the major technical aspects.
The current situation.
It is highly risky to trade in that kind of a market situation, especially if the price is middle of important areas. There can be fast pumps and dumps which can scare you out or take you out of the trades. To trade it, we need high probability areas. Recently, BTC has respected nicely my technical analysis, definitely you can find some mistakes but in general, it has been good times.
The first stronger retracement area stays around $11,500 but this isn't so reliable anymore because the price has already touched it.
The next one around the $10,000 should be the strongest previous resistance levels which now becomes a support. There is:
- The trendline, pulled from the 10. June low
- The round number 10k should act as a resistance
- Strong resistance from May 2018 becomes support
- Fibonacci retracement level 62%
This is the area where I start to look more closely what's gonna happen.
The current market situation is not really good for short-term traders and we should be patient. Let the market print new data after the massive movements, let it print some patterns and etc.
I try to make updates from the lower timeframes but in general, my eyes are pointed $10,000-$11,000 because I think the price can go and test the recent highs. If BTC price can crack the key level $13,500-$14,000 then the previous ATH is not so lonely anymore, probably it finds a companion ;)
"Learning more and more about the markets only to avoid pain will compound his problems because the more he learns, the more he will naturally expect from the markets, making it all the more painful when the markets don’t do their part. Stop guessing, trade what you see!"
– Mark Douglas
Please, take a second and support my idea post by hitting the "LIKE" button, it is my only fee from You!
Best regards,
Vaido

BITCOIN | Short-term Scalp Opportunity (High risk)Bearish price action from the top can offer a possible short-term scalp opportunity:
- 4H Shooting Star (bearish candlestick pattern). The candle was green, definitely, it would have much stronger if the candle has been red. Currently, bulls still dominated the last 4H hour but the Shooting Star has given a sign that sellers have started to come into the market.
- 1H Spinning Top (reversal indication)
- 1H Engulfing (bearish candlestick pattern)
This action has been around the ascending channel upper trendline. The channel upper trendline should work as a resistance plus some Fibonacci levels have pointed into the rejection area.
The current rally has been really powerful so, we have to search bearish price action to make some trades. At the moment we have something and it can be an opportunity to make a shot.
Do your own research and if this matching with mine then you are ready to go!
Please, take a second and support my idea post by hitting the "LIKE" button, it is my only fee from You!
Best regards,
Vaido

Buyers need to breakout this priceBuyers need to breakout this top of the range consolidation. COINBASE:BTCUSD
A big bullish candle a this price could be a very strong signal of a longterm bullish market for the COINBASE:BTCUSD and the cryptocurrencies world.
What your thoughts about that ?

BITCOIN - Key Price Levels!I have struggled with further scenarios, after the bounce from my mentioned level at $7,930, because there are two, almost equal, resistance levels which can play an important role in the next movements.
To be said, I'm still with mid-term bearish bias because of the Weekly bearish candlestick pattern Evening Star. The price can make another $150-$300 leg upwards but still, it doesn't hurt my bias. My bias starts to change after the price has climbed above the $8,700 and the Weekly candle gets a close around that level - the green "box". So, because of my mid-term bearish bias a search selling areas/opportunities.
At the moment, the price moves between $8,200 - $8,300 and this area is also our first resistance area - the lower gray "box".
There are:
- Fibonacci retracement levels 50% & 62% pulled from different tops
- Fibonacci extensions 127%
- The minor trendline (light blue) which is the upper trendline from the bearish chart pattern called Rising Wedge
- The area itself is a significant level. This price level has worked as resistance on mid of the May, beginning of the July it worked as a support and now it should act as a resistance level.
Now, the mentioned struggle - we have some bearish price action on the current levels (bearish candlestick patterns on the 4H and on the 1H), the level is pretty strong to short BTC from here, from the first gray area but Still, there is something which doesn't allow to do it, I don't know why it doesn't feel right to short it here but probably it is the buyers consistency from $7,500, steady grind upwards is usually pretty bullish for BTC price! So, that's why I'll wait for a further confirmation, if the price still starts to fall lower from the current level then another confirmation comes after the breakout from the bearish chart pattern Rising Wedge - a candle close below the lower light blue trendline and a candle close below the red price level ($8,110)will be a bearish confirmation and you should get at least 1H candle close below that level.
The second selling area stays around $8,500, this area was also the target 2. on my previous post. There are some price action criteria and they should act as resistance levels:
- Fibonacci golden ratio 62% and minor the Fibonacci level 78%
- Fibonacci Extensions 162%
- The round number $8,500 should act as a resistance.
- Depends on the price action but the minor trendline (Rising Wedge upper trendline) may act also as a resistance. It depends when it reaches into the higher gray area.
This level is just a little bit more favorable because of the Fibonacci level and visually it looks also better but if it starts to go right away then this area becomes also a bit riskier because then the price is cracked this minor light blue trendline and it can find a momentum to push it through the higher gray box. So, to be more secure then the bearish candlestick pattern is needed on the upper gray area and only valid patterns are bearish Engulfing, Evening Star, bearish Railway Tracks (if you don't know them, google helps you out).
SUMMARY: Pretty simple guidelines - the first area (lower gray zone) gives us a confirmed movement after the breakout from the chart pattern called Rising Wedge and the second area (higher gray zone) can give us a reversal trade opportunity after the bearish candlestick formations! Sell orders, because my bias is bearish because of the Weekly timeframe price action and this can "easily" change and it changes after the BTC price has climbed above the $8,700!
Feel free to support my effort by hitting the "LIKE", it is my only fee from You!
Best regards,
Vaido - Analysts for Swipex

BITCOIN | $8,200+, Wait For Confirmation!Another analysis and other possible patterns around the $8,000.
You should remember that the last Weekly candle close gave us a 66% probability, over a small sample size, that the price may go to the higher levels. This is our first tiny indications but we need some confirmations do be more secure about that because, as said, the sample size is tiny.
Overall, to trade on the markets we should know how to enter into the trade. Basically, there are two major options:
1. Reversal trades - trades where you should search through the criteria the strong areas where the smaller wave/trend may end to jump into the bigger trend.
2. Breakout trades - different chart patterns and price levels allow us to jump into the bigger waves which will guide us into future profits but only after(!) we have identified the breakout area and after(!) we have got a confirmation through the candle close.
At the moment we should look at the trade opportunities considering that point 2.
We should search confirmations from smaller timeframes and if I say smaller then the 4H is the smallest timeframe on BTC price graph, then Daily and etc. There you can trust more securely those patterns and breakouts confirmations.
As you probably have noticed, again the Head and Shoulders. This time it is Inverted Head & Shoulders (IHS) and it is a bullish chart pattern. To be said at first - that doesn't mean almost anything that this pattern formation is currently there. Almost? Almost because it could be an indication that this pattern helps us in further movements and you should be prepared after the pattern is completed. The IHS (and also regular Head and Shoulders) is ready, completed, triggered only(!) after the neckline breakout! Before that, it is just an indication/alert for you: "Soon we might get something" you should have this kind of mindset before that breakout from the neckline.
So, the possible IHS is marked on the chart and it starts to work after the neckline breakout. The breakout area should stay slightly above $8,200. If the 4H candle gets a close around the green area then it should be valid. Currently, IHS is pretty beautiful because the shoulders are formed exactly in the strong gray area. The gray area is strong because the price has printed only rejections and only strong/powerful candles breakthroughs on this area. So, a pretty good starting point but let's make a little summary about the pattern breakout. There is the first green box just above the $8,200 and if we get a candle close inside or slightly above of it then we have:
1. A break above the round number $8,000
2. A break above the strong price level $8,200
3. A break above the IHS neckline which triggers the pattern
4*. Breakout is supported with EMA golden grosses on the Daily chart.
5*. And if we add here the mentioned 66% probability from Weekly chart then this breakout looks pretty powerful.
If those breakouts have occurred then the price has to print new long-term higher high which stays above the $8,489 and actually the rally to the $10,000 may start.
If the Bitcoin price doesn't reach above the IHS neckline, if the strong area (gray zone at $7,560-$7730) doesn't hold the price anymore and if the price starts to fall lower from a bit subjective trendline then you should be worried. Another 4H candle close below $7,400 might be a place where the panic button gets triggered.
Currently, can't do anything we just have to wait! I just wait for that breakout upwards which gets confirmed after the 4H candle close above $8,200!
Feel free to support my effort by hitting the "LIKE" button, it is my only fee from You!
Have a nice day,
Cheers!
"Putting on a winning trade or even a series of winning trades requires absolutely no skill. On
the other hand, creating consistent results and being able to keep what we’ve created does
require a skill. Making money consistently is a by-product of acquiring and mastering mental skills."
– Mark Douglas
*This information is mostly used for educational purposes only!

BITCOIN - 66% Probability For Further Growth!Do you remember one of my previous post about the $8,000 level? There is discussed about certain directions on the Weekly chart after the Weekly candle close. This discussed week is over and we have to talk this through because this is strongly on the agenda.
Over the past, the Weekly candle has closed above the $8,000 price level three times.
Two times it has moved upwards:
- Breakthrough on 2017 November guided the Bitcoin price into the ATH (all-time high), close at $8,031
- Breakthrough on 2018 April guided the price to the $10,000 price level, close at $8,355
One time it had a fakeout
- Breakthrough on 2018 July was a fakeout, close at $8,216 and next week the candle goes back below $8,000.
Considering these small sample statistics then we have a 66% probability that the Bitcoin price can make a run to the $10,000 but let's search some confirmations and some price action criteria which will support that current move to the $10,000 and the confirmation area is pretty clean, if we can't reach higher than the confirmation level then this could be just another fakeout into the statistics. Why 10k? Simple, there just aren't any bigger resistance levels before that!
Last week the second half was full of emotions, the big correction from $8,000 to $6,700 which was discoverable through the candlestick patterns, a jump back upwards which brought out the Head and Shoulders pattern. I made an update about the pattern and after every hour I started to regrate it because the count of Head & Shoulders discoverers on the TradingView made that pattern weaker and weaker - if everybody can see it then there is a pretty high % that it doesn't work out as planned and exactly what happened. Those actions weren't enough yet, on Sunday, we got a big and strong boost (let's call it a Bart move) to the higher levels and the Weekly candle got a close above the $8,000.
As I said, we have a 66% probability that the price may go to the higher levels. The volume is high, several pumps and dumps here and there, so the market situation is risky and hardly recognizable, that's why we need confirmations and we have to search confirmations from the Daily chart.
To be said - the next bullish confirmation should come after the Daily (or 4H, definitely better would be a Daily candle close because of the noise on the lower timeframes) candle close above the green line at $8,489. Then the BTC price has made breakouts upwards from:
- The curve trendline , which has drawn from 5. March 2018. It played a significant role in the last week's correction from 8k to 6,7k, so, it is definitely a big break upwards after the close above of it.
- The first clean resistance , also it played a significant role in the last week's correction and after a break above of this resistance it makes new higher high, which is great considering even the long-term market perspective.
- The round number $8,000.
- Plus, we have a Golden cross on the Daily chart between 100 and 200 EMA's
There is also a little sign, we can call it even fractal or how they call it here but anyway, the last weekend printed into the chart a bullish candlestick pattern (shape) called Morning Star:
From the bottom until the current time we have had three Morning Star candlestick pattern formations. To be said for the smarties, those aren't the textbook formation, as I mentioned here we have to talk about the shapes/indications but the major criterion has to be there - the third/last candle has to close higher than 50% of the first candle full range!
Okay, we have had three Morning Star formations and after those formations, the price has made climbs upwards. The last one was before that rally from $4,000 to $5,000. I made that call and it played out very nicely, even more than expected!
Currently, we have a fourth Morning Star candlestick pattern formation on the Daily chart. The Sundays candle completed the pattern and completed the Weekly candle which made a break above the $8,000! It is a really good sign if the candlestick formation is supporting the breakout from some patterns or from some certain price levels and currently, the EMA's Golden cross works also as a breakout supporter. Currently, it is a good confirmation because we made a break above the round number with Morning Star candlestick pattern which will be a sign for further growth.
SUMMARY: We had a really nice last Weekly bullish candle close above the $8,000. The close end up on the Daily chart with a bullish candlestick pattern Morning Star which is a good momentum indication that the Bitcoin price can go higher in this week. Plus we had a small sample statistics that the pump may come with a 66% probability BUT the current situation is a bit risky and we need to get a confirmation. The next bullish confirmation to the $10,000 comes after the Daily or 4H candle (definitely, more reliable is a Daily candle close) has closed above the curve trendline, above the "first clean resistance area" which is also new HH area).
Shortly I add a smaller timeframe analysis, about the strong levels below the current price, when this $8,000 breakout becomes invalid and etc.
Feel free to support my effort by hitting the "LIKE" button, it is my only fee from You!
Have a nice day,
Cheers!
"Trading rule 1: Predefine what a loss is in every potential trade.
Trading rule 2: Execute your losing trades immediately upon the perception that they exist.
By predefining and cutting your losses short, you are making yourself available to learn the
a best possible way to let your profits grow."
– Mark Douglas
Read more about the $8,000 price level:
*This information is mostly used for educational purposes only!

BITCOIN - TWO Bearish Chart Patterns!I have received several requests about the update so, I will fulfill your wishes ;)
Last trading idea, from the strong area around $8,000 which got confirmed after bearish candlestick patterns was successful, the price dropped exactly to the lowest pointed strong area at $6,700. Really quickly it bounced back up and stopped exactly in the middle of those two price levels, yesterday it was really hard to say what we may see about next but today we have some conclusions about the situation on the market and I like to share those with you.
As you already noticed on the image above, the price has started to draw a bearish chart pattern called Head and Shoulders. This is even a pattern inside a pattern situation because, as you watch that top very closely then there is a Double Top formation:
The Double Top pattern is already valid and it's "working" because it has a breakout from the pattern neckline (as it is on the image) BUT really often the price retests the breakout area and after that, it continues to the breakout direction (shown on the image). Currently, this Double Top neckline retest matching exactly with the Head and Shoulders right shoulder, almost perfectly. We had before that drop from $8000 possibly two candlestick pattern to guide us downwards, right now we have two chart patterns which should guide the price down to the $6,000, let's see pretty interesting and actually, this level $7,800 is a pretty clean resistance level/Double Top neckline/Right Shoulder and it has multiple names - watch it closely!
Remember, Head and Shoulders starts to work after the neckline breakout downwards!
Definitely, the resistance around the orange line is pretty hard to beat but if the price still wants to make breakouts upwards then, remember, the confirmation was a Weekly candle close above $8,000 and the Bitcoin price should be heading into the $10,000.
"What separates the “consistently great” athletes and performers from everyone else is their
distinct lack of fear of making a mistake."
– Mark Douglas
Feel free to support my idea post by hitting the "LIKE" button, it is my only fee from You!
Previous analysis:
This mentioned Weekly chart analysis:
Have a nice weekend,
Cheers!
*This information is mostly used for educational purposes only!

BITCOIN - Correction Warning! Candlestick Pattern Indications!I would like to warn you about the current situation and about the current price action.
The price action on the strong resistance area, "the first clean resistance" as I said one of my previous posts, looks like bearish BUT it needs confirmation and the confirmation should come after today's candle close!!
Currently, the Daily candles have four rejections downwards from the $8,200. $8,200 level matching exactly with our clean resistance area and matching exactly with our well-known curve trendline which had three touches and currently, it makes a fourth:
As you see, the area is pretty strong and if You have read my previous post about this $8,000 level then we don't stay here for multiple weeks to consolidate, the price is here to make a move and today I would like to give you one confirmation area where the bearish move should get confirmed.
Candlestick pattern "Shooting Star"
Currently, the price has been around $8,000 approximately four days but those days have been pretty informative. The second Daily candle rejection from the blue line at $8,200 gave us a bearish candlestick pattern called "Shooting Stars".
This is correct Shooting Star, the body is perfectly 1:3 from the upper wick and it is pretty symmetrical , great, BUT this is a green one. Yes, it is a Shooting Star on the strong area but the green close means - sellers have started to come into the market BUT still, buyers dominated that day and they managed to hold that price up. It shows that sellers had an attempt to push the price down, we can't say that this is failed attempt but let's see, it is still a bearish candlestick pattern "Shooting Star" but it would be more reliable if it would be red (bearish).
Candlestick pattern "Bearish Engulfing"
Possibly, the second bearish candlestick pattern on the strong resistance area and this second one is more powerful than the first one, let me introduce to you - The "Bearish Engulfing".
Why possibly? Because the candlestick patterns are ONLY THEN VALID WHEN THEY ARE CLOSED!! So, currently, we have to wait for that today's candle close which may give us that mentioned confirmation and this mentioned confirmation will come after the today's candle close below the red line, below the $7,831 price level.
Overall, the Engulfing is a pretty strong indication especially if it is on the strong price level and currently the Bitcoin price is on the strong resistance:
- The round number $8,000 has worked as a resistance
- The curve trendline should act as a resistance
- The first clean resistance after that pump from the bottom!
To get that mentioned bearish Engulfing on this level, which is also supported by the hidden Shooting Star, would be a pretty nice indication for the movement downwards but let's see.
SUMMARY: We have two bearish candlestick patterns on the strong area, the second candlestick pattern gets confirmed after today's candle close and if it gets a close below the red line $7,831 then it is an indication that the correction may start (altcoins are also started to make something). IF today's candle doesn't get a close below that mentioned red line then this idea is invalid! The correction is "on the table" ONLY then when it gets a close below $7,831!
"The consistency you seek is in your mind, not in the markets."
– Mark Douglas
Feel free to support my idea post by hitting the "LIKE" button, it is my only fee from You!
Have a nice day,
Cheers!
*This information is mostly used for educational purposes only!

BITCOIN - The $8,000!Here is a quick overview of the $8,000 level. Definitely, it is an interesting level and interesting are also conclusions below in this analysis.
Historically it has been a very strong area, multiple times it has worked as a support level and as a resistance level. If we start to count those rejections (smaller and bigger) then we get 10(!) rejections from the blue area.
There is also one important factor which makes this area stronger. If the price want's to go through from it then it has occurred only with strong candles and there are 6(!) strong candles managed to push the price through the strong area! Every time when the price has reached into the marked area (blue marked area range: $7,700-$8,000) it makes something, so, here is the first conclusion - in this area, the long consolidation period is out of the options!
Let's talk about the direction after the breakout or after the rejection. There are 10 rejections and 6 breakthroughs. Three candles have made a breakout upwards and from there, two times out of three the price has got a bigger and a smaller rally:
- Breakthrough on 2017 November guided the Bitcoin price into the ATH (all time high)
- Breakthrough on 2018 April guided the price to the $10,000
- Breakthrough on 2018 July was a fakeout
So, we can do some math and we can say that a Weekly candle close above the $8,000 will be a sign that the price can go higher, at least two times out of three it has made a pump!
Things getting more interesting, as I said, we have got a pretty high numerous count of rejections BUT if the price approaching that $8,000 level as a resistance, then we have only ONE bigger rejection from it and the one mentioned fake out - on 2018 July, a candle close above of it and next week quickly downwards. The bigger rejection was exactly one week before the ATH breakthrough in November.
SUMMARY: This little overview and fifth-grade math will say that the price can take this level down but the sample size is not enough to say it "surely" and obviously, we need to wait for a Weekly candle close. In summary, if the price has approached this level from the bottom side then the breakthroughs and followthrough after that have been a more likely scenario IF this occurs but as said firstly the price has to close above the $8,000. The rejection is also valid because of the strong resistance which was in my previous post - below of this post.
"If you asked me to distill trading down to its simplest form, I would say that it is a pattern
recognition numbers game. We use market analysis to identify patterns, define the risk, and
determine when to take profits. The trade either works or it doesn’t."
– Mark Douglas
Feel free to support my idea post by hitting the "LIKE" button, it is my only fee from You!
Have a nice day,
Cheers!
*This information is mostly used for educational purposes only!
Previous analysis:

BTC-USD - Parabolic trend breakParabolic trend line is being broken it seems.
The show is over for now. A retracement of 30-40 % from current High can be expected (Is what BTC did in the past on pull-backs in a bull trend, and I assume that we are back in a bull trend by now!)
Alts should see some love. XRP takes the spot currently.
TRade safe,
cheers

BITCOIN - The First Clean Resistance Area, The New HH!?The consistency, the consistency, the consistency - I have mentioned it multiple times and again it is the major indication in the crypto world.
As you see those last candles getting bigger and bigger after every candle, that is exactly what I mean by that but let's take a look about the current situation.
First clean resistance areas:
Here, around $8,000, we have the first major clean resistance area. Remember the Fibonacci party in 2018, when every high was almost exactly that Fibonacci golden ratio 62%. Currently, the first blue area just above the current price is one of the tops from the Fibo party!
This level should put the price under the bigger pressure after the rally from 4k. Yes, the pressure was also around the $6k but this level got cracked pretty quickly - like a warm knife through the butter. Luckily/unfortunately this is not just a clean resistance, here we can find more interesting parts.
The curve trendline:
Touching points are marked as the green boxes and the fourth touch matching exactly with the strong resistance area around $8,000. This is not just a random curve trendline, to confirm that I made copy/paste and it matching exactly with the lower points on the graph. It makes an interesting curve channel where the price has drifted more than a year now.
Fibonacci retracement 38% & 62%:
38% is pulled from the 2018 high point to the 2018 low point.
62% is pulled from the point where the curve trendline starts and drawn to the 2018 low point.
Those together may give a slight impact, individually they should not work at the moment because of the price pump. One Fibo level can't stop this train but there is resistance, curve trendlines and now two Fibo levels which may(!!) give a possible rejection, if not, then we have also another scenario, scenario which needs a confirmation close.
Soon we can find out, do this level works or not, at least it should be a pretty hard test for the price. Whenever the throwback starts, it should be smoother than the upwards movement.
The scenario which needs a confirmation:
IF the price can reach above the mentioned strong resistance area (blue area) and if it gets a close above of it - at least Daily candle close is needed - then we have a pretty nice breakout upwards, long-term higher high (HH) is confirmed and the next major target is another strong and clean resistance area which is also the psychological level $10000. Can't promise higher levels than that but if the consistency continues then there is also one of the key resistance just above the $12,000. Actually, it is unbelievable that I have to type in five digits numbers after I say BTC price, it happened pretty fast :)
"Most people know that the outcome of a coin toss is random. If you believe the outcome is
random, then you naturally expect a random outcome. Randomness implies at least some
degree of uncertainty. When we accept in advance of an event that we don’t know how it
will turn out, that acceptance has the effect of keeping our expectations neutral and
open-minded. If you really believed in a random distribution between wins and losses, could
you ever feel betrayed by the market?!"
– Mark Douglas
Feel free to support my idea post by hitting the "LIKE" button, it is my only fee from You!
Have a nice day,
Cheers!
*This information is not a recommendation to go "LONG" or "SHORT", it is mostly used for educational purposes only!

BITCOIN - Finally, The Trenline(s)!!Again, I'm here to give you a little overview of the current market situation.
The market is very weird, BTC flying, altcoins are on the downswing (today they have started to make first steps to higher prices), the BTC price has cracked strong resistances after another, etc.
Just to bring technically good levels, I'm here to make a little technical analysis.
The resistance area which was around the $6,000 was on my watchlist for a while but it got weaker every time after someone made an idea post to the TradingView: "Watch this level!", "Look at $6k!!" If everybody can see those levels then market makers can use it easily . So, that's why I have been a bit cautious and haven't call any significant selling areas after the breakout from $5,500, but let's jump quickly to the current action, things can quickly change.
Fiannly there is an area where is one of my favorite price action criteria, an important trendline.
The black trendline which has three clean touches from last year (orange boxes). It has worked nicely as a support level and probably it plays also a significant role in the current resistance area. The significant part is the strong candle breakthrough in 2018 November. This strong candle shows that this level, this trendline is really strong because there was needed a hell of a power to push the price downwards. Now, it becomes a resistance and the price is really on the edge to make a correction so, it could be a nice area where it can start it. It should be a classical retest situation which took more than half a year!
Parallel channel projection, drawn from the bodies to remove market noise!
The major trendline is the bottom, copy/paste to the higher green point and we get a crossing are just above the current price with the black trendline, around $6,500.
Between light blue lines - Monthly Highs/Lows
There are 4 Monthly highs/lows. Not so significant but it matching exactly with our trendlines crossing area and still, it shows that the area is capable to print new lows and highs, which is a great confirmation!
The round number $6,500
It played a significant role in the second half of 2018. Price drifted between 6k and 6.5k, so, an area which should be on the chart to make a crossing area a bit stronger!
There are more some sloppy criteria but not so significant to mark those, only remarkable criterion is the Daily RSI Divergence , which is still on the chart!
Summary: The most important criteria are the trendline, which has a really powerful candle breakthrough (break below of it) and now it should work as resistance especially after that awesome price pump, and the parallel channel crossing area. There are other criteria to make that area a bit stronger but please, be patient. As I said before, the price has cracked resistance after another and easily it can be the next one. To be more secure about the resistance, you should wait for bearish price action around the marked area, around the crossing area. Bearish price action = bearish candlestick patterns on the higher(!!) timeframes 4H or Daily, bearish chart pattern breakouts on the 1H or 4H.
"If someone or something is against you and causes you pain, how are you likely to respond?
You’ll feel compelled to fight, but what exactly are you fighting? The market is certainly not
fighting you. Yes, the market wants your money, but it also provides you with the
opportunity to take as much as you can."
– Mark Douglas
Hopefully, it was helpful, feel free to support my idea post by hitting the "LIKE" button, it is my only fee from You!
Have a nice day,
Cheers!
*This information is not a recommendation to go "LONG" or "SHORT", it is mostly used for educational purposes only!

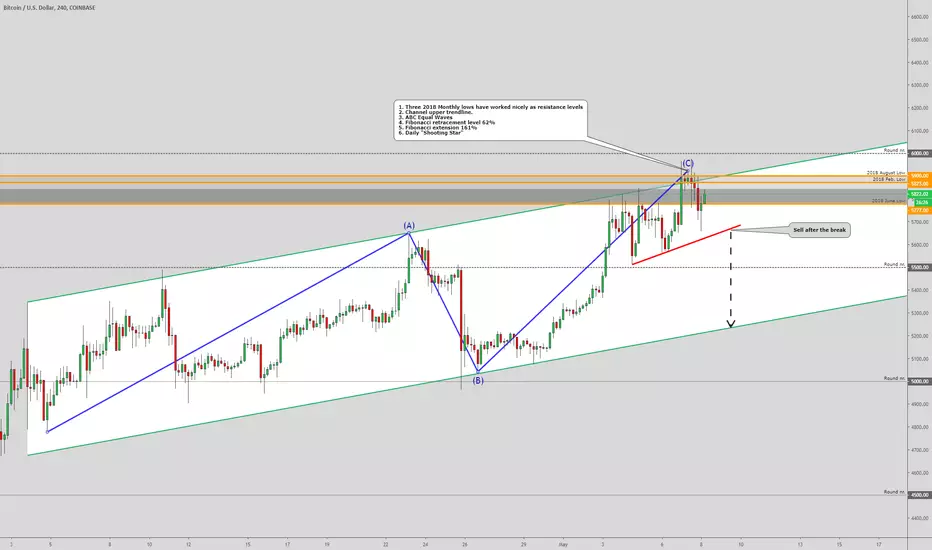
BITCOIN - Is It Possible To Catch SpaceX?Now, more than four days, the Bitcoin price has danced around the first strong price level between the mentioned super-strong resistance at $5,777-$6,106. Those orange lines mark three Monthly lows from 2018: June, February and August.
Yesterday the price reached almost to the $6,000 but it didn't get a close above the August low at $5,900 . Five(!) rejections from the mentioned resistance and the day got an end below the all of those marked Monthly lows plus below the Fibonacci 62% retracement level:
As you see on the Daily timeframe yesterday's candle close gave us a bearish candlestick pattern called "Shooting Stars" . It got a rejection from the all three Monthly lows which now has become resistances and rejection from the Fibo level which is pulled from the 2018 September high (~$7,400) to the 2018 low (~$3,125) point.
This Fibo level and those resistances have worked four times on the Daily chart - four attempts to go higher has failed, let's see what we gonna get from today's price action but looks like bulls are still trying to push the price up. Yesterday's bearish candlestick pattern was a slight indication that bears are starting to come in but slowly, slowly.
Let's count a bit more subjective price action criteria than those Monthly resistances and Fibo level which should make the area around $5,900 even stronger than it looks like.
Let's start from the ABC Equal waves.
A little bit complicated but try to stay with me - after the rally at the beginning of the April, the BTC price made a slight throwback and the ABC waves count would start from there, from 4. April low. Slowly climbing to point A on 23. April high, another throwback and there is point B. Now, equal waves are pretty nice price action criteria which will end some movements and corrections. Currently, the waves from point 0 to A and from point B to C are equal, both lengths are $877, and the C point is exactly on the well-known resistance area around the $5,900. So, another criterion which will be an indication that the area is strong and the correction may start soon.
The well-known ascending channel.
Channel upper trendline has worked several times as resistance and so as now. This trendline runs through the $5,900. Yesterday, the price made a slight breakout from it but the Daily candle still got a close inside of it. So, another criterion which makes this area stronger.
All criteria together:
1. Three last years Monthly lows have worked nicely as resistance levels
2. Multiple times worked ascending channel upper trendline runs through the $5,900 which should work as a resistance.
3. ABC Equal waves counting ends around the $5,900
4. Fibonacci retracement level 62% have worked nicely as resistance, especially on the Daily timeframe.
5. A bit sloppy Fibonacci extension 161% is around the $5,900.
6. And yesterday, the Bitcoin price touched those all criteria, got a rejection and this rejection and the day ends with a bearish candlestick pattern called "Shooting Star"
Yes, pretty decent price action criteria but as they say, it is hard to catch a falling knife and currently, it is hard to catch a SpaceX . Actually, to me, there are no other options because of the strong resistance, it is just SO close to the current price. Obviously, the market is on the heavy bullish mode but the resistance, just above us, is also heavy as hell. So, actually, again, it looks like a pretty decent sell setup considering that area and considering that Daily bearish candle ( To make a bit more confirmed sell then there is a red line. After the red line break the sell is triggered and probably a bit more secure! ) but still, it is a little bit hesitating because of the current consistency. Consistency has a magic power on the crypto world and this magic power could easily drive the price above those orange lines, above the heavy resistance which should end above the $6,106!
Oh, almost forgot, there is a gray area and there is a slightly darker gray area. The darker area is a stronger area than the others around that because of the multiple rejections to either direction and because of the strong candles breakthroughs. So, currently, we have 30 min to go to another 4H candle close, if it gets a close above the darker area, then this could be a sign that bulls just do not give up but if it falls lower than the darker area then it should be more bearish, just a slight and tiny indications to add into your analysis.
Hopefully You enjoyed the post, feel free to support my idea post by hitting the "LIKE" button, it is my only fee from You!
Have a nice day,
Cheers!
*This information is not a recommendation to go "LONG" or "SHORT", it is mostly used for educational purposes only!
BITCOIN - About The Strong Resistance, Long-Term Perspective!Things have a little bit calmed down after that pump to the major mid-term target area ~$5,800, and now there is a correct time to look at the charts.
I mentioned this mid-term key area almost after the pump from the $4,000 to the $5,000 and now, after multiple attempts, the "clean" area is filled, the price has reached into the previous support levels which now became resistances. This area was a major support level on the last year, multiple rejections around the $6,000 levels. Let's dig a little bit deeper into this level, the gray area.
The Gray Area at $5,777 - $6,106
The gray area consists of multiple strong levels. There are two major price levels and if we count also that mentioned round number $6,000 then we get three.
The area which is between the orange lines: $5,777-$5,900
This area is working currently as a resistance and as a first bigger obstacle to make another move upwards. In this area we have three Monthly lows from the past year (2018):
- June low $5,777
- February low $5,873
- August low $5,900
There are also two major Fibonacci retracement levels:
- 38% retracement level: pulled from the 2018 May high to the 2018 low point.
- 62% golden ratio: pulled from the 2018 September high to the 2018 low point.
So, the first obstacle is already really strong but that's not all!
The round number , just after that orange area, $6,000
Historically, it has played a very significant role in price action. Multiple times from the last year it was on our watch list as a major support level and now, it becomes also into our watch list but as the role reversal works, it becomes on our watchlist as a resistance. So, the second important criteria in this gray area but that's not all either!
The area which is between blue lines: $6,033 - $6,106
Between those numbers, we have another three set of Monthly lows which now should act as resistance levels:
- July low $6,075
- September low $6,106
- October low $6,033
As you see, the gray area consists of 6 Monthly Lows from the last year, 2018. 6 times it has worked as a major monthly support level and if we add here also this significant round number, plus some perfect Fibonacci retracement levels then this area is a game changer.
A break above the gray area will be a really positive sign for a long-term view. Yes, the $6,500 is also a strong area, but after the breakout above the $6,106 should trigger some powerful bullish price action. There starts to come into the watchlist previous long-term lower highs which now may become cracked with new higher highs and etc. but do not rush too much ahead because currently, the area worked first time as a resistance, remember, it was the support multiple-multiple times. We have also a pretty strong RSI Divergence on the Daily chart, and this divergence is on the super-strong area and to me, looks like the correction may start soon!
Here comes the conclusion ; great, the price reached finally into the area which should play a significant role in the long-term perspective. As said, it is great but to make any mid-term BUY trades, here just under the super-strong resistance, would be a huge mistake.
Now you know, that the upwards obstacle is really strong and meanwhile the price almost needs a slight correction downwards to prepare for it to make another push through the gray area. If the correction starts then obviously, I will give to you technically good areas where you can enter into the market and I can give some mid-term or short-term strong bounce areas but considering the long-term perspective, the gray area ($5,777 - $6,106) is the key!!
"The consistency you seek is in your mind, not in the markets."
– Mark Douglas
Feel free to support my idea post by hitting the "LIKE" button, it is my only fee from You!
Have a nice week,
Cheers!
*This information is not a recommendation to buy or sell, it is used for educational purposes only!

BITCOIN - The Market Is Tired 2.0The BTC price has slowly climbed upwards to the important area/box. The bounce still came and the trendline still held up the price. Movement upwards came from the trendline after the Double Bottom chart pattern formation:
Currently, Bitcoin price has starting to fight with the strong resistance area, as I said in my previous post, then this area is technically the most important between $5,000-$5,500 - considering my bearish viewpoints and considering technical analysis. Again, let's count those short-term reversal criteria:
1. Fibonacci golden ratio - 62%
2. Historically worked support and resistance levels (orange lines in the blue box).
3. Volatility increase has been pretty significant in this area.
4. Short-term lower low and this area looks good to make short-term lower high.
5. A possible bearish chart pattern formation - Head and Shoulders:
Actually, the price has already tested the box two times and it got rejections back exactly from the lower orange line. As mentioned this volume increase then the second rejection gave us a bigger volume than the candles around of it but that is not all because the price hasn't tested the Fibonacci level, yet. Let's see, we need a little bit bigger reaction and probably a bit bigger volume should kick in just a little bit higher levels, around $5,370-$5,400, after it has touched all the criteria which are on the blue area (Fibonacci level and higher orange line).
As said in my previous post, then if the Bitcoin price starting to reach into the blue box, then wait for a bearish candlestick pattern formation. More reliable bearish candlestick patterns are: Bearish Engulfing, Evening Star, Shooting Star, Railway Tracks. You should look at those patterns on the blue area and to be even more reliable pattern then those patterns have to occur on the 4H timeframe!
Waiting for this bearish candlestick pattern formation is not said just for fun, because the price has climbed pretty steadily into the position where it can make a bigger bounce upwards, THROUGH the mentioned box. Consistency has been the keyword on the crypto world and it may become again into the play, here, in the strong resistance area. I start to make more frequent updates because the area is really important, do we see rejection or the tiny consistency guide the price through from the resistance, to the ~$5,800.
"When you genuinely accept the risks, you will be at peace with any outcome."
– Mark Douglas
Feel free to support my idea post by hitting the "LIKE" button, it is my only fee from You!
Have a nice week,
Cheers!
*This information is not a recommendation to buy or sell, it is used for educational purposes only!
Previous analysis:

BTC - Possible "Short" Opportunity!I found an area which is technically pretty strong, there could be a possible BTC short opportunity!
It is not so easy to find those because of the sideways movement between $5,000-$5,500 but I have something For You!
The area ($5,335 - $5,400) consists of:
1. The Fibonacci Golde ratio of 62%
2. Strong Bitcoin price area, just below the $5,400, it should work as a resistance.
3. The short-term counter trendline should act also as a resistance. Individually it isn't so significant but if this matching exactly with the mentioned area around the $5,400 then it will be one of the criteria.
4. EMA Death Cross on the 1H
5. Market structure new lower lows and possibly new lower high
6*. IF this is possible then wait for a bearish candlestick formation on the 4H timeframe. 4H timeframe candlestick patterns are the most reliable!
So, there are technical indicators that this level may work as a strong Bitcoin price level for short term price reversal, and there are a little bit hidden indications that this level may hold!
Feel free to support my idea post by hitting the "LIKE" button, it is my only fee from You!
Have a nice weekend,
Cheers!
*This information is not a recommendation to buy or sell, it is used for educational purposes only!

