BTCUSD ChoCh + FVG Rejection = Drop Incoming🧠 Smart Money Concepts | BTCUSD 1H Breakdown
Here’s a crystal-clear Smart Money setup on Bitcoin that screams bearish intent. The wedge was a trap, the ChoCh confirmed the flip, and now price is reaching back into a Fair Value Gap that’s likely to reject hard.
Let’s dissect the setup:
🧱 1. Structure: Rising Wedge + ChoCh
Bitcoin climbed with a grinding structure inside a rising wedge — classic liquidity trap.
Smart Money lured in longs, then snapped structure (ChoCh) at ~102,700 — that’s your reversal confirmation.
📉 2. Fair Value Gap (FVG) Rejection Zone
After the ChoCh, price retraced into a juicy FVG zone around 103,219 – 103,913 —
right below a Strong High at 105,900. Inducement bait for breakout traders.
That’s premium pricing in a bearish environment = high-probability short.
🎯 3. Liquidity Target: Weak Low + Sell Side Sweep
Price is eyeing the Weak Low at 99,114, and below that sits the real magnet:
Sell Side Liquidity at ~98,800. That’s your ultimate draw.
📐 4. Trade Idea (R:R Approx. 3.5:1)
📍 Entry Zone: 103,200–103,900 (FVG zone)
❌ SL: Above Strong High @ 106,000
✅ TP1: Weak Low at 99,114
🏁 TP2: Sell Side Liquidity @ ~98,800
🧩 Confluences Checklist:
✅ Rising Wedge Trap
✅ ChoCh Confirmed
✅ FVG in Premium Zone
✅ Bearish Order Flow
✅ Weak Low + Sell Side as Target
⚠️ Caution:
Don’t short blindly. Wait for reaction in the FVG zone — ideally a rejection wick or lower timeframe BOS.
If price closes above the Strong High — setup is invalidated.
📊 Summary:
This BTCUSD setup is dripping with manipulation. Smart Money engineered a wedge, flipped structure, and is now likely to distribute before the next leg down.
Stay sharp. Trade with the big players, not against them.
💬 Type “🚨 BTC Short Alert” in the comments if you caught this setup too.
📉 Follow @ChartNinjas88 for more SMC alpha and sniper setups.
👀 Tag a fellow trader who thinks wedges always break upward 😂
Btcshort

BTC Short Setup – High Leverage Precision Trade (30x)Description:
Shorting BTC with a tight strategy and calculated risk:
Entry: $105,200
Leverage: 30x
Margin: $400
🎯 Targets:
TP1: $104,600 → Book 25%
TP2: $102,800 → Book 50%
TP3: $10,000 → Close Remaining
⚠️ High-risk, high-reward play. Use proper risk management.

BTC SHORT TP:101,500 10-05-2025🚨 Short setup locked in!
We’re going for 101,500 on the 4H chart, with an expected move in the next 20 to 30 hours.
This comes after a clear fake breakout — and now the risk-reward is looking 🔥
The setup is clean, the timing is right.
You manage your stop the way it fits your strategy — I just bring the move.
Follow for updates and let’s execute with precision.
#BTC #ShortSetup #TradeClean

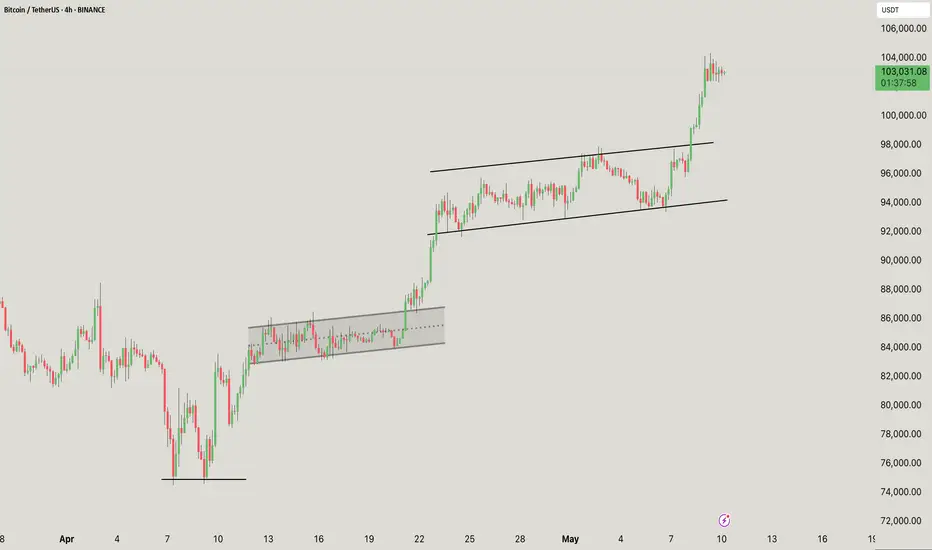
BTC/USDT Analysis – 4H Chart
This chart shows classic bullish continuation through ascending channels and consolidation breakouts:
A solid double-bottom structure was formed in early April
Marked the start of the uptrend
First consolidation box (~$90K–$93K)
Horizontal accumulation (highlighted gray box)
Resulted in a clean breakout and continuation
Rising channel (~$94K–$99K)
Rising Mid-trend consolidation wedge/channel
Price respected both trendlines
Eventually broke out to the upside → Strong momentum candle followed
Current Status (~$103K)
Price has broken above the rising channel
Now forming a new mini flag or consolidation at the top
Momentum is still in favor of the bulls
If you found this analysis helpful, hit the Like button and share your thoughts or questions in the comments below. Your feedback matters!
Thanks for your support!
DYOR. NFA
BTCUSD Possible Move May 6th 2025🔻 BTC/USD – SHORT SIGNAL & ANALYSIS
📉 Signal:
Sell BTC/USD below 94,000 after a confirmed break and retest of the ascending trendline.
Target: 93,000 liquidity zone
Stop Loss: Above 94,400 (or structure high after retest)
Risk/Reward: Approx. 1:2+
📊 Analysis:
Price has been in a descending channel, followed by a corrective structure forming higher lows.
Currently testing a rising trendline, suggesting weakening bullish momentum.
Clean liquidity pool rests around 93,000, likely to be targeted if structure breaks.
Expected flow:
Break below 94,000 trendline
Retest the trendline as resistance
Continuation to 93,000 demand/imbalance area
🧠 Trade Idea Summary:
This setup aligns with bearish market structure and liquidity concepts. A breakdown from the trendline would confirm bearish intent, with 93,000 as the next logical draw on price.

BTC/USDT – Weekly Chart Analysis (Long-Term View)BTC/USDT Chart Pattern: Multi-Year Cup and Handle Formation
The chart shows a textbook “cup and handle” formation, a highly reliable bullish continuation pattern. This pattern has played out over several years (2021-2025), indicating long-term accumulation and a breakout attempt.
Cup Phase:
Extended from mid-2021 to early 2024.
Formed a deep and rounded base, often indicating institutional accumulation.
The rounded lows reflect a gradual sentiment recovery from the 2022-2023 bear market.
Handle Phase:
A short-term consolidation after moving above the $70,000-$74,000 resistance area.
Price action pulled back marginally after hitting $110,000, forming higher lows near $85,000.
The structure resembles a bull flag or pennant, which is usually seen before the next upward move.
Key Support and Resistance Areas:
Key Support $70,000–$74,000. Previous resistance turned into support
Psychological Support $85,000 Local Retracement Low
Immediate Resistance $100,000–$110,000 Near ATH, selling pressure area
Long-term Target $130,000+ Measured move from cup pattern
Volume: Volume was high during the breakout from late 2024 to early 2025, which validates the breakout from the cup resistance area.
If BTC breaks above $100,000–$110,000 with strong volumes, we can expect continuation towards:
$130,000 (short-term target)
$150,000–$180,000 (extension based on pattern symmetry)
Bearish Risks:
Failure to hold $85,000 could lead to a retest of the $70K support area.
Sustained breakdown below $70K would invalidate the bullish pattern, but this seems unlikely given the strong fundamentals and macro structure.
If you found this analysis helpful, hit the Like button and share your thoughts or questions in the comments below. Your feedback matters!
Thanks for your support!
DYOR. NFA

BTCUSDT - Black Monday ? What's next??#BTCUSDT.. market perfect holds our resistance area as we discussed in our perveious idea regarding #btc
now market is going to close below our supporting area.
Keep close guys because eif market hold his current high then a drop expected below that.
Good luck
Trade wisely

“BTC 4H Chart: Eye on $91,247 Support After Local Resistance”The BTCUSDT 4H chart shows a strong uptrend, but price is now facing resistance. If the trendline breaks, the $91,000 support zone becomes a key level to watch. Is this just a pullback or the start of a bigger correction?
🔍 Key Levels:
Resistance: $97,000
Support Zones: $95,000 & $91,000
Trendline Decision: Watch the 4H candle close for confirmation.
🧠 Strategy:
Wait for a pullback or go long on a confirmed bounce — both setups are possible. Follow price action closely and trade smart.

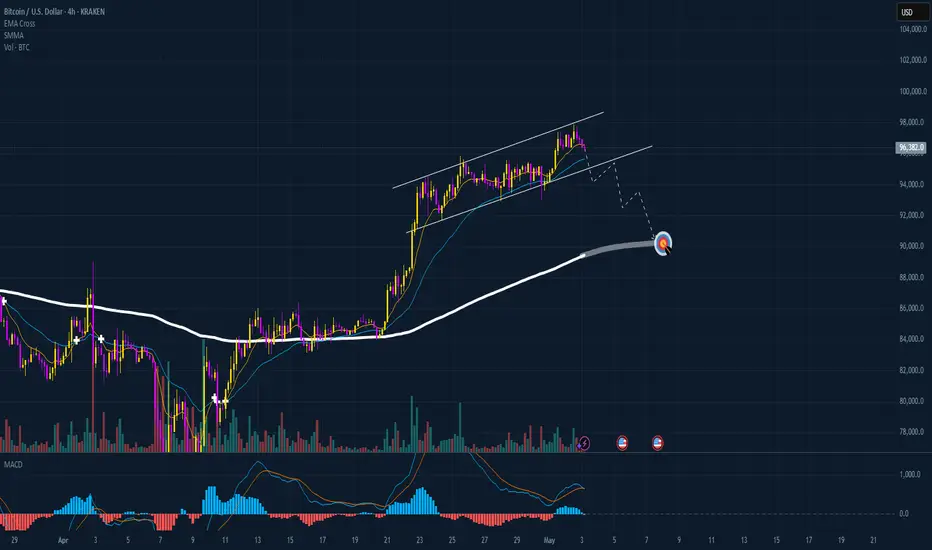
BTC HAVE A HIGH PROBABILITY TO FALL DOWN!!!The BTC starts looking weak and it's perfect time to long for a short. We are almost at the top of this run from last weeks and we can see that BTC made a perfect divergence pattern. My indicator shows me also that we are entering a mid-term bearish trend and there is a high chance that we are gonna fall much deeper than in last weeks. My target is clear and I'm holding my strategy so I wait for the price to hit my SMA line like it was in the last days but now I wait for the price to hit the SMA line at 4H chart because we didn't hit it since 2 weeks so in this moment we can see even in a few candles that the price is gonna touch it. I am actually in the short and waiting for the price to go for my target, we also have a weekend so the price will be probably slow but everything can happen. In my opinion next week are gonna be red and the price should touch my target. I recommend to watch a 1H and 2H chart and looking when price will hit the SMA line on these timeframes because my target is set in a 4H chart but we can book profits even when the price will hit the SMA at 1H and at 2H chart. Be careful and stay focused.
BTC/USDT Technical Analysis. Current Price: ~$94,600
BTC has cleanly broken above the descending trendline resistance, a structure that capped price since mid-February.
This breakout was accompanied by a surge in volume and momentum — a strong bullish sign.
Golden Cross Area
A key technical confluence occurred where the 50-day MA (red) and the 200-day MA (green) were tested simultaneously, marked by the blue circle.
Price moved sharply upward after reclaiming both MAs, suggesting increased buying confidence — a textbook golden cross behavior, even if not a perfect cross yet.
Support & Resistance Flip
Previous resistance at the GETTEX:92K —$93K zone (highlighted in yellow) has now become support.
As long as BTC holds this zone, it suggests healthy consolidation and potential for a continued move up.
Trend Indicators:
50-Day MA (Red): Now curving upward — short-term bullish momentum is building.
200-Day MA (Green): Flattening and starting to rise, showing early signs of a shift in long-term trend direction.
The price is currently above both MAs, which is a key bullish condition.
Key Levels to Watch:
Immediate Resistance: $96,000–$97,500
Major Psychological Barrier: $100,000
Support Zone: $91,500–$92,500
Stronger Support (if broken): $84,000–$85,000 near the MAs
If the price continues to hold above the breakout zone and consolidates well, the next upside target will be $ 100 K.
Failing to hold the GETTEX:92K zone could invite a pullback toward the MAs around $85K — a zone where bulls may step in again.
Final Thoughts:
BTC is showing signs of renewed bullish momentum after breaking key resistance and reclaiming critical MAs. However, confirmation through consolidation and volume is essential to sustain higher levels.
Structure remains bullish unless we see a breakdown below ~$85K with volume.
DYOR. NFA. Stay sharp.

BTC Setup: Scalp Shorts Active Below 97.5K BTC is currently facing strong resistance around the 97.5K area on the daily timeframe.
As long as BTC stays below 97.5K on a daily closing basis, I am expecting a potential pullback move.
📉 There is a chance of a wick or sharp move down toward the 92K zone, which could provide good scalp short opportunities.
📈 However, a clear breakout and daily close above 97.5K would invalidate this short idea and shift the bias back to bullish continuation.
Trade Plan:
🔻 Below 97.5K = Look for scalp shorts with strict risk management.
🔼 Above 97.5K = Exit shorts and watch for bullish setups.
Always remember: Protect your capital and stick to your plan! 🎯
⚠️ Disclaimer:
This is not financial advice. This post is for educational purposes only. Always do your own research and manage your own risk before entering any trade.

BTC SHORT TP:82,300 17-04-2025🚨 Time to go Short! The targets are set between 82,000 and 82,500, with the 4-hour and 8-hour timeframes indicating a bearish trend.
We anticipate this downward movement to unfold within the next 2 days. It’s crucial to enter at the right moment and consider averaging down to maximize your potential gains.
Keep an eye on market updates to adjust your strategy accordingly. Following me will ensure you stay informed about any changes and the latest insights. Let’s navigate this market together and aim for those profits! 📉💰

BTC | FAKE REVERSAL - Here's WhyI'm not convinced of the recent "bullish" price action. In fact, I say it's likely the calm before the next bearish move down.
In a downtrend, there are a few tale tell signs that the price has gone into full bear mode . In this video, I discuss two of them.
Make sure you catch up on ALTCOINS, and their ideal buying zones HERE 👀👇
__________________
BINANCE:BTCUSDT

Bitcoin is currently trading around 85,269.35 USDT. Bitcoin is currently trading around 85,269.35 USDT.
Support Zone: A crucial support zone marked in green suggests strong buying interest between 80,000 and 81,000 USDT.
Resistance: The upper trend line indicates resistance; if Bitcoin can break it, it could target levels close to 88,000 USDT.
Bullish Case: A breakout above the upper trend line could lead to an upward rally towards 88,000 USDT or above.
Bearish Case: If the price breaks below the support zone, a downward move towards 75,000 USDT can be expected.
Monitor the trade closely to see how it reacts around these crucial levels. Adjust your strategy accordingly based on the price action. If you have further questions or need analysis on specific indicators, feel free to ask!
If you found this analysis helpful, hit the Like button and share your thoughts or questions in the comments below. Your feedback matters!
Thanks for your support!
DYOR. NFA

continue sideways, BTC accumulates below 88K💎 BTC PLAN UPDATE (April 18)
The recovery of the D frame shows the optimistic sentiment of the market, believing that in the second quarter of 2025 the market will heat up again. The FED lowers interest rates, the group raises tariffs.
NOTABLE NEWS ABOUT BTC:
Recent trends suggest that Bitcoin ETF sell-offs during price surges often foreshadow significant market pullbacks. Notably, substantial outflows were recorded from BlackRock’s IBIT and Ark Invest’s ARKB ETFs, each losing over $113 million in assets.
Should the sell-off by seasoned U.S. institutional investors persist into Thursday, cautious sentiment may spread to strategic retail and mid-tier traders, deterring them from initiating large bullish positions. This risk-averse stance could help explain Bitcoin’s current stagnation near $84,600, even as top-performing altcoins like Solana outpace it with stronger gains over the past 24 hours.
TECHNICAL VIEW
BTC price needs to surpass 92-93K to enter the next big growth period. However, political instability and tariffs are holding back BTC's breakout. Price will continue to sideway and accumulate around 82-86K
Short time frame, sideway around 84k, slow liquidity.
==> Comments are for reference only. Wish investors successful trading

Based on the BTC/USDT 4-hour chart:Current Price Levels: Bitcoin is currently trading around 85,269.35 USDT.
Support and Resistance:
Support Zones: A crucial support zone marked in green suggests strong buying interest between 80,000 and 81,000 USDT.
Resistance: The upper trend line indicates resistance; if Bitcoin can break it, it could target levels close to 88,000 USDT.
Bullish Case: A breakout above the upper trend line could lead to an upward rally towards 88,000 USDT or above.
Bearish Case: If the price breaks below the support zone, a downward move toward 75,000 USDT can be expected.
Monitor the trade closely to see how it reacts around these crucial levels. Based on the price action, adjust your strategy accordingly. Feel free to ask if you have further questions or need analysis on specific indicators!
If you found this analysis helpful, hit the Like button and share your thoughts or questions in the comments below. Your feedback matters!
Thanks for your support!
DYOR. NFA

BTC/USDT 1DAY CHART UPDATE !!50-day moving average (red line):
This is a short-term trend indicator. It reacts more quickly to price changes and is often used to identify short-term trends.
When the price is above this moving average, it usually indicates bullish momentum; when it is below, it may signal bearish momentum.
200-day moving average (green line):
This is a long-term trend indicator. It provides a smooth moving average that helps identify the overall trend over a long period.
A price above this line indicates a long-term bullish trend, while a price below it indicates a potentially bearish market.
Current Analysis
Price Action: As of the current date, the price is hovering around the 80,000 USDT, just below the 50-day MA, which may indicate a potential resistance area.
Convergence of MAs: The behavior of both the 50-day and 200-day MAs can provide insight:
If the 50-day MA crosses above the 200-day MA (a “golden cross”), this typically indicates a bullish signal.
Conversely, if it crosses below (a “death cross”), this can indicate a bearish sentiment.
Support and Resistance: The chart also shows areas of support (horizontal green lines) around 76,000 to 80,000 USDT. If the price breaks this resistance, it may have room to move towards the next levels indicated.
If you found this analysis helpful, hit the Like button and share your thoughts or questions in the comments below. Your feedback matters!
Thanks for your support!
DYOR. NFA

BTC/USDT 4H Chart Analysis !!Current Price: $83,809
The chart shows a symmetrical triangle pattern, indicating a possible breakout soon.
Upper Resistance: Around $86,000
Lower Support: Around $82,000
Key Support Levels: $79,183 and $78,424
Bullish Breakout (Green Arrow)
If BTC breaks above the resistance trendline (~$86K), it could see a strong move towards $90K-$92K.
Confirmation would be a candle close above $86K with volume.
Bearish Breakdown (Red Arrow)
If BTC loses the support trendline (~ GETTEX:82K ), it could drop towards $79K-$78K.
The candle closing below GETTEX:82K could fuel further selling.
Market Sentiment:
Fear & Greed Index: 28 (Fear) – Investors remain cautious.
The direction of the breakout will depend on market sentiment and volume.
If you found this analysis helpful, hit the Like button and share your thoughts or questions in the comments below. Your feedback matters!
Thanks for your support!
DYOR. NFA

Bitcoin (BTC) on 4-hour timeframe. Current Price: Bitcoin is currently trading around $81,830.
Trend Line: There is a downward trend line indicating bearish sentiment over the observed period.
Support Level: There is a green support area around $78,424 to $80,000. Bitcoin needs to stay above this level to avoid further declines.
Recent Activity: After the decline, Bitcoin has attempted to stabilize near the support but has not made any significant upward move.
Considerations
If the price breaks below the support area, the bearish trend may continue.
Conversely, if Bitcoin breaks above the trend line, it may signal a reversal and potential upward movement.
Feel free to ask for further analysis or specific technical indicators!
If you found this analysis helpful, hit the Like button and share your thoughts or questions in the comments below. Your feedback matters!
Thanks for your support!
DYOR. NFA

BTC/USDT 4H Chart Analysis 🚀 BTC/USDT 4H Chart Analysis 🏆
🔍 Market Overview:
Bitcoin (BTC/USDT) is currently testing a key support zone. A confirmed breakdown could open the doors for a bearish move, while a bounce could lead to a recovery attempt.
📌 Key Observations:
🔶 Important Resistance (🟠 82,743.59 USDT)
🚧 This level has acted as a strong resistance zone. A breakout above this could trigger bullish momentum.
🔵 Crucial Support (81,633.22 USDT)
🛡️ Holding above this level is important for buyers to prevent further downside.
❌ If BTC confirms a close below this support, it could signal a continuation of the downtrend.
📊 Moving Averages (7, 25, 99 SMA):
🟡 Short-Term SMA (7): Price is testing this moving average.
🔵 Medium-Term SMA (25): Turning into potential resistance.
🟢 Long-Term SMA (99): Still bullish but flattening out.
⚡ Trade Triggers:
✅ Long Trigger (📈💰) - If BTC breaks above 82,743.59 USDT with volume → 🚀 Buy opportunity!
❌ Short Trigger (📉🔻) - If BTC closes below 81,633.22 USDT, it confirms a bearish breakdown → 🏴☠️ Short setup active!
📢 Trading Strategy:
💎 Bullish Plan: Wait for a breakout above 82,743.59 USDT with strong volume → 🎯 Target: 83,500+ USDT.
⚠️ Bearish Plan: If BTC breaks below 81,633.22 USDT, expect a drop towards 79,986.83 USDT, with a final target at 78,445.12 USDT.
🔥 Final Thoughts:
Bitcoin is at a decision point! 🎯 A breakout could push BTC higher, while a breakdown signals deeper corrections.
📢 Watch volume for confirmation before taking a position! 🚀
🔔 Stay Alert & Manage Risk! 🎯

BTC/USDT 1DAY CHART UPDATE !!A downward trend line indicates resistance; the price is struggling to move above this line.
The green line at around 78,000 to 79,000 USDT is a crucial support level, providing a base for the price movement.
Recent fluctuations: The price shows a recent bounce, indicating a potential bullish reversal if it breaks the trend line.
Future forecast: The upward arrow indicates a bullish outlook; if the upward movement continues, then targets around 102,500 to 110,000 USDT can possibly be set.
If you have specific questions or need further analysis on certain aspects, feel free to ask!
If you found this analysis helpful, hit the Like button and share your thoughts or questions in the comments below. Your feedback matters!
Thanks for your support!
DYOR. NFA

BTC, ALL Goes down!!The pattern says till 82,111 it can come! the pattern says, happened in 2022 may 5th or 6th, enjoy!

BTC/USDT 15-Minute Chart Analysis🚀 BTC/USDT 15-Minute Chart Analysis 🏆
🔍 Market Overview:
The chart shows Bitcoin (BTC/USDT) price action on a 15-minute timeframe with key resistance & support levels, along with potential trade triggers.
📌 Key Observations:
📈 Strong Resistance (🚧 85,339.85 USDT)
🔥 Major hurdle for buyers! A breakout above this could ignite a rally.
🚀 If BTC closes above this level with volume, we might see a strong uptrend.
🛑 Important Support (🔵 84,727.22 - 84,912.40 USDT)
🛡️ Holding this zone is crucial for bulls to maintain momentum.
❌ Losing this support could trigger a bearish move.
📊 Moving Averages (7, 25, 99 SMA):
🟡 Short-Term SMA (7): Price is testing this moving average.
🔵 Medium-Term SMA (25): Acting as dynamic support.
🟢 Long-Term SMA (99): Still bullish, showing an uptrend bias.
⚡ Trade Triggers:
✅ Long Trigger (📈💰) - If BTC breaks 85,339.85 USDT with volume → 🚀 BUY Opportunity!
❌ Short Trigger (📉🔻) - If BTC drops below 84,727.22 USDT → 🏴☠️ Short setup possible!
📢 Trading Strategy:
💎 Bullish Plan: Watch for a breakout above 85,339.85 USDT with strong volume → 🎯 Targets: 85,500+ USDT.
⚠️ Bearish Plan: If BTC breaks below 84,727.22 USDT, look for a drop to 84,498.52 USDT or lower.
🔥 Final Thoughts:
Bitcoin is in a critical decision zone! 🎯 Breakout = Bullish Rally! ❌ Breakdown = Bearish Move!
📢 Stay Alert! Volume Confirmation is Key! 🎯
