BTC/USDTHead And Shoulders Chart Pattern
The Head and Shoulders pattern is very easy to spot and can be a caution for traders especially when the pattern occurs at the top end of a rally or its bearish counterpart, the inverse head, and shoulders that occurs at the trough of a downtrend.
In the chart above, you can see the basic structure and the setup of the head and shoulders pattern (bullish and bearish). The neckline support (or resistance) is the key as a breakout from this level indicates a shift in the trend.
The most basic way to trade the head and shoulders pattern is to wait for the breakout from the neckline. Some traders prefer to wait for a retest back to the neckline while others simply buy or sell on the breakout. The target is set to a measured move, measured from the head (high or low) to the neckline (support or resistance) and projected from there on.
Btcshort

BTCBTC is trading in a range of 22400-23200 after giving a strong upside move. Range bound is a good sign as it allows oscillators to cool down on the lower timeframe and make a bigger move next time. Breaking above the range with volume and sustaining above it will take it to 24900 target. Breaking below will call for a retest of 21600.

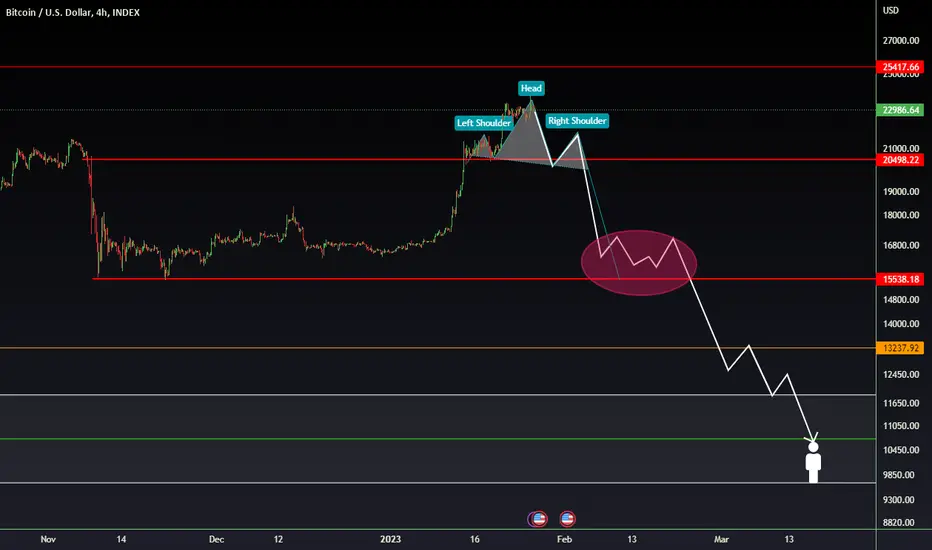
💥 BTCUSD 4H-TIMEFRAME ANALYSIS💥 BTCUSD 4H-TIMEFRAME ANALYSIS
💗Hello ladies and gentlemen
This is my new idea for 💥BTCUSDT BTCBUSD
I hope my idea is clear
Support me by like and share thank you
Stay Safe💯💲💲💲
Good luck💰😍
ETH Swing ShortIm going for a high leverage ETH swing short, If you see what I'm seeing (HNS) you would understand what I'm saying!
100x Leverage
SL 16.14.82
ENTRY 1606.25
TP 1457.97

BITCOIN/USD 1DAY UPDATE BY CRYPTO SANDERS !! Hello, welcome to this BITCOIN /USD update by CRYPTO SANDERS.
CHART ANALYSIS:-Bitcoin ( BTC ) moved to a fresh five-month high earlier in the session, as markets reacted to Tesla’s latest quarterly earnings report.
The report, which was released after yesterday’s closing bell, showed that the electric vehicle maker did not sell any of its bitcoin.
Following the news, BTC/USD raced to a high of $23,722.10, hitting its strongest point since August 17 in the process.
Looking at the chart, the move saw BTC once again break out of a ceiling at $23,500, and this comes after colliding with a floor at $22,500.
Earlier gains have somewhat eased, with the 14-day relative strength index (RSI) back in overbought territory.
As of writing, the index is tracking at 80.77, with a support point at 78.00 the next visible target.
I have tried to bring the best possible outcome to this chart.
Hit the like button if you like it and share your charts in the comments section.
Thank you

BTC/USDT 3DAY UPDATE BY CRYPTO SANDERS !!Hello, welcome to this BITCOIN /USDT update by CRYPTO SANDERS.
CHART ANALYSIS:-BTC broke the $23.5K resistance in the recent move but could not close a candle above it. The previous lower higher horizontal resistance is near $25K.
BTC is retesting the descending channel and Ichimoku cloud. A successful retest or a candle above the marked horizontal resistance would confirm the move toward $30K. This will also confirm the continuation of the market boom.
I have tried to bring the best possible outcome to this chart.
Hit the like button if you like it and share your charts in the comments section.
Thank you

BTC TO 24K Today ? Here's a possibility in my eyes that could happen today!
BTC is in an upward wedge coming up to a very important zone. THE 24k Zone. BTC must hold the current support LVL of 22990-23100 IF it wants to continue to the upside.
If we hold this area we could see BTC go up and test the 23985- 24304 LVL
ON THE FLIP SIDE
If we lose this current LVL of support we will most likely go back down and test the 21100-21500 LVLS

BTC 4 HOUR CHART SHORT Here is My Opinion on a short scenario for BTC On the 4-Hour CHart.
BTC Is having a really tough time breaking the 23000 $ LVL ANd COULD Potentially Go Back down to restest some lower LVLS
These might be the 22360 , 21500 , EVEN the 20200 - 19102$ LVLS .
Good Luck out there folks :)
LOVE LOVE

BTC at the edge of SURPRISEthere's simultaneously two different situations in way:
1- a strong resistance (red line) that might lead to a big drop
2- a very unstable area with no previous trading volume that might lead to a spike
it's too risky to open short positions with no stop loss or with high margin


BULLRUN WITH BTC?Hello!
Bullshort is here!
After a strong rally, sellers put strong pressure on the 22-23k level and held the price. Buyers failed to pass asks limits and the price went into lateral consolidation. The zones are all shown, I think there is no need to explain their meaning.
It is important to note that the open interest of short positions is very low, which may be a reason for a correction to 21-19.5k.
Market capitalization is kept at the level of +-1 trillion. and the market is waiting for something. I am waiting for a correction from the level of 24500-25000, this would be a healthy price adjustment. I do not rule out a fall from the current zones, because. pressure is observed on the 1h graph.
It is also important to note that during the growth, a lot of btc was poured into altcoins…
SUBSCRIBE TO THE CHANNEL!

BITCOIN DOMINANCE UPDATE BY CRYPTO.SANDERS !!Hello, welcome to this BITCOIN dominance update by CRYPTO SANDERS.
CHART ANALYSIS:-BTC DOMINANCE A small update on BTC dominance that is pumping up BTC. usdt.d similarly dumping btc dominance which is forcing btc peers to dump older coins btc has created support by breaking the local resistance zone next target of btc dominance may go from 47% to 49% this strong resistance level btc is from here dominance job will be rejected in bottom trade so btc altcoin is going to give very good rally so we will do some update by entering btc pair coin and spot it. thanks for reading my update
I have tried to bring the best possible outcome to this chart.
Hit the like button if you like it and share your charts in the comments section.
Thank you

BTC/USDT 12Hr UPDATE BY CRYPTO SANDERS !!Hello, welcome to this BITCOIN /USDT update by CRYPTO SANDERS.
CHART ANALYSIS:-BTC is retesting over the descending channel. The current short-term resistance level is $23.5K.
The bulls need to clear the $23.5K resistance for the continuation of the bullish momentum in the market.
In case of a failed retest of the descending channel, $19K is a strong support level for bulls to make a higher low over that level.
I have tried to bring the best possible outcome to this chart.
Hit the like button if you like it and share your charts in the comments section.
Thank you

BTCUSDT Pumped - Time to look for reversal patternsAs the euphoria of a potential bull run coming in, we must continue to look out for any potential reversal patterns and play both sides of the coin - either Long or Short.
With the recent pump from the lower trendline, we can see that an ascending wedge has formed with the Higher Highs (HH) and Higher Lows (HL) plotted on the chart. Both resistance and support trendlines are well respected.
We are now currently touching the upper trendline and we expect through the weekend some volatility before touching the bottom trendline again.
Breakout of the ascending wedge towards the bottom will definitely spark fear to the market and we will likely head to a newer low. A catalyst will be needed for this which is expected in the coming days/week.
Note: This isnt a trade setup but more of a pattern sharing.

BTCUSDT LongBINANCE:BTCUSDT
I invest a lot of money in Bitcoin and I look forward to a good future in technical analysis, but in fundamental analysis I do not know much. Tell me what is your view of this year

BITCOIN/USD 1DAY UPDATE BY CRYPTO SANDERS !!Hello, welcome to this BITCOIN /USD update by CRYPTO SANDERS.
CHART ANALYSIS:-Bitcoin ( BTC ) consolidated for a third straight day, as traders continued to secure gains from Saturday when prices rose to a five-month high.
Despite consolidating, BTC/USD remained above $23,000 for most of today’s session, hitting a high of $23,134.01 in the process.
This comes less than 24 hours after it was trading at a low of $22,654.30, which is near short-term support at $22,500.
Looking at the chart, BTC is currently trading at $22,913.54, and this comes as the 14-day relative strength index (RSI) neared a ceiling of 86.00.
At the time of writing, the index is tracking at a level of 85.09, with a floor of 80.00 another possible destination for traders.
The 10-day (red) moving average has also begun to show signs of peaking, which could lead to a sudden shift in momentum.
I have tried to bring the best possible outcome to this chart.
Hit the like button if you like it and share your charts in the comments section.
Thank you
