Bitcoin: Sidestepping the Sell Signal?While Bitcoin is still within the range of a supportive inflection point (10,500 AREA), it is on the verge of generating a new SELL signal. Our swing trade strategy strictly prohibits shorts, so we have no intention of participating, but I will mention it since that is what the chart is presenting.
Things to look out for though: The broader trend has NOT changed. Which means bearish fake outs are very likely (double bottom, failed low). If taking a trade on the short side, it is a good idea to use more conservative targets in such an environment. Anyone that is hyping over exaggerated levels like 6K are seeking attention.
In order for our broader technical outlook to change from bullish to neutral, the low 9K area needs to be cleared. ANYTHING can happen so it is possible, but the probability of such an event at this point is still low.
The momentum from the recent bearish move can still follow through, but what we are anticipating is a broad consolidation with the range lows established somewhere in the mid to low 9Ks. Those are now the areas we are looking at for new potential swing trades long. This type of chart formation can take weeks to unfold.
It is important to keep in mind, NO ONE knows anything for sure in this game (unless you have inside information). And a chart CAN'T provide any type of precision timing. Charts can imply clues and we measure RISK from those clues. When new information presents itself (like the 11K support break) the BEST we can do is ADJUST our outlook and probabilities based on what that information implies. What produces performance over time is GOOD RISK MANAGEMENT. Simply put: you need to lose less than what you win, otherwise you cannot win over time, no matter how high your win rate is.
Btcshortsetup


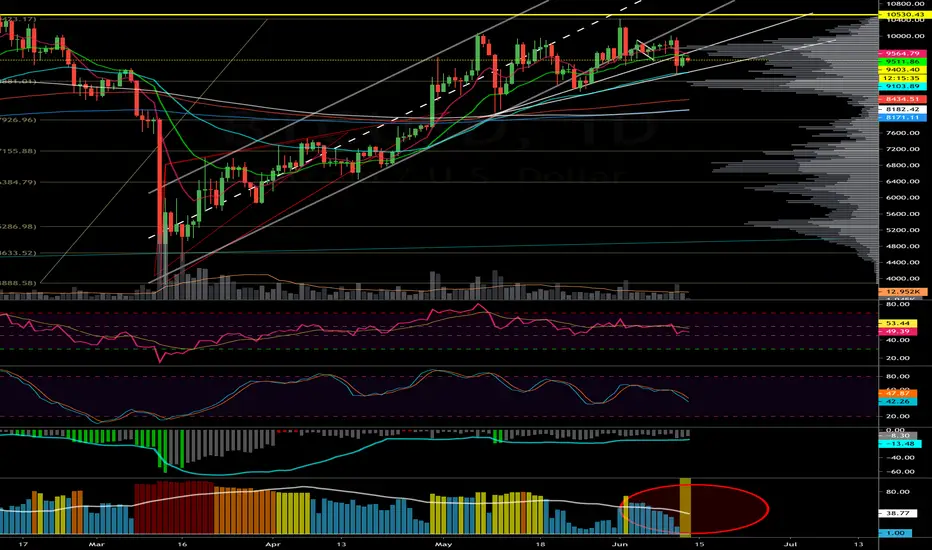
Invalidation CityBreaking lower with a serious bear Div. on RSI and Volatility has dropped off to almost 0. Big Move Incoming!!
Big Bitcoin Sell off before halvingTarget area 1 9100-9000
Target area 2 if more buyers 9300-9000
Take profit 5-8% Short below

BITCOIN ($BTC): Hedge Short on this Potential BTC Bart✨ We provide charts every day ✨
Like and Follow to help us grow family! 🎉
---
Longer term trends on Bitcoin (BTCUSD) point to more upside, but in the short term it looks like we could be gearing up a bearish "Bart." We currently are waiting for a short signal to confirm a short entry as a scalp short hedge play against the overall bullish trend.
---
1. Fractal Trend is showing a downtrend (Red background color) for BTCUSD on the 30 minute chart.
2. Breakaway Scalper is currently neutral (Grey bar color), so we have no trade yet.
3. With this strategy we enter short ONLY when Fractal Trend shows a Red background and Breakaway Scalper shows a Red bar color. We enter long on opposite conditions (Green on Green) and otherwise are not in a position.
4. We are currently looking for a short signal from Breakaway Scalper. As noted above, the idea being that while the overall trend is bullish, a short term downtrend could be forming we want to capitalize on that.
5. Although there are a few potential support levels on the chart, we are mostly eyeing a breakdown below S1 with a target of the S3 cluster to cover our shorts... although we will look for reactions at S2 in case the move down is rejected.
6. To the upside we will look for reactions at the R1 short term swing highs and R2 range swing highs.
7. To ensure we try to reduce potential drawdown, we are using Breakaway Scalper's built in static stop loss if we open the short.


Elliot Formation Inside An Ascending Wedge The BTC price has increased significantly since reaching a low on March 13. The increase has taken the form of an ascending wedge, which is considered a bearish reversal pattern.
It is possible that the price continues to trade inside this wedge until it reaches the next resistance level at $7750. If so, we can outline a five wave Elliott formation that would take the price all the way to this resistance line. The price is currently at the top of the third wave, after which a decrease towards the support line is expected. Afterwards, the price is likely to create the final upward move before breaking down. This possibility is supported by the slight bearish divergence that has been developing in the RSI, which is even more visible in short-term time-frames.
If the price breaks down, the closest support areas are found at $6700 and $5800.


THIS IS WHERE I SHORT THE PONZIIf i go by the previous few times, BTC shouldn't survive over this range.

BTC.DCleaned up the BTC.D chart, as I feel now that bitcoin dominance is in a consolidation phase along side BTC price action. The D1 BTC.D chart has a falling wedge that is right below the 200 ema.
I am almost 99% certain it will break up leading to another pump in dom & price of bitcoin.
68% will most likely take a few attempts B4 finally failing as BTC breaks up along with dom & heading towards the 200 ema weekly chart.
There is some room for downside here to $5,500 level but thats really all I see and will probably be a great buy for a TP of $9600 next major area of resistance.

$btc short unless we get some good newsrising wedges usually break down, for now least target is ....2500-3000

I'm sorry bitcoin I thought u where the one.....I will not be entering this short blind. will be waiting to see an hourly rejection of 6k before jumping in,.
I'ts very important to see whats going to happen at 6k, that's the liquidity pool to shake off shorters and early bulls, a fib level, and a big round number. That's a good amount of confluence. Painful to short something I love so much...im sorry bitcoin please don't hate me...maybe later when the economy stops collapsing we can get back together

Bitcoin at CRITICAL resistance level!We are now at a major resistance for BTC. This is the level which held for months while BTC ran up from 14k and began its drop in June. This is a very important level to break. If we are unable to break it then I believe we have completed this EW count and will start another ABC down to 8500-8600 (estimate).

BTC SHORT TRADEGive a like, if you want to get notification, when i post an update on trade
* RSI confirmed breakout of important trend line from beginning of pump
* on last leg up volume was lower
* BTC forming descending triangle
* momentum is good
Target 1: 8820 close 20%
Target 2: 8680 close 20%
Target 3: 8580 close 20%
Target 4: 8460 close 20%
Contact me for my discord, where I share more calls

BTC/USD SHORT SET UP TO $7,000/ AT $7,000 GO LONG TO $10,480Sell BTC/USD
Entry 1 8680
Entry 2 8568
Sl 8900
Tp.1 8,180
Tp.2 7,775
Tp.3 7,520
Tp.4 7,186
BTC/USD’s ability to remain above the 7473.42 area will be closely scrutinised by traders intent on assessing the sustainability of the recent move, as this area represents the 23.6% retracement of the 10540.49 – 6526.00 range. Likewise, a move back above the 8059.54 area will be seen as a bullish development as this represents the 38.2% retracement of the same range. Below current price activity, traders anticipate Bids around the 7597, 7473, 7313, and 7117 areas. Above current price activity, traders anticipate Offers around the 8177, 8340, 8585, and 8799 areas.
ONCE SHORT ends
BUY limit set up
entry 1 $7,080
entry 2 $ 6,680
sl 6300
Tp.1 7,600
Tp.2 8,100
Tp.3 8,600
Tp.4 9,600
Tp.5 10,240

BTC getting weak, downside to 5300-6000 based on candlesticksBTC has been on a solid downtrend over the past 6 months, ever since the top out just shy of the $14,000 level BTC has been creating lower highs and lower lows and looks to continue based on the technical analysis.
In order for BTC to break the downside trend it has to break above the previous impulse start of the downtrend and hold it as support, which means breaking above 8000 and holding the 7500-7600 level as support. This is not the case.
So far the cryptocurrency printed a double top at the 7500 area and a recent lower high with extended bear candle wicks holding some downside pressure. From here we have to see a break below 7000 into the end of this week on strong volume. The ultimate level to break is 6700 in order for price to create a lower low.
Disclaimer: This idea is for educational purposes only, this does not constitute trading or investment advice. TRADEPRO Academy is not responsible for any market activity.


BTC PRICE VOLUME ANALYSIS BY MR.WIZARDThis chart looks bearish, because it sure doesnt look bullish. There is very little bullish volume on the bounce with the lower support, there is very strong volume right after the bounce which is always a sign of a upcoming breakout, then we have some lower highs followed by lower lows, but it is respecting a Resistance coming from the previouse bounce, a lower time frame channel, we see very recently a very big upper tweezer with wick with strong volume indicating bearish, this is going to keep falling.
- MRWIZARD -


possible short entry in bitcoinif BTC/USD closes under $7187 we could possibly see a 17% drop to $6134
Sorry HODLRS

Is bitcoin ready for another drop?Btc is in another bearish rising wedge and also at resistance of bigger bullish falling wedge, which i doubt it will break, so im getting into another short

BTC is NOT in a bullish flagWe are no longer in a bullish flag. Since the last post it has changed.
This structure is showing these 2 road maps.
If that impulse broke ABOVE 10,000 with a close on daily... then YES it would be a bullish flag...but it didn't!
Wait for price to get to spike. then begin looking for your "patterns."
You're welcome.
Marked it with the eyes.
