$BTC Daily UpdateCRYPTOCAP:BTC #BTC moving in tight range $44,174-$43,522, bearish engulfing forming on 4h currently, $43,145 support could test. RSI on 1D and 4H looking good, 3rd weekly close approaching with $43,868 resistance. Watch given S/R
Btcsignals

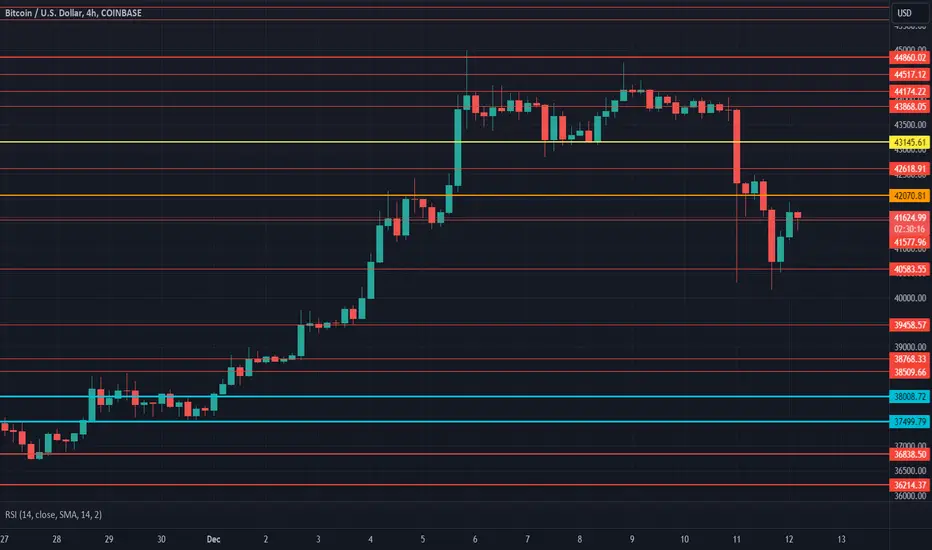
$BTC Daily UpdateCRYPTOCAP:BTC #BTC $42,070 support in effect, current daily with potential to put bullish engulfing on. Eying $43,145 test. RSI looking good, Low on volume as of now, Green days ahead 🤩🤩! $40,583 key support, $44,174 and $44,860 key resistance areas.

$BTC Daily UpdateCRYPTOCAP:BTC CRYPTOCAP:BTC Descending Triangle forming on 1D and 4H, let's see in what direction this breaks, $40,583 support in effect followed by a bearish engulfing on 4H, if 4h shoots closing above $42,070 the Descending Triangle will break bullish, previous daily close with bearish engulfing

$BTC Daily UpdateCRYPTOCAP:BTC #BTC $42,070 resisted and $43,145 resisting as expected, $42,070 current support, RSI on 4h and 1d looks fine, Previous daily close bullish, $44,174 retest likely then $44,860 key resistance to break, Continue watching given S/R

$BTC Daily UpdateCRYPTOCAP:BTC #BTC current daily and 4h candle not looking good as of now as a bearish engulfing forms, $40,583 support testing, avoided bearish engulfing follow up yesterday with previous daily closing above current support. Watch given S/R

$BTC Daily UpdateCRYPTOCAP:BTC #BTC dropped to $40,583 support Currently struggling at $41,577 support area. $43,145 support required to reattempt at $44,174 resistance. Bearish engulfing on last daily close, should avoid follow up today. Current key support $39,458, expect resistance at $42,070 & $43,145
BITCOIN still trading very similarly to 2016. Still missing out?We have published quite a handful of Bitcoin (BTCUSD) analyses that compare in detail the current Cycle with that of 2014 - 2017. A representative sample of such study is the one below that we made on July 31:
People were still in denial that BTC would extend the recover that started after the FTX crash but we analyzed in detail why we thought that was the case. As you can see the classification in phases helped a lot and turned out to be very accurate at least so far.
** Pre Halving caution? **
So what now? The price has come very close to the 0.786 Fibonacci retracement level, which on the week of June 13 2016 cause a strong rejection which in the next 7 weeks extended as low as the 0.5 Fib and the 1W MA50 (blue trend-line).
** Are we accelerating on this Cycle? **
However that was after that Cycle's Halving (no 2, week of July 04 2016) and at the moment we are roughly 18 weeks (126 days) before (the next) Halving 4. If the recent phase has been indeed accelerated by the ETF speculation, then we have already entered the last period before the true parabolic rally of the Bull Cycle, what you can see on the chart as the '0.786 to ATH' range, which was 37 weeks (259 days) from the 0.786 Fib High (June 13 2016) to the 1W candle that made a new All Time High (ATH) on February 27 2017. According to that model, we can expect prices above 65000 by August 19 2024 (notice that even the ATH is on Nov 08 2021, the Fibs were taken from the April 12 2021 High, the true Cycle Top based on the 1W RSI).
** The underlying RSI trend-line **
Speaking of the 1W RSI, on top of the previous, very accurate pattern, I have identified an underlying trend-line (dashed) which shows that after it made a fake-out break above it, the RSI pulled-back on the recent lows Support, where the price's 0.5 Fib and 1W M50 cluster was. You can use that as an additional indicator to accumulate more BTC before the ATH gets tested.
So what do you think? Will Bitcoin pull back that much before the Halving and the eventual ATH test or you think we are going straight to +65k? Feel free to let us know in the comments section below!
-------------------------------------------------------------------------------
** Please LIKE 👍, FOLLOW ✅, SHARE 🙌 and COMMENT ✍ if you enjoy this idea! Also share your ideas and charts in the comments section below! This is best way to keep it relevant, support us, keep the content here free and allow the idea to reach as many people as possible. **
-------------------------------------------------------------------------------
💸💸💸💸💸💸
👇 👇 👇 👇 👇 👇

$BTC Daily updateCRYPTOCAP:BTC #BTC as expected $43,145 support good, $43,868-$44,174 resistance range holding strong, RSI on 4h looking good, weak volume in last 12 hours, gaining $44,174 support will help reattempt at $44,860 resistance , $45,622-$45,876 next resistance range to watch the $46,623.

$BTCUSD History Repeats itself - LONGIn continuation of our recent analysis , we meticulously conducted a comprehensive examination of BITSTAMP:BTCUSD price action. Employing a multifaceted approach, we synthesized various data inputs and discerned nuanced market conditions.
Our analysis delved into the historical 4-hour timeframe, specifically referencing November 4th, 2015. It is essential to note that the historical data, when viewed through the lens of 'relativity,' provides invaluable insights. As time elapses and market volume evolves, price action exhibits variations. This relativity facilitates a meaningful comparison between the present asset conditions and historical benchmarks.
Currently , a robust Fibonacci retracement analysis reveals a noteworthy gap of +33.381% spanning from the support zone to a key resistance level at 47,214. Upon confirmation, an anticipated swift retracement is projected, targeting approximately -41.38% at ±28.316. This critical juncture is anticipated to mark the commencement of Phase 2 within the Bull Cycle, propelling BTC price action to unprecedented heights.

$BTCUSD Approaching Monthly Liquidity level - LONGMonthly Liquidity Level (MLL) : BTCUSD is currently approaching a critical Monthly Liquidity level at 39965, historically significant for its role as support or resistance.
Anticipated Increase : An expected 5.6% surge within one candle is predicted. This surge is considered a precursor to the initiation of a long-awaited Bull Cycle.
Long-Term Target: The analysis sets a bullish target at 131k, suggesting a sustained upward trend beyond the immediate surge.
Probability Indicator : Recent market activity indicates a substantial inflow of capital over the past few days. This positive money flow is a bullish signal.
Volatility Assessment : Volatility has remained stable leading up to the critical level. However, anticipation is for a spike in volatility, especially with the liquidation of short positions at 39965.
Risk Factor : Traders should exercise caution as predicting price movements, especially in cryptocurrency markets, involves inherent risks. It's crucial to monitor the situation closely and be prepared for unexpected market reactions.
This analysis combines key technical elements, emphasizing the significance of the Monthly Liquidity level, anticipated price movements, and the interplay of volatility and market sentiment. Always consider risk management strategies when acting on technical analyses.

$BTC Daily UpdateCRYPTOCAP:BTC #BTC Beautiful test through $38,509 resistance here, currently testing $38,768 resistance, $38,509-$38,768 resistance range still holding, support tested upon break at $38,008, current support $38,008. Eyeing $39,458 resistance, Bullish engulfing on previous 1d close

$BTC Daily UpdateMIL:BTC #BTC $37,499 support in effect, two attempts on $38,509, current 4h not looking good - must avoid bearish engulfing, last 1D closed bearish, $38,768 support will allow $39,458 test - next key resistance.

$BTC Daily Update (bearish divergance)CRYPTOCAP:BTC #BTC slipping below $37,499, struggle here. last 4h closed with bearish engulfing, $36,868 support highly likely in short term, Bearish engulfing on 1D also suggesting support test, bearish divergence on 1D and 4H could be at play, alts will follow. $36,868-$36,214 support range.

Bitcoin- Back at resistance. Will it break this time?In my previous BtcUsd analysis, I said that 35k-35.5k is strong support for bitcoin and the main cryptocurrency remains bullish as long as this level is intact.
As we can see from the chart, BtcUsd touched and reversed from this zone 3 times in the past month suggesting there is a strong demand under 36k.
Yesterday the price rose back to resistance and I'm looking for a break.
In this instance, Bitcoin could pass above the important 40k level.
I remain bullish as long as support is intact.

$BTC Daily UpdateCRYPTOCAP:BTC #BTC $36,214 support held good, testing $37,499-$38,008 resistance range now, 4th attempt here, Previous 1D closed hella bullish! RSI on 1d and 4h looking good, $36,838 support not yet tested

$BTC Daily updateCRYPTOCAP:BTC #BTC broke $36,868 support, back above $36,214 - yet to be tested for support, Binance's Cz stepping down news hit with bearish engulfing on 1D, jumping back up good, must hold above $36,214 to avoid follow thru. Expect resistance at $36,868.

$BTC Daily UpdateCRYPTOCAP:BTC #BTC $37,499 resistance holding strong, $36,838 support tested and held beautifully, current support at $36,868. Previous daily closed with bullish pin bar, RSI on 1D & 4H looking good, struggling to gain $37,499 as a support, currently testing. Continue watching given S/R


$BTC Daily UpdateCRYPTOCAP:BTC #BTC testing $37,499 resistance, last 1D closed with bullish engulfing, needs a follow thru today to take $38,008 support. RSI on 1D and 4H looking good, 3rd attempt on key resistance range underway, $36,868 support not yet tested
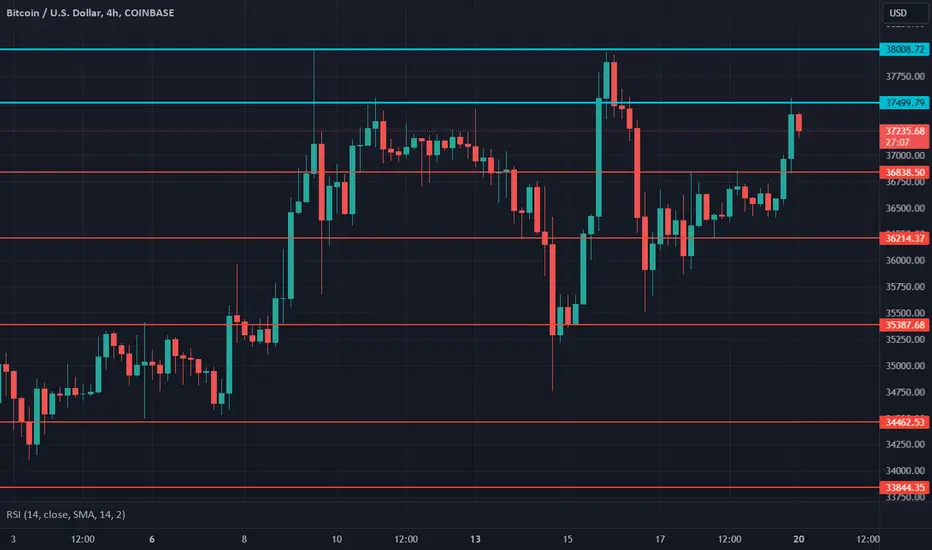
$BTC Daily UpdateMIL:BTC #BTC failed to follow thru bullish engulfing on 1D, $36,214 support testing, failed to gain $37,499, like I said expect some struggle in this key resistance range $37,499-$38,008. 4H and 1D both RSi looking goods, Current support at $35,387.

$BTC Daily UpdateCRYPTOCAP:BTC #BTC Given resistance at $38,008 tested, as expected struggle is normal in this range, bearish engulfing on last 4h close, $37,499 testing for support, RSI on 4H looking good, beautiful bullish engulfing on 1D, let's see if follows thru, next resistances $38,768, $39,458,

$BTC Daily UpdateCRYPTOCAP:BTC #BTC $36,214 support in effect, beuatiful previous 4h close showing good support here, nice consolidation underway, RSI looks good, $37,499-$38,008 Key resistance range here

Bear in high levelFollowing the movement of Sharp Bitcoin, a correction can be expected from the price of $28,900 to $27,300.
