$BTC Daily UpdateCRYPTOCAP:BTC #BTC Looking good, managed $33,844-$36,214 range throughout the weekend, given resistance at $35,384 holding strong, RSI on 4h looking good, previous 4h looks fine, weak volume as of now, last daily closed good, awaiting $36,214 break here.
Btcsignals

$BTC Daily UpdateCRYPTOCAP:BTC #BTC on $34,514 support here, struggle at $35,387-$36,214 resistance area. RSI on 4H looking good, previous 4h closed fine, currently testing support. Watch given S/R, next leg up will gain $36,214 support.

$BTC Daily UpdateCRYPTOCAP:BTC #BTC Took $35,387 support, currently testing support, previous 4h closed good, current 4h with weak volume. Very good follow up to bullish pin bar from Tuesday with last 1D close, $36,214 given resistance test coming up, Watch given S/R

BTC in new way My RNN divergence script has been sitting on an important resistance level, and the number of bearish predictions keeps increasing. If we look at the past, similar prediction counts have led to negative outcomes.
However, it's important to note that things like interest rates could also affect the markets, and this is not a standard way to look at it. It's always important to keep your eyesight wide and consider all perspectives when making trading decisions.
Good luck on your trades!

$BTC Daily UpdateMIL:BTC #BTC Given support $33,844 holding, previous 4h closed bearish with potential to test support, RSI on 4h looking good, $34,462 initial resistance holding, current moving range $33,844-$35,387, RSI on daily remains overbought, next leg up could test $36,214, watch given S/R

BTC BUY MORE !!!HELLO TRADERS,
As i can see BTC chart with cypher harmonic pattern its doing a great job fore new entries i am looking for a breakout 32k $ i is a clear view for a bull run and EFT can get approval anytime and this is just an trade idea kindly share with us Ur thoughts in comments & stay tuned new updates

BTC/USDT --->PREDICTION PATHWAY (Sell Position)hi
according previous analysis (attached) it comes up to touch the target but but but it has big problem and bad news for holders it would come back down again for 3 result:
1- before it touched support comes up !!
2- it has unsettled surface 2 times
3- it has some unresolved surface
in my opinion it will see lower price level again. ( i am sure.)
anyway i know some guys disagree but that's not important like when BTC was 60000 AND FINALLY RECIEVED 15K$.
Don't forget money management .
be profitable.
(I attached previous analysis)

$BTC Daily UpdateCRYPTOCAP:BTC #BTC Given key resistance at $34,462 holding, support at $33,844 in effect with continued test, previous 4H closed with bearish pin bar, 1D close also weak, RSI on 4H and 1D in oversold region, Watch given S/R

$BTC Daily Update CRYPTOCAP:BTC #BTC All key support and resistance areas to watch in short term for $28.5k to $38K price range. Previous daily closed with amazing climb and current daily following up, $34,462 testing (key resistance area here), next $35,387, Support at $33,844 yet to be tested

$BTC Daily UpdateMIL:BTC #BTC $30,623 testing for support, beautiful push on last 4h, expect resistance from $31,010-$31,372. RSI in oversold region on 4H and 1D, expect struggle at $30,623, gaining $30,623 support will give a chance to test $31,372 (last attempted in July), watch $31,372 & $31,861
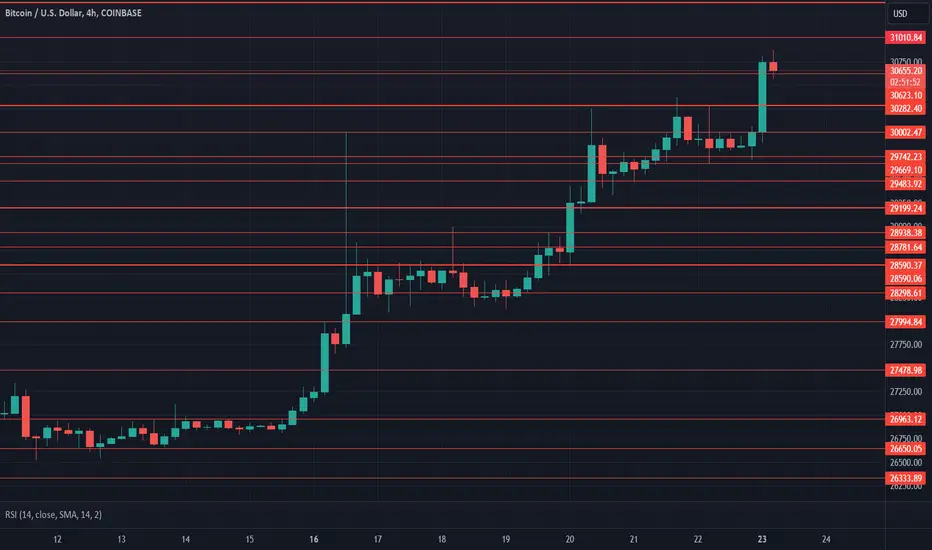
$BTC Daily Update with key S/RCRYPTOCAP:BTC #BTC WOW! Bullish engulfing played out as expected taking $29,199 support, $30,282 resisted last climb, must hold $29,742 support to reattempt at $30,282. Previous 4h closed bearish, expect $29,742 support test, RSI in oversold region on 4H and 1D also suggesting test, $30,282-$30,623 next key resistance range to watch for and then $31,372, key support areas $29,199, $28,590, $27,994.

$BTC Daily UpdateCRYPTOCAP:BTC #BTC Gained $28,781 support, $28,938 resistance testing, current support looking good. RSI on 4H oversold, expect struggle ranging $28,781-$28,938, put bullish engulfing on previous 1d close, if followed thru expect $29,199 support test. Watch given S/R

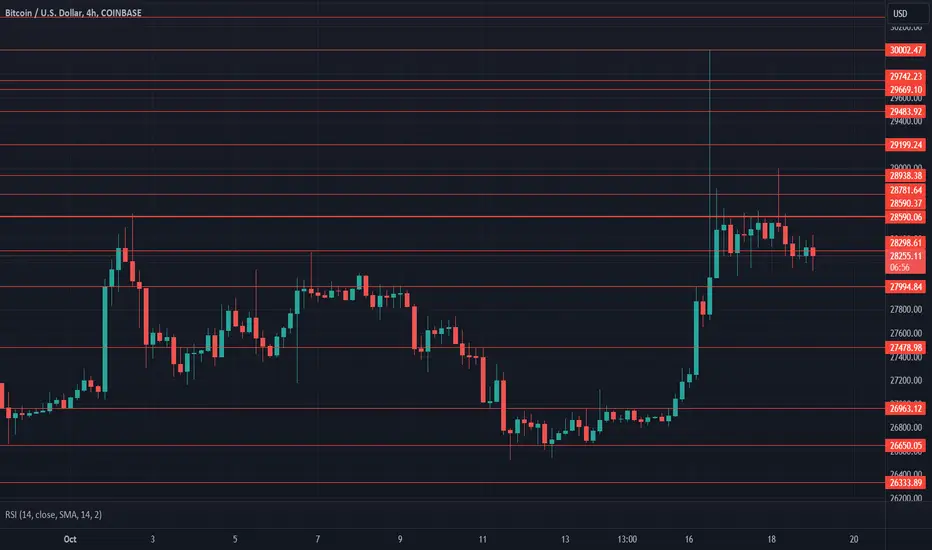
$BTC Daily UpdateCRYPTOCAP:BTC #BTC broke $28,298 support, currently testing to hold. $27,994 support in effect, 4H RSI looking good, Previous daily close failed to follow bullish close from Tuesday, last daily closed bearish. Current support range $27,478-$27,994. Must hold $27,994 to reattempt $28,781
$BTC Daily UpdateCRYPTOCAP:BTC #BTC Bearish engulfing played out dropping towards $26,650 support which held as expected being a key support, $28,781 resistance testing as of now, RSI on 4h oversold, bullish engulfing coming up on 1D with RSI approaching oversold region, next key resistance $29,742, Current support $28,298, gaining $29,742 will help test $30,623.

Bitcoin - Short; For now... Then, dependent on what happens around the $20,000 level, up, then down, ... etc., etc.
This is all speculation, of course, then again, that is the name of the game. - Right?!
Trade it as it unfolds.

$BTC Daily UpdateCRYPTOCAP:BTC #BTC stuck to $27,994 test, RSI on 4h looks good, weak volume, previous 4h closed good, 1D close looks good too. Spent weekend testing $27,994😂😂, Requires $28,298 support to avoid fakeout, current support $27,478. Watch given S/R

$BTC Daily UpdateCRYPTOCAP:BTC #BTC and we have regained $27,478 support following up to 4H bullish hammer yesterday😎, Previous 1d closed with bullish engulfing, follow thru will bring $27,994 test. RSI looking good on 4H and 1D. Continue watching given S/R
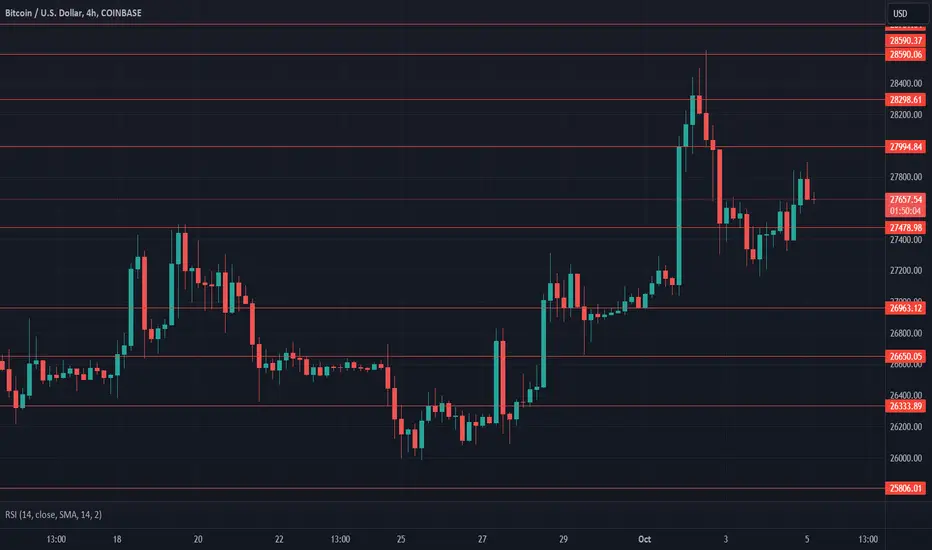
$BTC Daily UpdateCRYPTOCAP:BTC #BTC dropped below $27,478 support, Previous 4h close looks good, RSI on 4h also good, 1D closed testing for support, Current range $26,963-$27,478, 4H closed good with bullish hammer just now, possibility to regain support of $27,478. Watch given S/R

Bitcoin- Back to support?On 27 September I recommended a buy trade for Bitcoin saying that the cryptocurrency could rise and test 28500 resistance.
This target was reached on Monday and BtcUsd started to drop again.
Although I had a short-term buy trade, my bearish medium-term outlook has not altered and after this new test of resistance I think Btc will roll back down to support
At this moment we have Bitcoin just above confluence support and a rebound could follow.
However, I will use this rebound for a short trade against the recent high.
My target is 25k support

Don't Buy BTC now Until the Correction is CompletedTechnical Analysis:
- BTC is still doing a correction in wave ((2)) in black
- H1 & H4 right side is turning down
Technical Information:
- Wait for the correction in order to buy in wave ((2)) when it's done

$BTC Daily UpdateMIL:BTC #BTC $27,994 testing for support, beautiful break thru $27,478, $28,298 resistance holding. 4H RSI settling down but still overbought - requires to hold $27,994, previous daily close looks very good with RSI looking good too. Watch given S/R

$BTC Daily UpdateCRYPTOCAP:BTC $26,650 support looks good, $26,963 resisting, previous 1d closed neutral, $27,478 remains key resistance. volume dry since last 12 hours, could retest $26,650 support if failed to gain $26,963. Watch given S/R

$BTC Daily UpdateCRYPTOCAP:BTC Previous 4H closed bearish, gained $26,333 support and testing, 1D closed with bearish pin, Dry volume on 1D and 4H, RSI looks fine, Could retrace to $25,806 support, Watch given S/R
