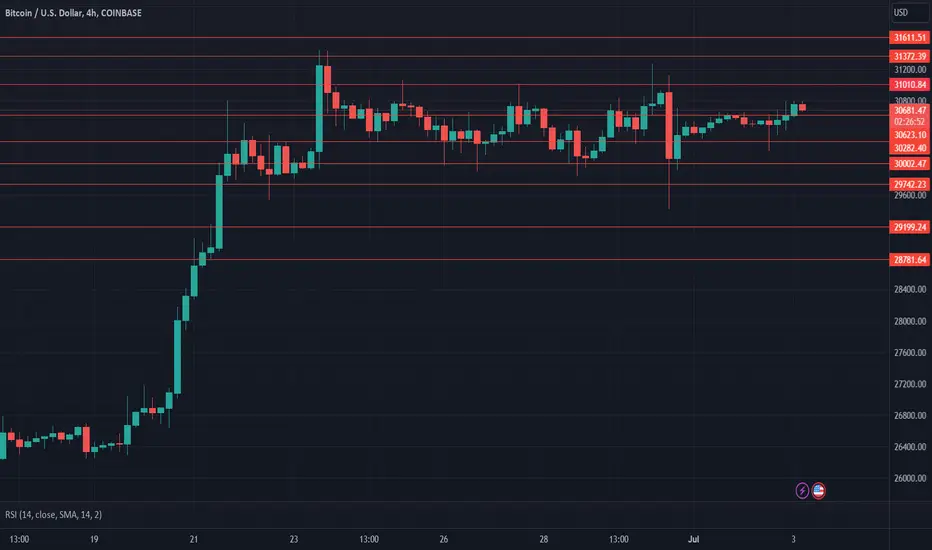
$BTC Daily UpdateCRYPTOCAP:BTC #BTC tested $31,372 as expected😎, resistance here is obvious. $31,010 support testing with bearish engulfing forming on current 4h and previous 4h close with bearish pin bar. Support $31,010 remains at risk, 1D followed thru to bullish pin bar from Sunday beautifully!
Btcsignals

$BTC Daily UpdateCRYPTOCAP:BTC #Bitcoin looking good on $30,623-$30,282 support area, RSI at 56, 1W closed fine. Daily closed very good, expect $31,372 retest if followed thru today.
BTCUSDT can ascend further!➡️falling wedge pattern it means that the price would increase and the price has already broken the pattern and Pullback is complete it. means price can rice to top of channel.
🌟 Bullish signals in the PRZ area are:
- Dynamic Support
-Broadening Wedge
⭐ Note if the Dynamic Support is broken downwards with the strength of Bearish candles from the bottom , this analysis of ours will be failed.
✅Thank you, and for more ideas, hit ❤️Like❤️ and 🌟Follow🌟!

Hi, I see A very good Swing tradeHi, I see A very good Swing trade opportunity
Risk Reward is very good Risk to reward is almost 7 times
good luck every one

$BTC Daily update#BTC CRYPTOCAP:BTC Bullish engulfing on last 4h close, current 4h attempted to follow up but currently with a wick looking ugly. $31,010 resistance holding, $30,623 support testing. Less than 2h to close current 4h, must close above $31,010 to avoid $30,282 support test.
Bitcoin- Stalling at resistanceBitcoin reached 30k resistance zone again, but, instead of up continuation, the coin is stalling and a reversal could be next.
Considering the importance of the zone and the fact that BTC is by far out of the woods, we could see a continuation of the downtrend in the next months.
My first bearish target is the support trend line of the recent channel, but, as I said, a break under would lead to down continuation and a new low under 15k could be next for the next 6 months or so.
Anyway, in the short term, spikes and possible rallies should be sold with a 28k target followed by 25.

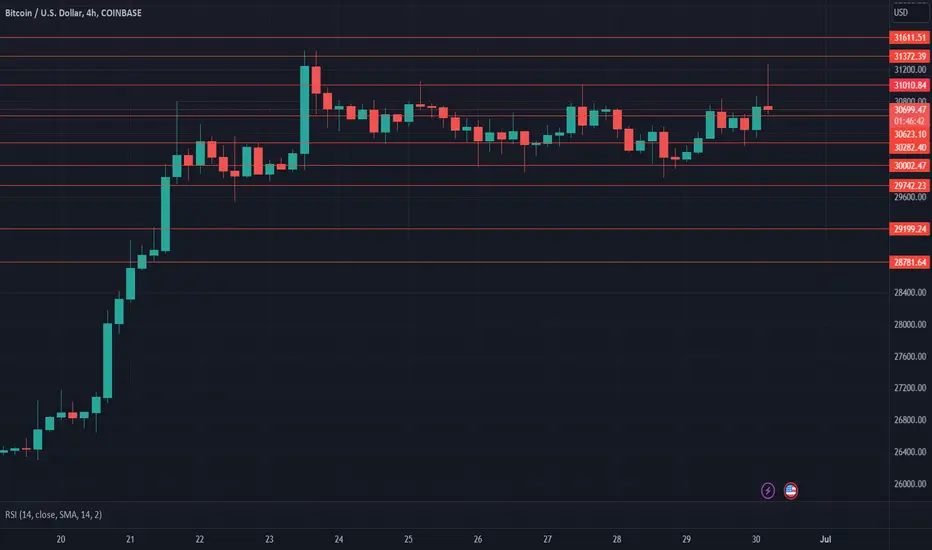
$BTC Daily UpdateCRYPTOCAP:BTC #BTC Given support at $30,282 remains in effect, good attempt on $31,010 yesterday but failed, last 4h closed poorly. 1D closed with bullish engulfing but current daily not looking good with 19h to close expecting good close if not a follow thru. Supports remain at risk.

$BTC Daily UpdateCRYPTOCAP:BTC #BTC $30,282 support in effect, reattempted $31,010 yesterday. Last 4H close looks good, 1D closed bearish, $30,002-$30,282 support range testing. $30,623 initial resistance. Needs to take $31,611 support to ensure no fakeouts.
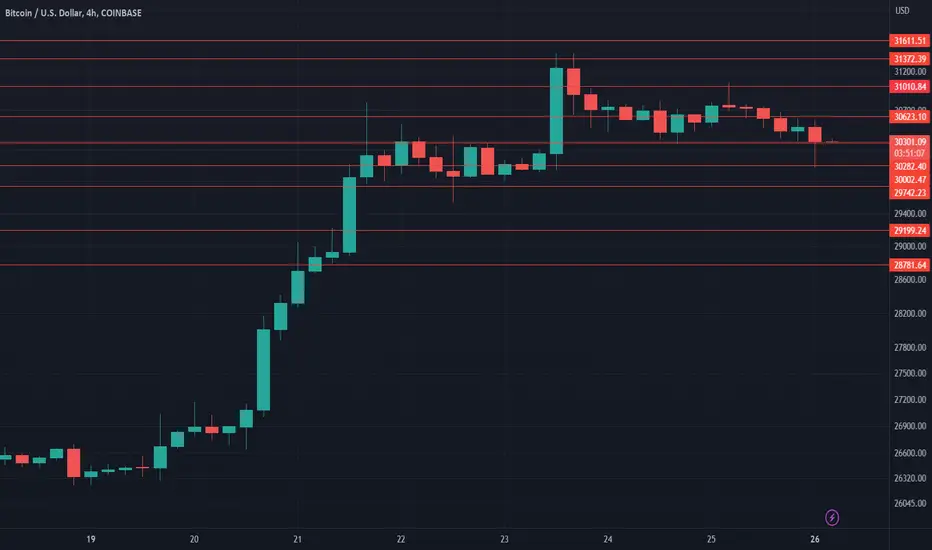
$BTC Daily updateCRYPTOCAP:BTC #BTC struggle at $30,282 resistance, $29,742 support holding, given key support and resistance remains effective.

$BTC Daily UpdateCRYPTOCAP:BTC #BTC $30,623 resistance holding, $29,742 short term key support. $29,199 key support to watch. On 1D bullish engulfing from Monday followed thru great with daily closing bullish yesterday. First Reattempt at $30,623-$31,010 since April, $31,611 next key resistance.

BTCShowing a clear break of major support and resistance. Take out the highs of $31,000 and we likely going straight rocket to $40K

$BTC Daily UpdateCRYPTOCAP:BTC #BTC $26,650 resistance holding strong, $26,333 saved against bearish engulfing on 4h, over 24h of struggle between $26,650-$26,333. $26,963 support needed. Watch given S/R

💥 BTCUSD 4H-TIMEFRAME ANALYSIS💥 BTCUSD 4H-TIMEFRAME ANALYSIS
💗Hello ladies and gentlemen
This is my new idea for 💥 Bitcoin
ABCDE
Head and sholder
I hope my idea is clear
Support me by like and share thank you
Stay Safe💯💲💲💲
Good luck💰😍

$BTC Daily UpdateCRYPTOCAP:BTC #BTC $26,333 support gained and holding, Last 4H looks nice, Time to see if it can take $26,963 or drop back to $25,806. Watch given S/R

$BTC Daily UpdateCRYPTOCAP:BTC #BTC Beautiful bullish engulfing followed thru on 4h, $26,333 resistance testing, struggling hard here. Gaining $26,333 support will be good to reattempt at $27,478. Current support $25,806 untested, remains at risk, requires confirmation of support.

$BTC Daily UpdateCRYPTOCAP:BTC #BTC hahaha, as expected $25,336 risk played out, $24,969 testing for support. 1D close looks very bad. No sign of reversal on 4h as of now. Expect resistance from $25,336, Next key support at $24,129, breaking $24,690 will result in test of key support.

$BTC Daily UpdateCRYPTOCAP:BTC #BTC Tipsy at $25,806😅, Given resistance $26,333 rejected last attempt putting bearish engulfing on 4h, 1d closed with bearish pin if followed thru today expect $25,806 test with $25,336 at risk, Watch given S/R

$BTC Daily UpdateCRYPTOCAP:BTC #BTC Managed to hold $25,806 support, $26,333 resistance in effect as expected. $26,650 support required to reattempt at $27,478.

BTC SIGNALhello guys im here with another trade time its time to buy.
I found very well place to buy now you can check altcoins too.
- HAVE A GOOD RISK MANAGEMENT -
i suggest 5% of your futures balance
dont forget to set StopLoss

BITCOIN Strong long-term buy signal by the BBWP!Bitcoin (BTCUSD) just flashed one of the rarest buy signals on the 1W time-frame. The Bollinger Band Width Percentile (BBWP) bottomed at 0%, giving a narrow width signal. Historically, when the price was above the 1W MA20 (red trend-line) during that signal (4 times/ green circle), it skyrocketed shortly after, while when it was below (1 time/ red circle) it dropped massively.
At the moment the price is on the 1W MA20 and it will be interesting to see if BTC closes above or below it, as it can influence the trend of the coming weeks. What do you think, will it close above it and skyrocket or below and decline? Feel free to let us know in the comments section below!
-------------------------------------------------------------------------------
** Please LIKE 👍, FOLLOW ✅, SHARE 🙌 and COMMENT ✍ if you enjoy this idea! Also share your ideas and charts in the comments section below! **
-------------------------------------------------------------------------------
💸💸💸💸💸💸
👇 👇 👇 👇 👇 👇

$BTC Daily UpdateCRYPTOCAP:BTC #BTC Beautiful comeback but if it'll last or not is to see, already testing $26,963 support. $27,478 key resistance held. Bullish engulfing on last daily close, requires follow up today. Current 4H looking ugly with just 45 mins to close.

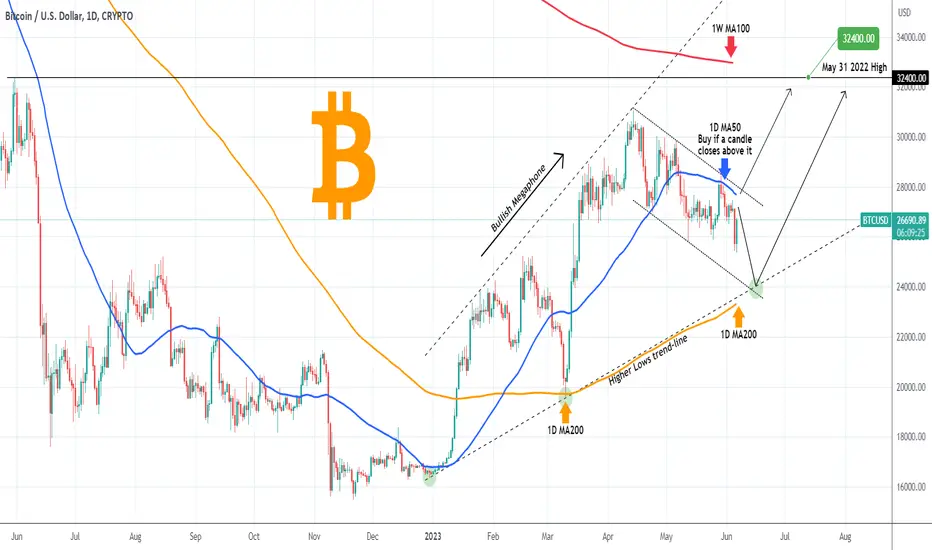
BITCOIN The Megaphone bottoms lower, unless this breaks first.Bitcoin (BTCUSD) made a new Lower Low since the short-term Channel Down started on April 14 and is rebounding in the past five hours. The long-term pattern remains a Bullish Megaphone and this Channel Down is the corrective wave towards the Higher Lows trend-line. For as long as it holds, it is likely to see it bottom on the 1D MA200 (orange trend-line) just like it happened on the March 10 Higher Low.
Be prepared though to buy earlier if the price closes a 1D candle above the 1D MA50 (blue trend-line), which hasn't happened since May 06 (exactly 1 month ago). In either case, our target is the next Resistance at 32400 (May 31 2022 High), which is where the 1W MA100 (red trend-line) is headed to, the last remaining MA Resistance.
-------------------------------------------------------------------------------
** Please LIKE 👍, FOLLOW ✅, SHARE 🙌 and COMMENT ✍ if you enjoy this idea! Also share your ideas and charts in the comments section below! **
-------------------------------------------------------------------------------
💸💸💸💸💸💸
👇 👇 👇 👇 👇 👇
Bitcoin=- 25k is strong floorOver the weekend I've written that for a more clear bullish outlook, BTC needs to pass above 27500 zone resistance.
After a small consolidation, the price dropped hard yesterday following Binance CEO problems.
However, looking at the chart, the outlook remains bullish, with the price both above 25k important horizontal support and the ascending trend line started at the beginning of the year.
More, the drop from above 30k started in May is clearly corrective in nature with price overlapping and lacking impulse.
I remain bullish for now with more confirmation for a buy trade coming with the price above 27k
